Fine-grained Visual Classification with High-temperature Refinement and Background Suppression
基于高温精炼与背景抑制的细粒度视觉分类
Abstract—Fine-grained visual classification is a challenging task due to the high similarity between categories and distinct differences among data within one single category. To address the challenges, previous strategies have focused on localizing subtle discrepancies between categories and enhencing the discri mi native features in them. However, the background also provides important information that can tell the model which features are unnecessary or even harmful for classification, and models that rely too heavily on subtle features may overlook global features and contextual information. In this paper, we propose a novel network called “High-temperaturE Refinement and Background Suppression” (HERBS), which consists of two modules, namely, the high-temperature refinement module and the background suppression module, for extracting discriminative features and suppressing background noise, respectively. The high-temperature refinement module allows the model to learn the appropriate feature scales by refining the features map at different scales and improving the learning of diverse features. And, the background suppression module first splits the features map into foreground and background using classification confidence scores and suppresses feature values in lowconfidence areas while enhancing disc rim i native features. The experimental results show that the proposed HERBS effectively fuses features of varying scales, suppresses background noise, disc rim i native features at appropriate scales for fine-grained visual classification.The proposed method achieves state-of-theart performance on the CUB-200-2011 and NABirds benchmarks, surpassing $93%$ accuracy on both datasets. Thus, HERBS presents a promising solution for improving the performance of fine-grained visual classification tasks. code will be available: https://github.com/chou141253/FGVC-HERBS
摘要—细粒度视觉分类由于类别间高度相似且类内数据差异显著而极具挑战性。现有方法主要聚焦于定位类别间细微差异并增强判别性特征,但背景信息同样重要——它能提示模型哪些特征对分类无用甚至有害,而过度依赖细微特征的模型可能忽视全局特征与上下文信息。本文提出"高温精炼与背景抑制"(HERBS)网络,包含高温精炼模块和背景抑制模块:前者通过多尺度特征图精炼促进多样化特征学习,使模型自适应选择合适特征尺度;后者基于分类置信度分割前景/背景,在低置信区域抑制特征值同时增强判别性特征。实验表明HERBS能有效融合多尺度特征、抑制背景噪声,为细粒度分类提取最佳尺度特征。该方法在CUB-200-2011和NABirds基准测试中达到93%以上的准确率,刷新当前最优性能。代码已开源:https://github.com/chou141253/FGVC-HERBS
I. INTRODUCTION
I. 引言
INE-GRAINED visual classification (FGVC) is a chalF lenging task in computer vision that involves categorizing images into very specific and detailed categories, such as different species of birds[33], dogs[16], vehicle models[18], and medical images[50]. As shown in Fig.1, these four types of sparrows look almost identical, but from different perspectives, the same type of sparrow also looks very different. In contrast to coarse-grained classification, which involves identifying broad categories like “animals" or “vehicles," finegrained classification requires the ability to recognize subtle differences in visual features, such as color, texture, shape, and pattern, which often exist in small regions. These regions are referred to as disc rim i native regions or foreground regions.
细粒度视觉分类 (FGVC) 是计算机视觉领域的一项挑战性任务,旨在将图像划分到非常具体且细致的类别中,例如不同品种的鸟类[33]、犬类[16]、汽车型号[18]和医学影像[50]。如图1所示,这四种麻雀看起来几乎一模一样,但从不同角度观察时,同一品种的麻雀也会呈现显著差异。与识别"动物"或"交通工具"等粗粒度分类不同,细粒度分类需要具备识别颜色、纹理、形状和图案等视觉特征细微差异的能力,这些差异往往存在于微小区域中。这些区域被称为判别区域或前景区域。
Fine-grained recognition can be achieved by dividing objects into parts, such as eyes, feet, etc., and comparing corresponding regions for easier identification[37], [8], [24], [43], [14], [3], [41]. However, these methods require manual annotation, which is costly and even requires expert annotation. To overcome this issue, the weakly supervised methods[42], [39], [7], [12], [6], [47], [36] are proposed to find disc rim i native regions through class activation mapping (CAM)[49], [27] were proposed, offering training the network through higher response areas in the feature map without labels. In addition, the attention-based methods[48], [51], [52], [44], [15] are proposed to locate disc rim i native regions by identifying common high-response areas among feature maps. Furthermore, the success of Vision Transformer (ViT) in image classification has led to its implementation in fine-grained visual recognition tasks. These methods[46], [29], [9], [35], [21], [13] use self-attention maps to get information on foreground regions. The main efforts were focused on enhancing the differentiation of disc rim i native regions, while neglecting unselected regions. However, in cases where the model cannot obtain strong enough disc rim i native regions, it is useful to first exclude unimportant regions, called background. Motivated by this concept, we propose the Background Suppression (BS) module.
细粒度识别可以通过将物体划分为多个部分(如眼睛、脚等)并比较对应区域来实现更易辨识的效果[37][8][24][43][14][3][41]。然而这些方法需要人工标注,成本高昂甚至需要专家标注。为解决这一问题,弱监督方法[42][39][7][12][6][47][36]被提出,通过类别激活映射(CAM)[49][27]来发现判别性区域,无需标签即可通过特征图中高响应区域训练网络。此外,基于注意力的方法[48][51][52][44][15]通过识别特征图中共同的高响应区域来定位判别性区域。随着Vision Transformer(ViT)在图像分类中的成功,其也被应用于细粒度视觉识别任务。这些方法[46][29][9][35][21][13]利用自注意力图获取前景区域信息。现有研究主要聚焦于增强判别性区域的区分度,却忽略了未被选择的区域。当模型无法获取足够强的判别性区域时,首先排除不重要的背景区域将更为有效。受此启发,我们提出了背景抑制(BS)模块。
The proposed BS module shows better performance in FGVC tasks. In the first step of the BS module, the output confidence scores are utilized to classify regions into foreground and background. The foreground represents the disc rim i native area, while the background refers to the unselected or noisy part. Subsequently, the BS module suppresses the feature values in low confidence regions and enhances the disc rim i native features, thus improving the details of the target object and reducing the noise. Therefore, the BS module can be helpful, especially in cases where it is difficult to distinguish between foreground and background areas.
提出的BS模块在FGVC任务中表现出更优性能。BS模块的第一步利用输出置信度分数将区域分类为前景和背景。前景代表椎间盘原生区域,背景指未被选中或含噪声的部分。随后,BS模块抑制低置信度区域的特征值,同时增强椎间盘原生特征,从而提升目标物体的细节表现并降低噪声干扰。因此,该模块在难以区分前景与背景区域的情况下尤为有效。
The algorithm for extracting features from disc rim i native regions is important for the FGVG task. However, it can lead to the problem of losing contextual information due to the overuse of single or few specific categories of features. Therefore, we propose a high-temperature refinement module to enhance the learning of diverse features, including texture, shape, and appearance from various object categories. Specifically, the module initially uses higher temperatures to learn feature maps so that more global and contextual information can be captured. Subsequently, the feature maps were refined using lower temperatures to capture finer details. This approach allows to obtain richer features, to better classify similar objects, and to improve accuracy. It should be noted that the high-temperature refinement module can be considered as a form of knowledge distillation [11].
从判别性区域提取特征的算法对于FGVG任务至关重要。然而,由于过度使用单一或少数特定类别的特征,可能会导致丢失上下文信息的问题。因此,我们提出了一种高温精炼模块,以增强对多样特征的学习,包括来自不同物体类别的纹理、形状和外观。具体而言,该模块最初使用较高温度学习特征图,以捕获更多全局和上下文信息。随后,使用较低温度精炼特征图,以捕捉更精细的细节。这种方法可以获得更丰富的特征,更好地分类相似物体,并提高准确性。需要注意的是,高温精炼模块可视为知识蒸馏[11]的一种形式。
The high-temperature refinement module also maintains an appropriate size of the disc rim i native region, which is advantageous for FGVC tasks. If the feature size is too small, the algorithm may not be able to capture the overall features of the object, resulting in incorrect classification. Conversely, if the feature scale is too large, the accuracy of FGVC tasks may be reduced due to excessive noise and redundant information.
高温精炼模块还能保持盘缘原生区域的适当尺寸,这对FGVC任务有利。若特征尺寸过小,算法可能无法捕捉物体的整体特征,导致错误分类;反之,若特征尺度过大,则可能因噪声和冗余信息过多而降低FGVC任务的准确性。
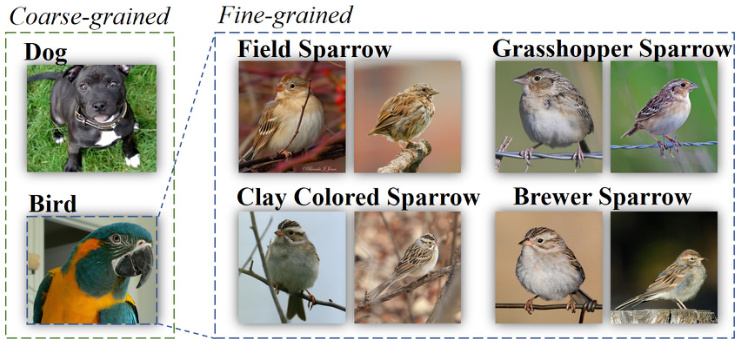
Fig. 1. Examples of visual classification for coarse-grained categories and fine-grained categories.
图 1: 粗粒度类别与细粒度类别的视觉分类示例。
In this paper, the proposed High temperaturE Refinement and Background Suppression (HERBS) can extract discriminative features and suppress background noise. This paper has two main contributions:
本文提出的高温精炼与背景抑制方法(HERBS)能够提取判别性特征并抑制背景噪声。主要贡献包括两点:
• The proposed HERBS can be integrated into various backbones, such as CNN-based networks and transformer-based networks. It also allows to perform end-to-end training. • The proposed HERBS outperforms state-of-the-art approaches, improving the accuracy to $93.1%$ and $93.0%$ on CUB200-2011[33] and NABirds[31], respectively.
• 提出的 HERBS 方法可集成到多种骨干网络中,例如基于 CNN 的网络和基于 Transformer 的网络,并支持端到端训练。
• 所提出的 HERBS 方法性能优于现有最优方案,在 CUB200-2011[33] 和 NABirds[31] 数据集上分别将准确率提升至 $93.1%$ 和 $93.0%$。
II. RELATED WORK
II. 相关工作
A. Fine-grained visual classification
A. 细粒度视觉分类
In the field of FGVC, there are two approaches for extracting disc rim i native features from subtle areas, broadly classified as object-part-based methods and attention-based methods.
在细粒度视觉分类(FGVC)领域,从细微区域提取判别性特征主要有两种方法:基于物体部件的方法和基于注意力机制的方法。
Object-part based methods aim to find object local areas for recognition by using a model to generate candidate regions, then extracting disc rim i native features from them. MACNN[48] trains positioning and classification accuracy at the same time through clustering of feature maps into object parts. This unsupervised classification enhances feature learning by dividing patterns into object parts. The approach allows for simultaneous learning of disc rim i native features and positions. S3N[6] finds the local extremes of each category response on the feature map to enhance features. In addition, WS-DAN[12] augment the data by cutting out local extremes to discover other disc rim i native features.
基于物体部件的方法旨在通过模型生成候选区域来定位物体局部区域进行识别,随后从中提取判别性特征。MACNN[48]通过将特征图聚类为物体部件,同时训练定位与分类精度。这种无监督分类通过将模式划分为物体部件来增强特征学习。该方法能同步学习判别性特征与位置信息。S3N[6]通过寻找特征图上各类别响应的局部极值点来增强特征。此外,WS-DAN[12]通过裁剪局部极值区域进行数据增强,以发现其他判别性特征。
Attention-based methods, on the other hand, use attention mechanisms to enhance feature learning and locate object details. MAMC[30] generates multiple sets of features enhanced by attention mechanisms, Cross-X[23] use attention maps from multi-excitation models to learn features from different caterories. API-Net[52] and PCA-Net[44] uses two images as input to calculate attention between feature maps to enhence disc rim i native representations. CAP[1] calculates the self-attention map of the output features to express the relationship between feature pixels, and SR-GNN[2] uses graph convolutional neural networks to describe the relationship between parts. CAL[25] adds a counter factual intervention to the attention map to predict the category. With the development of Transformer[32] in the computer vision field, many improved Vision Transformer architectures have been proposed, such as FFVT[35], SIM-Trans[29], TransFG[9], and AFTrans[45], these methods utilize self-attention maps in transformer layers to enhance feature learning and locate object details.
基于注意力的方法则利用注意力机制增强特征学习并定位物体细节。MAMC[30]通过注意力机制生成多组增强特征,Cross-X[23]采用多激励模型的注意力图来学习不同类别的特征。API-Net[52]和PCA-Net[44]以两幅图像作为输入,通过计算特征图间的注意力来增强判别性表征。CAP[1]通过计算输出特征的自注意力图来表达特征像素间的关系,SR-GNN[2]则采用图卷积神经网络描述部件间关联。CAL[25]在注意力图中加入反事实干预来预测类别。随着Transformer[32]在计算机视觉领域的发展,FFVT[35]、SIM-Trans[29]、TransFG[9]和AFTrans[45]等改进型视觉Transformer架构相继提出,这些方法利用Transformer层中的自注意力图强化特征学习与细节定位。
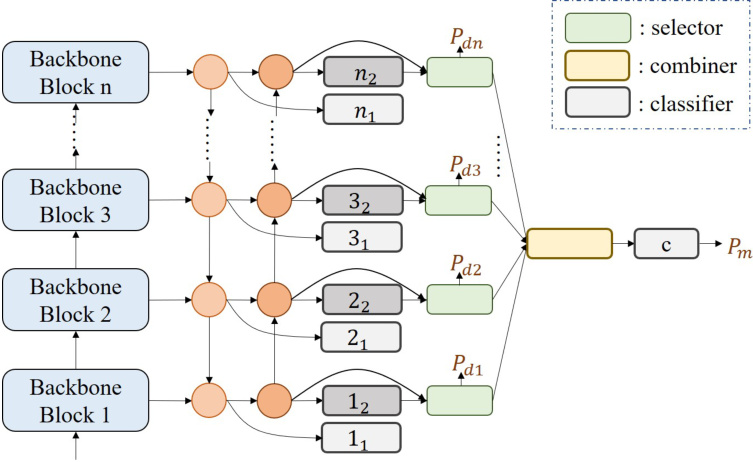
Fig. 2. The illustration of the model structure is shown, where the blue squares on the left represent the backbone blocks, which could be either Convolutionbased or Transformer-based. The circles in the middle part denote the multiscale feature fusion module, such as Feature Pyramid Network (FPN) or Path Aggregation (PA). The classifier, selector, and combiner on the right side depict the HERBS module.
图 2: 模型结构示意图。左侧蓝色方块代表主干网络模块(backbone blocks),可采用基于卷积(Convolution-based)或基于Transformer(Transformer-based)的结构。中间圆形区域表示多尺度特征融合模块,例如特征金字塔网络(FPN)或路径聚合(PA)。右侧的分类器(classifier)、选择器(selector)和组合器(combiner)共同构成HERBS模块。
B. Object detection
B. 目标检测
Supervised object detection methods have demonstrated significant results. The supervised YOLOv7[34] can achieve fast and high accuracy of detection. However, the manual labeling requirement for object positions limits its suitability for fine-grained visual recognition tasks.
监督式目标检测方法已展现出显著成果。监督式YOLOv7[34]能够实现快速且高精度的检测。然而,其对目标位置手动标注的要求限制了该方法在细粒度视觉识别任务中的适用性。
Weakly supervised object detection (WSOD) has been introduced as an alternative to overcome the limitations. This method only requires classification labels and generates pseudo bounding box targets through algorithms. For instance, WCCN[5] generates class activation maps to identify regions of interest, which are then fed into the classifier and corrected through multiple instance learning. WSOD2[40] scores virtual candidate boxes through Top-Down and Bottom-Up approaches, with the virtual box with the highest score serving as the target output for the next layer. MIST[26] refines regions of interest through self-training, while WSCL[28] improves the features of regions of interest through data enhancement and contrastive learning. These methods gradually discover the whole object through refinement processes, utilizing the output of the previous stage as the virtual target.
弱监督目标检测 (WSOD) 被提出作为克服这些限制的替代方案。该方法仅需分类标签,并通过算法生成伪边界框目标。例如,WCCN[5] 通过生成类别激活图来识别感兴趣区域,随后将其输入分类器并通过多示例学习进行校正。WSOD2[40] 采用自上而下和自下而上两种方式对虚拟候选框进行评分,得分最高的虚拟框将作为下一层的目标输出。MIST[26] 通过自训练优化感兴趣区域,而 WSCL[28] 则通过数据增强和对比学习提升感兴趣区域的特征。这些方法通过逐步优化过程发现完整目标,并利用前一阶段的输出作为虚拟目标。
III. METHOD
III. 方法
In Fig.2, the proposed High-temperature E Refinement and Background Suppression (HERBS) network is composed of the backbones, the top-down features fusion module, the bottom-up features fusion module, and the HERBS. The backbone can be either a Transformer-based model (e.g., Swin Transformer) or a Convolution-based model (e.g., ResNet). The top-down and bottom-up features fusion module is similar to the path aggregation network (PA)[20], which can be treated as a feature pyramid network (FPN)[19] with an additional bottom-up path.
在图 2 中,提出的高温 E 细化与背景抑制 (HERBS) 网络由主干网络、自上而下特征融合模块、自下而上特征融合模块以及 HERBS 组成。主干网络可以是基于 Transformer 的模型 (如 Swin Transformer) 或基于卷积的模型 (如 ResNet)。自上而下和自下而上特征融合模块类似于路径聚合网络 (PA)[20],可视为带有额外自下而上路径的特征金字塔网络 (FPN)[19]。
The proposed HERBS networks aims to learn diverse and disc rim i native features and improve the accuracy of several FGVC tasks. HERBS contains two modules: the background suppression (BS) module and the high-temperature refinement module. In the following sections, we refer to these two fusion modules as the top-down path and the bottom-up path. And the proposed HERBS, we will provide a comprehensive description of the design of the BS module and high-temperature module, including a detailed explanation of the use of the loss function and the integration of the HERBS module with various frameworks.
提出的HERBS网络旨在学习多样且具有判别性的特征,并提升多项细粒度视觉分类(FGVC)任务的准确率。该网络包含两大模块:背景抑制(BS)模块与高温优化模块。下文将这两个融合模块分别称为自上而下路径与自下而上路径。我们将全面阐述BS模块与高温模块的设计方案,包括损失函数的具体应用说明,以及HERBS模块与各类框架的集成方法。
A. Background suppression
A. 背景抑制
Let $h s_{i}$ denote the features map generated by the $i^{t h}$ backbone block, where $h s_{i}\in R^{C_{i}\times H_{i}\times\bar{W_{i}}}$ . Here, $C_{i}$ represents the number of channels, $H_{i}$ is the height, and $W_{i}$ is the width of the features map. The first step of the background suppression (BS) module is to generate the classification maps from these features map, which can be expressed as:
设 $h s_{i}$ 表示由第 $i^{t h}$ 个主干块生成的特征图,其中 $h s_{i}\in R^{C_{i}\times H_{i}\times\bar{W_{i}}}$。此处,$C_{i}$ 代表通道数,$H_{i}$ 为高度,$W_{i}$ 为特征图的宽度。背景抑制 (BS) 模块的第一步是从这些特征图生成分类图,其表达式为:
$$
Y_{i}=W_{i}h s_{i}+b_{i}
$$
$$
Y_{i}=W_{i}h s_{i}+b_{i}
$$
where $W_{i}$ is the weight of the $i^{t h}$ layer classifier, $b_{i}$ is its bias, and $Y_{i}$ is the classification maps, with dimensions $R^{C_{g t}\times H_{i}\times W_{i}}$ , where $C_{g t}$ is the number of target categories. Then the maximum score map is calculated from classification map. The process can be expressed as:
其中 $W_{i}$ 是第 $i^{t h}$ 层分类器的权重,$b_{i}$ 是其偏置项,$Y_{i}$ 是维度为 $R^{C_{g t}\times H_{i}\times W_{i}}$ 的分类图($C_{g t}$ 表示目标类别数)。随后从分类图中计算最大得分图,该过程可表示为:
$$
P_{m a x,i}=\operatorname*{max}(\mathrm{Softmax}(Y_{i}))
$$
$$
P_{m a x,i}=\operatorname*{max}(\mathrm{Softmax}(Y_{i}))
$$
where $P_{m a x,i}$ represents the i $^{t h}$ layer’s max score map. Next, the features with the top $\cdot K_{i}$ scores among all predictions are selected. The number of $K_{i}$ is selected based on the principle that $K_{i}>K_{j}$ when $i<j$ . Specifically, we set $K_{1}$ to $256,K_{2}$ to 128, $K_{3}$ to 64, and $K_{4}$ to 32. We select this value based on the principle that earlier layers can limit the performance of subsequent layers, and our experiments show that the accuracy is relatively insensitive to variations in this parameter if this principle is followed.
其中 $P_{max,i}$ 表示第 $i$ 层的最大分数图。接着,从所有预测中筛选出得分最高的前 $\cdot K_{i}$ 个特征。$K_{i}$ 的取值遵循 $i<j$ 时 $K_{i}>K_{j}$ 的原则。具体而言,我们设定 $K_{1}=256$,$K_{2}=128$,$K_{3}=64$,$K_{4}=32$。该数值的设定基于"浅层会限制深层性能"的原则,实验表明只要遵循该原则,模型精度对此参数的变化相对不敏感。
A graph convolution module is then employed to merge the selected features and make a prediction based on the merged features. At this stage, the BS module has the non-selected classification maps, referred to as the dropped maps, denoted as $Y_{d}$ , and the merged classification prediction, denoted as $Y_{m}$ . This process is depicted through the selector and combiner components as shown in Fig.2.
随后采用图卷积模块合并所选特征,并基于合并后的特征进行预测。在此阶段,BS模块拥有未被选择的分类图(称为丢弃图,记为$Y_{d}$)以及合并后的分类预测结果(记为$Y_{m}$)。该过程通过选择器与组合器组件实现,如图2所示。
The objective function of the merged classification prediction is a standard classification one, using cross-entropy to calculate the similarity between the prediction distribution $P_{m}$ and the ground truth label $y$ . The merged loss is calculated as follows:
合并分类预测的目标函数采用标准分类形式,通过交叉熵计算预测分布 $P_{m}$ 与真实标签 $y$ 之间的相似度。合并损失计算如下:
$$
P_{m}=\mathrm{Softmax}(Y_{m})
$$
$$
P_{m}=\mathrm{Softmax}(Y_{m})
$$
$$
l o s s_{m}=-\sum_{c i=1}^{C_{g t}}y_{c i}\mathrm{log}(P_{m,c i})
$$
$$
l o s s_{m}=-\sum_{c i=1}^{C_{g t}}y_{c i}\mathrm{log}(P_{m,c i})
$$
Here, $y_{c i}$ is the ground truth of $i^{t h}$ class, and $P_{m,c i}$ is the predicted probability of the $i^{t h}$ class. The summation is performed over the number of target categories $C_{g t}$ . This enhances the disc rim i native features in the selected area.
这里,$y_{c i}$ 是第 $i^{t h}$ 类的真实标签,$P_{m,c i}$ 是第 $i^{t h}$ 类的预测概率。求和操作针对目标类别数 $C_{g t}$ 进行,从而增强选定区域内的判别性特征。
The other objective of the BS module is to suppress features in the dropped maps and increase the gap between the foreground and background. The hyperbolic tangent function, tanh, is applied to the dropped maps, $Y_{d}$ , as shown in Eq.(5):
BS模块的另一个目标是抑制丢弃特征图中的特征,并增大前景与背景之间的差异。如公式(5)所示,我们对丢弃特征图$Y_{d}$应用双曲正切函数tanh:
$$
P_{d}=\operatorname{tanh}(Y_{d})
$$
$$
P_{d}=\operatorname{tanh}(Y_{d})
$$
Then, the dropped loss, $l o s s_{d}$ , is calculated as the mean squared error between the prediction and a pseudo target of $^{-1}$ , as defined in Eq.(6):
然后,丢弃损失 $loss_{d}$ 计算为预测值与伪目标 $^{-1}$ 之间的均方误差,如公式(6)所定义:
$$
l o s s_{d}=\sum_{i=1}^{C_{g t}}(P_{d,c i}+1)^{2}
$$
$$
l o s s_{d}=\sum_{i=1}^{C_{g t}}(P_{d,c i}+1)^{2}
$$
Note that the hyperbolic tangent function in Eq. (5) maps the values of the prediction into a range that is not restricted to probabilities. This is because we really want to separate foreground and background features even if the background have some other classes appearances.
需要注意的是,式(5)中的双曲正切函数将预测值映射到一个不限于概率范围的区间。这是因为我们确实希望分离前景和背景特征,即使背景中出现其他类别的外观。
In order to prevent all blocks’ feature maps from only having high responses in the same locations, we also incorporate the prediction of each layer into the training target as follows:
为了防止所有区块的特征图仅在相同位置产生高响应,我们还将每层的预测纳入训练目标,具体如下:
$$
P_{l i}=\mathrm{Softmax}\left(W_{i}(\mathrm{Avgpool}(h s_{i}))+b_{i}\right)
$$
$$
P_{l i}=\mathrm{Softmax}\left(W_{i}(\mathrm{Avgpool}(h s_{i}))+b_{i}\right)
$$
$$
l o s s_{l}=-\sum_{i=1}^{n}\sum_{c i=1}^{C_{g t}}y_{c i}\log(P_{l i,c i})
$$
$$
l o s s_{l}=-\sum_{i=1}^{n}\sum_{c i=1}^{C_{g t}}y_{c i}\log(P_{l i,c i})
$$
where Avgpool function aggregates all $H_{i}$ , and $W_{i}$ at each channel, and the number of blocks in the backbone is represented by $n$ .
其中Avgpool函数在每个通道上聚合所有$H_{i}$和$W_{i}$,主干网络中的块数由$n$表示。
The total BS objective is given by the weighted sum of the merged loss $(l o s s_{m})$ , dropped loss $(l o s s_{d})$ , and average layer loss $(l o s s_{l})$ , as shown in Eq.(9):
总BS目标由合并损失$(loss_{m})$、丢弃损失$(loss_{d})$和平均层损失$(loss_{l})$的加权求和给出,如式(9)所示:
$$
l o s s_{b s}=\lambda_{m}l o s s_{m}+\lambda_{d}l o s s_{d}+\lambda_{l}l o s s_{l}
$$
$$
l o s s_{b s}=\lambda_{m}l o s s_{m}+\lambda_{d}l o s s_{d}+\lambda_{l}l o s s_{l}
$$
where $\lambda_{m},\lambda_{d}$ , and $\lambda_{l}$ are the weights for the merged loss, dropped loss, and average layer loss, respectively. Specifically, We set $\lambda_{m}$ to 1, $\lambda_{d}$ to 5, and $\lambda_{l}$ to 0.3. These values were set to balance the foreground and background loss and were determined based on the training loss from the first three epochs.
其中 $\lambda_{m}$、$\lambda_{d}$ 和 $\lambda_{l}$ 分别是合并损失、丢弃损失和平均层损失的权重。具体而言,我们将 $\lambda_{m}$ 设为 1,$\lambda_{d}$ 设为 5,$\lambda_{l}$ 设为 0.3。这些值的设定是为了平衡前景和背景损失,并根据前三个训练周期的损失值确定。
B. High-temperature refinement
B. 高温精炼
The classifier $k_{1}$ and classifier $k_{2}$ in the Fig.2 are followed by the $k$ -th block features map, classifier $k_{1}$ is located within the top-down path while classifier $k_{2}$ is in the bottom-up one. The objective is to make classifier $k_{1}$ learn the output distribution of classifier $k_{2}$ . We define the output of classifier $k_{1}$ as $Y_{i1}$ and the output of classifier $k_{2}$ as $Y_{i2}$ . The refinement objective function helps the model to learn more diverse and stronger representations in the earlier layers while allowing later layers to focus on finer details. In other words, the high-temperature refinement module enables classifier $k_{1}$ to discover broader areas and classifier $k_{2}$ to focus on learning fine-grained and disc rim i native features. The refinement loss is calculated using the following equations:
图 2 中的分类器 $k_{1}$ 和分类器 $k_{2}$ 分别位于第 $k$ 个块特征图之后,其中分类器 $k_{1}$ 位于自上而下的路径中,而分类器 $k_{2}$ 位于自下而上的路径中。目标是使分类器 $k_{1}$ 学习分类器 $k_{2}$ 的输出分布。我们将分类器 $k_{1}$ 的输出定义为 $Y_{i1}$,分类器 $k_{2}$ 的输出定义为 $Y_{i2}$。该优化目标函数帮助模型在较早层学习更多样化和更强的表示,同时允许后续层专注于更精细的细节。换句话说,高温优化模块使分类器 $k_{1}$ 能够发现更广泛的区域,而分类器 $k_{2}$ 则专注于学习细粒度和判别性特征。优化损失通过以下公式计算:
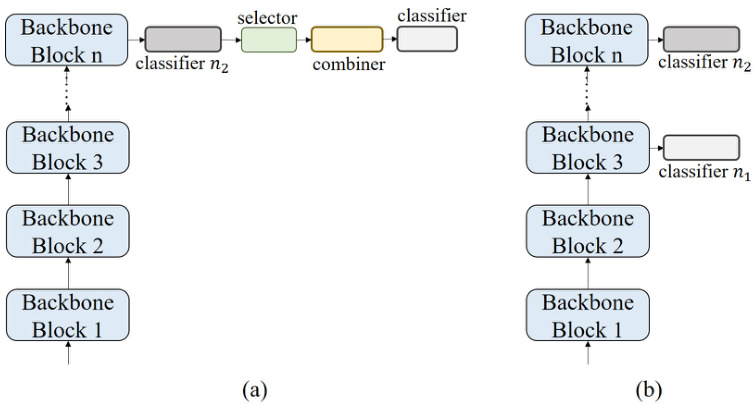
Fig. 3. Illustration of the structure of (a) basic background suppression module and (b) basic high-temperature refinement module.
图 3: (a) 基础背景抑制模块和 (b) 基础高温优化模块的结构示意图。
$$
\begin{array}{c}{P_{i1}=\mathrm{LogSoftmax}\left(Y_{i1}/Y_{e}\right)}\ {P_{i2}=\mathrm{Softmax}\left(Y_{i2}/T_{e}\right)}\ {l o s s_{r}=P_{i2}\log(\frac{P_{i2}}{P_{i1}})}\end{array}
$$
$$
\begin{array}{c}{P_{i1}=\mathrm{LogSoftmax}\left(Y_{i1}/Y_{e}\right)}\ {P_{i2}=\mathrm{Softmax}\left(Y_{i2}/T_{e}\right)}\ {l o s s_{r}=P_{i2}\log(\frac{P_{i2}}{P_{i1}})}\end{array}
$$
where $T_{e}$ represents the temperature at training epoch $e$ . The value of $T_{e}$ decreases as the training epoch increases, following a decay function defined as:
其中 $T_{e}$ 表示训练周期 $e$ 时的温度。$T_{e}$ 的值随着训练周期的增加而减小,遵循以下衰减函数定义:
$$
\begin{array}{r}{T_{e}=0.5^{\left\lfloor\frac{e}{-\log_{2}(0.0625/T)}\right\rfloor}}\end{array}
$$
$$
\begin{array}{r}{T_{e}=0.5^{\left\lfloor\frac{e}{-\log_{2}(0.0625/T)}\right\rfloor}}\end{array}
$$
We set the initial temperature $T$ to a high value, such as 64 or 128, in comparison to the knowledge distillation approach[11]. The aim is to encourage the model to explore various features even if the initial predictions are inaccurate. Then, as training progresses, the temperature gradually decreases, allowing the model to focus more on the target class and learn more disc rim i native features. By using this decay policy, the model can obtain diverse and fine representations and make accurate predictions.
我们将初始温度 $T$ 设置为较高值(如64或128),与知识蒸馏方法[11]形成对比。目的是鼓励模型探索各种特征,即使初始预测不准确。随着训练进行,温度逐渐降低,使模型更专注于目标类别并学习更具判别性的特征。通过这种衰减策略,模型能获得多样且精细的表征,从而做出准确预测。
The total loss of HERBS can be formulated as:
HERBS的总损失可表示为:
$$
l o s s_{h e r b s}=l o s s_{b s}+\lambda_{r}l o s s_{r}
$$
$$
l o s s_{h e r b s}=l o s s_{b s}+\lambda_{r}l o s s_{r}
$$
where $\lambda_{r}$ is the weight for refinement loss, which set to 1. And the HERBS network’s final output is the softmax of the sum of nine classifier results, consisting of four from the top-down approach, four from the bottom-up approach, and one from the combiner.
其中 $\lambda_{r}$ 是细化损失的权重,设为1。HERBS网络的最终输出是九个分类器结果的softmax之和,包括四个自上而下的方法、四个自下而上的方法和一个组合器的结果。
Note that in the HERBS network, $W_{i}$ and $b_{i}$ belong to classifier $k_{2}$ when $i$ equals to $k$ . We separately describe them because the BS module and high-temperature refinement module can be applied to the backbone alone, which is very flexible. The experimental results show that both modules can improve accuracy. Of course, when using the entire HERBS network, the model’s capability will result in even better performance.
请注意,在 HERBS 网络中,当 $i$ 等于 $k$ 时,$W_{i}$ 和 $b_{i}$ 属于分类器 $k_{2}$。我们之所以分开描述它们,是因为 BS 模块和高温精炼模块可以单独应用于主干网络,这非常灵活。实验结果表明,这两个模块都能提高准确率。当然,在使用整个 HERBS 网络时,模型的能力会带来更优的性能。
TABLE I COMPARISON OF TOP-1 ACCURACY $(%)$ WITH STATE-OF-THE-ART METHODS ON THE TWO BENCHMARKS, CUB-200-2011 AND NA-BIRDS.
表 1: 在CUB-200-2011和NA-Birds两个基准上与最先进方法的Top-1准确率$(%)$对比
| Method | CUB-200-2011 | NA-Birds |
|---|---|---|
| FFVT[35] ViT-NeT[17] TransFG[9] IELT[38] SIM-Trans[29] SAC[7] HERBS | 91.6 91.7 91.7 91.8 91.8 91.8 93.1 | N/A N/A 90.8 90.8 N/A 92.7 93.0 |
| CAP[1] SR-GNN[2] | 91.9 | N/A 91.0 |
| DCAL[51] MetaFormer[4] | 91.9 92.0 92.4 | 91.2 N/A |
TABLE II COMPARISON OF TOP-1 ACCURACY $(%)$ ON CUB-200-2011 WITH DIFFERENT MODULE ADDED TO SWIN TRANSFORMER.
表 2: 在 CUB-200-2011 数据集上向 Swin Transformer 添加不同模块后的 Top-1 准确率对比 $(%)$
| 模块 | 细化 | BS | Swin-Base | Swin-Large |
|---|---|---|---|---|
| PA | 91.3 | 92.0 | ||
| √ | 91.9(+0.6) 91.5(+0.2) | 92.5(+0.5) 92.3(+0.3) | ||
| √ | 人 人 | 91.8(+0.5) 92.3(+1.0) | 92.4(+0.4) 93.1(+1.1) |
In this paper, we propose the HERBS module, composed of the first Background Suppression (BS) and the hightemperature refinement module. Both components can improve the backbone model’s accuracy in FGVC tasks. We show the most basic BS and high-temperature refinement modules in Fig.3(a) and (b), respectively. The most basic BS module is added to the output of the final block and to achieve Eqs.(1)–(9). And the most basic High-temperature refinement module is applied to the last two blocks. The final classifier would be treated as classifier $n_{2}$ and another one as classifier $n_{1}$ . Following Eq12, we calculate their KL-divergence as the objective function.
本文提出由背景抑制模块(BS)和高温优化模块组成的HERBS模块,二者均可提升主干模型在细粒度视觉分类(FGVC)任务中的准确率。图3(a)和(b)分别展示了最基础的BS模块与高温优化模块:基础BS模块添加在最终模块输出端以实现公式(1)-(9),基础高温优化模块则作用于最后两个模块。最终分类器视作分类器$n_{2}$,另一分类器作为$n_{1}$,根据公式12计算二者的KL散度作为目标函数。
IV. EXPERIMENTS
IV. 实验
A. Dataset and implement detail
A. 数据集与实现细节
The datasets used in this study are the CUB200- 2011[33] and NA-Birds[31], two fine-grained bird classification datasets. The CUB200-2011 dataset has a total of 200 bird categories, including 5,994 training images and 5,794 testing data. Each category contains about 30 training and testing data. NA-Birds is larger than CUB200-2011, has 555 bird species, 23,929 training images and 24,633 test images. Both datasets provide image-level annotations and keypoint locations, but only image-level annotations will be used in this paper. When using ResNet-50[10] as the backbone network, the input image is a $448\times448$ color image, and when using Swin-Transformer[22], the input image is a $384\times384$ color image. The methods of data augmentation is as follows. If the input image size is $384\times384$ , the first step is to scale the image to $510\times510$ , and if the input image size is $448\times448$ , it is scaled to $600\times600$ . In training phrase, data augmentation is performed via Randon Crop, Random Horizontal Flip, Random Gaussian Blur, and Normal iz arion while in testing phrase, Center Crop and Normal iz arion is used. During training, the learning rate is set to 0.0005, with cosine decay and weight decay set to 0.0005. The optimizer used is SGD, with a batch size of 8, gradient accumulation steps set to 4, and the model is trained for a total of 80 epochs. All experiments are completed on a single Nvidia GeForce RTX 3090, and the Pytorch toolbox is used as the main implementation substrate. It takes about 5 hours to complete the training on CUB200- 2011, and about 16 hours for NA-Birds.
本研究使用的数据集为CUB200-2011[33]和NA-Birds[31]两个细粒度鸟类分类数据集。CUB200-2011数据集共有200种鸟类类别,包含5,994张训练图像和5,794张测试数据,每个类别约含30个训练和测试数据。NA-Birds规模大于CUB200-2011,包含555种鸟类、23,929张训练图像和24,633张测试图像。两个数据集均提供图像级标注和关键点位置信息,但本文仅使用图像级标注。当使用ResNet-50[10]作为骨干网络时,输入图像为$448×448$彩色图像;使用Swin-Transformer[22]时,输入图像为$384×384$彩色图像。数据增强方法如下:若输入图像尺寸为$384×384$,首先将图像缩放至$510×510$;若为$448×448$则缩放至$600×600$。训练阶段采用随机裁剪、随机水平翻转、随机高斯模糊和归一化进行数据增强,测试阶段则使用中心裁剪和归一化。训练过程中学习率设为0.0005,采用余弦衰减,权重衰减设为0.0005。优化器使用SGD,批量大小为8,梯度累积步数设为4,模型共训练80个周期。所有实验均在单块Nvidia GeForce RTX 3090上完成,主要基于Pytorch工具箱实现。CUB200-2011的训练耗时约5小时,NA-Birds约16小时。
TABLE III COMPARISON OF TOP-1 ACCURACY $(%)$ ON CUB-200-2011 WITH DIFFERENT MODULE ADDED TO RESNET-50.
表 III: 在 CUB-200-2011 数据集上向 ResNet-50 添加不同模块后的 Top-1 准确率 $(%)$ 对比
| PA | Refinement | BS | ResNet-50 |
|---|---|---|---|
| 88.2 | |||
| √ | 人 | 88.6(+0.4) 88.7(+0.5) 88.4(+0.2) | |
| 人 | √ | 人 | 89.8(+1.6) |
B. Ablation experiments
B. 消融实验
In Table I, we compare our proposed HERBS with state-ofthe-art methods on CUB200-2011 and NA-Birds dataset. The middle column of Table I shows that the proposed HERBS can reach $93.1%$ in Top-1 accuracy, which is $0.7%$ higher than the previous best method. Table I last column shows that the proposed HERBS can reach $93.0%$ in Top-1 accuracy on NABirds dataset, beating the previous state-of-the-art approaches. These results demonstrate that the proposed HERBS can effectively filter out background noise and extract appropriately sized disc rim i native features, enabling the identification of fine-grained categories accurately.
在表1中,我们将提出的HERBS方法与CUB200-2011和NA-Birds数据集上的先进方法进行对比。表1中间列显示,所提出的HERBS在Top-1准确率上达到93.1%,比之前的最佳方法高出0.7%。表1最后一列表明,HERBS在NABirds数据集上的Top-1准确率达到93.0%,超越了现有最优方法。这些结果证明,HERBS能有效过滤背景噪声并提取尺寸恰当的判别性原生特征,从而精准识别细粒度类别。
To better understand the impact of each module proposed in HERBS, we separately added the PA, Refinement, and BS modules to the classification backbone. First, the Swin Transformer Base (Swin-Base) and Swin Transformer Large (Swin-Large) were used as the testing backbone. As shown in TableII, the original accuracies of Swin-Base and Swin-Large were $91.3%$ and $92.0%$ , respectively. After adding the PA, Refinement, or BS modules, there was a slight improvement in accuracy. The structure of only adding PA is shown in Fig.4(b), only adding Refinement is demonstrated in Fig.4(b), and only adding BS is shown in Fig.4(a). The last row in Table 2 shows that the HERBS module improves the backbone’s accuracy by about $1%$ , demonstrating the module’s effectiveness.
为了更好地理解 HERBS 中提出的每个模块的影响,我们分别将 PA (Position Attention)、Refinement 和 BS (Boundary Supervision) 模块添加到分类主干网络中。首先,使用 Swin Transformer Base (Swin-Base) 和 Swin Transformer Large (Swin-Large) 作为测试主干。如表 2 所示,Swin-Base 和 Swin-Large 的原始准确率分别为 $91.3%$ 和 $92.0%$。在添加 PA、Refinement 或 BS 模块后,准确率略有提升。仅添加 PA 的结构如图 4(b) 所示,仅添加 Refinement 的结构如图 4(b) 所示,仅添加 BS 的结构如图 4(a) 所示。表 2 的最后一行显示,HERBS 模块将主干网络的准确率提高了约 $1%$,证明了该模块的有效性。
The HERBS module can be utilized not only with transformer structures but also with convolution-based methods. We chose ResNet-50 as the test backbone, and the results of adding different modules are presented in Table III. Inte rest ingly, the HERBS module improves the accuracy of ResNet-50 $(+1.6)$ more than the Swin Transformer $(+1.1)$ . This discrepancy may be attributed to the difference in input image resolutions, with ResNet-50 adapting to $448\times448$ while the Swin Transformer only adapts to $384\times384$ . The resolution issue will be a topic for future discussion as it still needs to be addressed in this work. Generally speaking, the HERBS module demonstrates promising results on different types of backbones.
HERBS模块不仅可用于Transformer结构,还能与基于卷积的方法结合。我们选择ResNet-50作为测试主干网络,表III展示了添加不同模块的结果。有趣的是,HERBS模块对ResNet-50的精度提升 $(+1.6)$ 高于Swin Transformer $(+1.1)$ 。这种差异可能源于输入图像分辨率的不同——ResNet-50适配 $448\times448$ 分辨率,而Swin Transformer仅适配 $384\times384$ 。分辨率问题将作为未来讨论议题,因为本研究尚未解决该问题。总体而言,HERBS模块在各类主干网络上均展现出优异效果。
TABLE IV SHOW THE NUMBER (NUM.) OF GENERIC CLASSES, THE PRECISION (PR.) $(%)$ AND THE NUMBER OF FALSE POSITIVES (FP) WITHIN THE FINE-CLASSES IN CUB-200-2011. THE SYMBOL $\uparrow$ DENOTES THAT A HIGHER VALUE IS BETTER, WHILE $\downarrow$ DENOTES THE OPPOSITE. WE PICK GENERIC CLASSES THAT CONTAIN MORE THAN SIX CATEGORIES.
表 4 展示了 CUB-200-2011 数据集中通用类别 (Generic Class) 的数量 (Num.) 、精确率 (Pr.) $(%)$ 以及细分类别中的误报数 (FP)。符号 $\uparrow$ 表示数值越高越好,而 $\downarrow$ 表示相反。我们选取了包含超过六个类别的通用类别。
| 通用类别 | 数量 | 基线 Pr.(↑) | 基线 FP(↓) | +HERBS Pr.(↑) | +HERBS FP(↓) |
|---|---|---|---|---|---|
| Flycatcher | 210 | 83.09 | 17 | 85.02 | 15 |
| Gull | 240 | 80.79 | 1 | 81.66 | 1 |
| Kingfisher | 150 | 93.33 | 1 | 94.67 | 0 |
| Sparrow | 629 | 91.05 | 4 | 92.36 | 2 |
| Tern | 209 | 75.12 | 0 | 83.73 | 0 |
| Vireo | 210 | 92.46 | 10 | 94.47 | 8 |
| Warbler | 750 | 94.73 | 13 | 95.54 | 14 |
| Woodpecker | 179 | 97.63 | 0 | 97.63 | 0 |
| Wren | 209 | 92.85 | 5 | 91.91 | 5 |
| 平均 | 310 | 89.01 | 5.67 | 90.78 | 5.00 |
About the capabilities of different model structures. We further investigate on the “growth” and “decline” of receptive fields and present the five stages of our experiments. First, we tested the original backbone, as shown in Fig.4(a), and the corresponding heat map is presented in Fig.5(b). It was observed that the model paid attention to a large amount of background area, indicating that the original backbone is not designed for detecting details in fine-grained data.
关于不同模型结构的能力。我们进一步研究了感受野的"增长"与"衰退",并展示了实验的五个阶段。首先测试了原始主干网络(如图4(a)所示),对应的热力图如图5(b)所示。观察到模型关注了大量背景区域,表明原始主干网络并非为细粒度数据中的细节检测而设计。
Second, we added the features fusion module PA to the backbone, and the corresponding heat map is presented in Fig.5(c), with the structure depicted in Fig.4(b). From the heat maps, we deduced that using only the last result, the response of the label could be focused on a small region. This improvement compared to the original model, however, still has a narrow focus. Next, we added class if i ers to every block of the previous structure, as shown in Fig.4(c). This structure widened the attention area, as shown in Fig.5(d), and effectively utilized multi-scale features.
其次,我们在主干网络中加入了特征融合模块PA,对应的热力图如图5(c)所示,其结构如图4(b)所示。通过热力图分析发现,仅使用最终结果时,标签响应会集中在狭小区域。虽然相比原模型有所改进,但关注范围仍然较窄。随后,我们在前一结构的每个模块中都添加了分类器,如图4(c)所示。该结构有效扩大了注意力区域(如图5(d)所示),并充分利用了多尺度特征。
In the fourth step, we added four more class if i ers to the model, as depicted in Fig.4(d). These eight class if i ers constrain the attention area, but the accuracy decreased. Finally, we added the HERBS module onto the backbone, and the corresponding heat map is presented in Fig.5(f). This module maintained detail while capturing a wide range of information, with the attention area approximately between Fig.5(d) and Fig.5(e). The results demonstrate that HERBS achieved better accuracy.
在第四步中,我们向模型添加了四个分类器,如图4(d)所示。这八个分类器约束了注意力区域,但准确率有所下降。最后,我们在主干网络上添加了HERBS模块,对应的热力图如图5(f)所示。该模块在捕获广泛信息的同时保持了细节,其注意力区域大致介于图5(d)和图5(e)之间。结果表明,HERBS实现了更高的准确率。
In this example, only HERBS predicted the image correctly, while the other models predicted the image to the wrong but visually similar class. This demonstrates that fine-grained visual classification requires detailed features rather than features that are too narrow.
在此示例中,只有HERBS正确预测了图像类别,而其他模型则将图像错误分类为视觉相似类别。这表明细粒度视觉分类需要依赖细节特征而非过于局限的特征。
How the performance of HERBS on fine-classes? We evaluated the performance of HERBS on real fine classes in the CUB-200-2011 dataset, which contains about 70 generic classes with 1 to 25 subcategories each, including 9 generic classes with more than 6 categories. Table IV lists these 9 generic classes, and we evaluate the models’ performance on them.
HERBS在细粒度类别上的表现如何?我们在CUB-200-2011数据集的真实细粒度类别上评估了HERBS的性能,该数据集包含约70个通用类别,每个类别有1到25个子类别,其中包括9个拥有超过6个子类别的通用类别。表IV列出了这9个通用类别,并评估了模型在它们上的表现。
The results show that HERBS outperforms the Swin Transformer baseline regarding both precision and false positive (FP) numbers. FP refers to cases where the model predicts a class that does not belong to the correct generic class. A lower FP number means that wrong predictions occur within the similar category, indicating that the model is not making serious mistakes. For example, doctors can trust the results from the fine-grained model and only need to check similar situations, reducing the effort required for double-checking.
结果表明,HERBS 在精确度和误报数 (FP) 方面均优于 Swin Transformer 基线。FP 指模型预测类别不属于正确通用类别的情况。较低的 FP 值意味着错误预测发生在相似类别内,表明模型未犯严重错误。例如,医生可以信任细粒度模型的结果,只需检查类似情况,从而减少复查所需的工作量。

Fig. 4. The structure of models, (a) original backbone, the blue box represent the backbone blokcs. (b) backbone $^+$ path aggregation module. (c) backbone $+~\mathrm{PA}$ module with four class if i ers on the last bottom-up path. (d) backbone $^+$ PA module with eight class if i ers on the top-down and bottom-up path. (e) backbone $^+$ HERBS
图 4: 模型结构。(a) 原始主干网络,蓝色框表示主干模块。(b) 主干网络 $^+$ 路径聚合模块。(c) 主干网络 $+~\mathrm{PA}$ 模块,在最后自底向上路径上包含四个分类器。(d) 主干网络 $^+$ PA模块,在自顶向下和自底向上路径上包含八个分类器。(e) 主干网络 $^+$ HERBS

Fig. 5. Visualization of heat maps generated from different model. (a) original color image, (b) Swin Transformer backbone, (c) backbone $+\mathrm{PA}$ , (d) backbone $+~\mathrm{PA}$ with four classifier, (e) backbone $^+$ PA with eight class if i ers. (f) backbone $^+$ HERBS. The number on the top of the images represents the accuracy of the corresponding model.
图 5: 不同模型生成的热力图可视化。(a) 原始彩色图像,(b) Swin Transformer 主干网络,(c) 主干网络 $+\mathrm{PA}$,(d) 主干网络 $+~\mathrm{PA}$ 搭配四个分类器,(e) 主干网络 $^+$ PA 搭配八个分类器,(f) 主干网络 $^+$ HERBS。图像顶部数字表示对应模型的准确率。
How does the BS module suppress the background? We tested the suppression intensity $\lambda_{d}$ from 0 to 9 and plotted their corresponding top-1 accuracy in Fig.6(a) (blue line). The corresponding heat maps for different $\lambda_{d}$ values are shown in Fig.7. From the heat maps, we observed that when $\lambda_{d}$ is set to 0, which means only the merged loss (selected areas) is used to constrain the feature map, the model still pays attention to some background areas. Comparing the heat maps of $\lambda_{d}$ at 0, 5, and 9, we observed that the concentration level increases as the suppression intensity $\lambda_{d}$ increases, demonstrating that the BS module can effectively suppress background values.
BS模块如何抑制背景?我们测试了抑制强度$\lambda_{d}$从0到9的情况,并在图6(a)中绘制了对应的top-1准确率(蓝线)。不同$\lambda_{d}$值对应的热力图如图7所示。从热力图中可以观察到:当$\lambda_{d}$设为0时(即仅使用合并损失(选定区域)约束特征图),模型仍会关注部分背景区域。通过对比$\lambda_{d}$为0、5和9时的热力图,我们发现随着抑制强度$\lambda_{d}$增大,关注集中度逐渐提升,证明BS模块能有效抑制背景值。
As mentioned before, the tanh function is used to map the classification results instead of the softmax function. In Fig.6(a), the blue line represents the tanh-based approach, while the green line represents the softmax-based approach. In the softmax-based method, the pseudo-target would be C1 . However, this may lead to unstable training because even though we refer to the noisy or unselected area as "background", it is not necessarily the same as background elements such as the sky, trees, or ocean. Some unselected areas may still appear on the bird’s body and could be present in other categories’ appearances. Therefore, it is crucial to separate them by feature values rather than class probability. The impact of suppression intensity is shown in Fig. 7.
如前所述,使用tanh函数而非softmax函数来映射分类结果。在图6(a)中,蓝线代表基于tanh的方法,绿线代表基于softmax的方法。在基于softmax的方法中,伪目标会是C1。然而,这可能导致训练不稳定,因为尽管我们将噪声或未选区域称为"背景",但它未必等同于天空、树木或海洋等背景元素。某些未选区域仍可能出现在鸟类身体上,并可能存在于其他类别的外观中。因此,通过特征值而非类别概率来区分它们至关重要。抑制强度的影响如图7所示。
What does high-temperature provide? We emphasize that the use of high-temperature is based on our experiment results, as shown in Fig.6(b), where we discovered that the best top-1 accuracy and top-3 accuracy occurred at a temperature of 64. A high temperature would cause the distribution to become very flat, which means that the model has higher tolerance for mis classification. This tolerance allows the model to discover more diverse features and use multi-class features to enhance its capability.
高温提供了什么?我们强调使用高温是基于实验结果,如图6(b)所示,我们发现最佳top-1准确率和top-3准确率出现在温度为64时。高温会使分布变得非常平坦,这意味着模型对错误分类具有更高的容忍度。这种容忍度使模型能够发现更多样化的特征,并利用多类特征来增强其能力。

Fig. 6. Comparison of top-1 accuracy with different hyper parameters. (a) shows the top-1 accuracy for different $\lambda_{d}$ values ranging from 0 to 9. The blue line represents the use of the tanh function, and the green line represents the use of the softmax function to map the classification results. (b) shows the top-1 accuracy for different temperatures ranging from 0.5 to 256.
图 6: 不同超参数下的 top-1 准确率对比。(a) 展示了 $\lambda_{d}$ 取值在 0 到 9 区间时的 top-1 准确率。蓝色曲线表示使用 tanh 函数,绿色曲线表示使用 softmax 函数映射分类结果。(b) 展示了温度参数在 0.5 到 256 区间变化时的 top-1 准确率。

Fig. 7. Visualization of the heat maps for different $\lambda_{d}$ values.
图 7: 不同 $\lambda_{d}$ 值的热力图可视化。
To explain this further, we present the impactness of falsetrue rates in Fig.8. Here, false-true represents the number of wrong predictions in the top-bottom path but correct in the bottom-up path. The false-true rate is calculated using the following equation:
为了进一步说明这一点,我们在图8中展示了误判率的影响。这里的误判指的是在自上而下路径中预测错误但在自下而上路径中预测正确的数量。误判率通过以下公式计算:
$$
{\mathrm{false-true~rate}}={\frac{\mathrm{false-true}}{({\mathrm{false-true}}+{\mathrm{false-false}})}}
$$
$$
{\mathrm{false-true~rate}}={\frac{\mathrm{false-true}}{({\mathrm{false-true}}+{\mathrm{false-false}})}}
$$
The higher false-rate means the model is not only focus on one target. We discovered that the top-1 and top-3 accuracy of the dataset, as well as the F1 score of the fine-classes, are slightly related to this. The structure used in the 8cls dot in Fig.8 is Fig.4(d), while the others are HERBS with different temperatures.
较高的误报率意味着模型不仅关注单一目标。我们发现数据集的 top-1 和 top-3 准确率,以及细分类别的 F1 分数与此略有相关。图 8 中 8cls 点使用的结构是图 4(d),而其他点则是不同温度下的 HERBS。

Fig. 8. The False-True rate and its relation with (a) CUB-200-2011 top-1 accuracy, (b) top-3 accuracy, (c) the recall of fine-classes, (d) the f1 score of fine-classes.
图 8: 假阳性率与以下指标的关系:(a) CUB-200-2011 top-1准确率,(b) top-3准确率,(c) 细分类别的召回率,(d) 细分类别的f1分数。
V. CONCLUSION
V. 结论
In this paper, we proposed HERBS with the BS module and the high-temperature refinement module which can be easily applied to popular backbone networks. The method effectively filters out background noise and focuses on disc rim i native features while maintaining a proper attention area scale. Our experiments on fine-grained visual classification tasks show that HERBS significantly improves accuracy and outperforms state-of-the-art methods on the CUB-200-2011 and NA-Birds benchmark datasets. Future work can explore the use of adaptive strategies to choose the temperature or suppression intensity and investigate low computation cost methods based on this work. Overall, the proposed HERBS can achieve high accuracy up to $93%$ to provide a promising solution to improve the performance of fine-grained visual classification tasks.
本文提出了一种包含BS模块和高温精炼模块的HERBS方法,该方法可轻松应用于主流骨干网络。该方法能有效过滤背景噪声,聚焦于判别性特征,同时保持适当的注意力区域尺度。我们在细粒度视觉分类任务上的实验表明,HERBS在CUB-200-2011和NA-Birds基准数据集上显著提升了准确率,性能优于当前最优方法。未来工作可探索采用自适应策略选择温度或抑制强度,并基于本研究开发低计算成本的方法。总体而言,所提出的HERBS方法可实现高达$93%$的准确率,为提升细粒度视觉分类任务性能提供了有效解决方案。