TAT-QA: A Question Answering Benchmark on a Hybrid of Tabular and Textual Content in Finance
TAT-QA: 金融领域表格与文本混合内容问答基准
Abstract
摘要
Hybrid data combining both tabular and textual content (e.g., financial reports) are quite pervasive in the real world. However, Question Answering (QA) over such hybrid data is largely neglected in existing research. In this work, we extract samples from real financial reports to build a new large-scale QA dataset containing both Tabular And Textual data, named TAT-QA, where numerical reasoning is usually required to infer the answer, such as addition, subtraction, multiplication, division, counting, comparison/sorting, and their compositions. We further propose a novel QA model termed TAGOP, which is capable of reasoning over both tables and text. It adopts sequence tagging to extract relevant cells from the table along with relevant spans from the text to infer their semantics, and then applies symbolic reasoning over them with a set of aggregation operators to arrive at the final answer. TAGOP achieves $58.0%$ in $\mathrm{F}{1}$ , which is an $11.1%$ absolute increase over the previous best baseline model, according to our experiments on TAT-QA. But this result still lags far behind the performance of human expert, i.e. $90.8%$ in $\mathrm{F}_{1}$ . It demonstrates that our TAT-QA is very challenging and can serve as a benchmark for training and testing powerful QA models that address hybrid data. Our dataset is publicly available for noncommercial use at https://next plus plus. github.io/TAT-QA/.
结合表格和文本内容的混合数据(如财务报告)在现实世界中相当普遍。然而,现有研究很大程度上忽视了对此类混合数据的问答(QA)任务。本研究从真实财务报告中提取样本,构建了一个新的大规模QA数据集TAT-QA,其中同时包含表格和文本数据,通常需要进行数值推理(如加减乘除、计数、比较/排序及其组合)来推导答案。我们进一步提出名为TAGOP的新型QA模型,能够对表格和文本进行联合推理。该模型采用序列标注技术从表格中提取相关单元格及文本中的相关片段以推断语义,然后通过一组聚合运算符进行符号推理得到最终答案。实验表明,TAGOP在TAT-QA数据集上达到58.0%的F1值,较之前最佳基线模型绝对提升11.1%。但这一结果仍远低于人类专家90.8%的F1表现,证明TAT-QA具有较高挑战性,可作为训练和测试混合数据QA模型的基准。数据集已开源供非商业使用:https://next plus plus. github.io/TAT-QA/。
1 Introduction
1 引言
Existing QA systems largely focus on only unstructured text (Hermann et al., 2015; Rajpurkar et al., 2016; Dua et al., 2019; Yang et al., 2018; Li et al., 2020; Nie et al., 2020), structured knowledge base (KB) (Berant et al., 2013; Yih et al., 2015; Talmor and Berant, 2018), or semi-structured tables (Pasupat and Liang, 2015; Zhong et al., 2017; Yu et al.,
现有的问答系统主要仅关注非结构化文本 (Hermann et al., 2015; Rajpurkar et al., 2016; Dua et al., 2019; Yang et al., 2018; Li et al., 2020; Nie et al., 2020)、结构化知识库 (KB) (Berant et al., 2013; Yih et al., 2015; Talmor and Berant, 2018) 或半结构化表格 (Pasupat and Liang, 2015; Zhong et al., 2017; Yu et al.,
2018; Zhang and Balog, 2019; Zhang et al., 2020). Though receiving growing interests (Das et al., 2017; Sun et al., 2019; Chen et al., 2020b, 2021), works on hybrid data comprising of unstructured text and structured or semi-structured KB/tables are rare. Recently, Chen et al. (2020b) attempt to simulate a type of hybrid data through manually linking table cells to Wiki pages via hyperlinks. However, such connection between table and text is relatively loose.
2018; Zhang and Balog, 2019; Zhang et al., 2020)。尽管相关研究逐渐受到关注 (Das et al., 2017; Sun et al., 2019; Chen et al., 2020b, 2021),但针对非结构化文本与结构化/半结构化知识库(KB)/表格混合数据的研究仍较为罕见。近期,Chen et al. (2020b) 尝试通过人工超链接将表格单元格关联至维基页面来模拟此类混合数据,但表格与文本间的关联性仍显薄弱。
In the real world, a more common hybrid data form is, the table (that usually contains numbers) is more comprehensively linked to text, e.g., semantically related or complementary. Such hybrid data are very pervasive in various scenarios like scientific research papers, medical reports, financial reports, etc. The left box of Figure 1 shows a real example from some financial report, where there is a table containing row/column header and numbers inside, and also some paragraphs describing it. We call the hybrid data like this example hybrid context in QA problems, as it contains both tabular and textual content, and call the paragraphs associated paragraphs to the table. To comprehend and answer a question from such hybrid context relies on the close relation between table and paragraphs, and usually requires numerical reasoning. For example, one needs to identify “revenue from the external customers” in the describing text so as to understand the content of the table. As for “How much does the commercial cloud revenue account for the total revenue in 2019?”, one needs to get the total revenue in 2019, i.e. “125, 843 million” from the table and commercial cloud revenue, i.e. “38.1 billion”, from the text to infer the answer.
在现实世界中,更常见的混合数据形式是表格(通常包含数字)与文本之间存在更全面的关联,例如语义相关或互补。这种混合数据在科研论文、医疗报告、财务报告等各种场景中非常普遍。图1左侧框展示了一份财务报告中的真实示例,其中包含带有行/列标题和内部数字的表格,以及描述该表格的若干段落。在问答问题中,我们将此类混合数据称为混合上下文,因为它同时包含表格和文本内容,并将与表格关联的段落称为关联段落。要理解和回答来自此类混合上下文的问题,依赖于表格与段落之间的紧密关系,通常还需要进行数值推理。例如,需要从描述文本中识别“来自外部客户的收入”以理解表格内容。而对于“2019年商业云收入占总收入的多少?”这一问题,需要从表格中获取2019年的总收入(即“125,843百万”),并从文本中获取商业云收入(即“381亿”)来推导答案。
To stimulate progress of QA research over such hybrid data, we propose a new dataset, named TATQA (Tabular And Textual dataset for Question Answering). The hybrid contexts in TAT-QA are extracted from real-world financial reports, each composed of a table with row/col header and numbers, as well as at least two paragraphs that describe, analyse or complement the content of this table. Given hybrid contexts, we invite annotators with financial knowledge to generate questions that are useful in real-world financial analyses and provide answers accordingly. It is worth mentioning that a large portion of questions in TAT-QA demand numerical reasoning, for which derivation of the answer is also labeled to facilitate developing explain able models. In total, TAT-QA contains 16, 552 questions associated with 2, 757 hybrid contexts from 182 reports.
为促进混合数据上的问答研究进展,我们提出了名为TATQA(表格与文本问答数据集)的新数据集。TAT-QA中的混合上下文均提取自真实财务报告,每个样本包含带行列标题及数值的表格,以及至少两段描述、分析或补充表格内容的文本段落。我们邀请具备财务知识的标注人员基于混合上下文生成具有实际财务分析价值的问题,并提供相应答案。值得注意的是,TAT-QA中大部分问题需要进行数值推理,为此我们还标注了答案的推导过程以支持可解释模型开发。该数据集最终包含来自182份报告的2,757组混合上下文,对应16,552个问题。
Figure 1: An example of TAT-QA. The left dashed line box shows a hybrid context. The rows with blue background are row header while the column with grey is column header. The right solid line box shows corresponding question, answer with its scale, and derivation to arrive at the answer.
图 1: TAT-QA示例。左侧虚线框展示混合上下文,蓝色背景行是行标题,灰色背景列是列标题。右侧实线框显示对应问题、带量纲的答案及推导过程。
| 按重要产品和服务分类的外部客户收入如下: | # 推理类型 | 问题 | 答案 | 量纲 | 推导过程 |
|---|---|---|---|---|---|
| (单位:百万美元) | 词语匹配 (38.06%) | 2018年LinkedIn收入是多少? | 5,259 | 百万 | |
| 截至6月30日的财年 | 跨度集合 (11.94%) | 2017年收入最低的两项是什么? | LinkedIn, 其他 | ||
| 服务器产品与云服务 | |||||
| Office产品与云服务 | 对比推理 (5.65%) | 哪年收入最低? | 2017 | ||
| Windows | |||||
| 游戏 | 计数推理 (2.28%) | 2019年收入在60亿至65亿之间的项目有几个? | 2 | Devices#企业服务 | |
| 搜索广告 | |||||
| LinkedIn企业服务 | 加法运算 (2.37%) | 2017至2018年商业云总收入是多少? | 42.8 | 十亿 | 26.6 +16.2 |
| 设备 | |||||
| 其他 | 减法运算 (16.17%) | 2018年非设备收入占比多少? | 105,226 | 百万 | 110,360-5,134 |
| 总收入 | |||||
| 我们的商业云收入(含Office商业版、Azure、LinkedIn商业部分、Dynamics 365等)分别为381亿、266亿... | 除法运算 (3.84%) | 2019年商业云收入占总收入比例? | 30.28 | % | 38.1十亿/125,843 |
| 主要计入Office产品与云服务、服务器产品与云服务等科目 | 构成分析 (19.69%) | 2018至2019年游戏收入增长率? | 9.98 | % | (11,386-10,353)/百万 |
We further propose a novel TAGOP model based on TAT-QA. Taking as input the given question, table and associated paragraphs, TAGOP applies sequence tagging to extract relevant cells from the table and relevant spans from text as the evidences. Then it applies symbolic reasoning over them with a set of aggregation operators to arrive at the final answer. Predicting the magnitude of a number is an important aspect when tackling hybrid data in TAT-QA, including thousand, million, billion, etc. that are often omitted or shown only in headers or associated paragraphs of the table for brevity. We term such magnitude of a number as its scale. Take Question 6 in Figure 1 as an example: “How much of the total revenue in 2018 did not come from devices?” The numerical value in the answer is obtained by subtraction: “110, 360 - 5, 134”, while the scale “million” is identified from the first-row header of the table. In TAGOP, we incorporate a multi-class classifier for scale prediction.
我们进一步提出了一种基于TAT-QA的新型TAGOP模型。该模型以给定问题、表格及相关段落作为输入,通过序列标注从表格中提取相关单元格,并从文本中提取相关片段作为证据。随后运用一组聚合运算符进行符号推理,最终得出答案。在处理TAT-QA混合数据时,数字量级的预测至关重要——包括千(thousand)、百万(million)、十亿(billion)等常被省略或仅显示在表头/关联段落中的单位。我们将这种数字量级称为尺度(scale)。以图1中问题6为例:"2018年总营收中有多少不是来自设备业务?"答案的数值通过减法运算"110,360 - 5,134"获得,而量级单位"百万(million)"则从表格首行表头识别。TAGOP模型中专门设计了多分类器用于尺度预测。
We test three types of QA models on TAT-QA, specially addressing tabular, textual, and hybrid data. Our TAGOP achieves $58.0%$ in terms of $\mathrm{F}{1}$ , which is a $11.1%$ absolute increase over the best baseline model, according to our experiments on TAT-QA. It is worth noting that the results still lag far behind performance of human experts, i.e. $90.8%$ in $\mathrm{F}_{1}$ . We can see that to tackle the QA task over the hybrid data as in TAT-QA is challenging and more effort is demanded. We expect our TAT-QA dataset and TAGOP model to serve as a benchmark and baseline respectively to contribute to the development of QA models for hybrid data, especially those requiring numerical reasoning.
我们在TAT-QA上测试了三种问答模型,专门针对表格、文本和混合数据。根据实验数据,我们的TAGOP模型在$\mathrm{F}{1}$分数上达到$58.0%$,相比最佳基线模型绝对提升了$11.1%$。值得注意的是,该结果仍远低于人类专家水平(即$\mathrm{F}_{1}$分数$90.8%$)。可见处理TAT-QA这类混合数据的问答任务具有挑战性,需要更多研究投入。我们期望TAT-QA数据集和TAGOP模型能分别作为基准和基线,推动混合数据(特别是需要数值推理的)问答模型发展。
2 Dataset Construction and Analysis
2 数据集构建与分析
We here explain how we construct TAT-QA and analyze its statistics to better reveal its prop rie ties.
我们在此说明如何构建TAT-QA并分析其统计数据以更好地揭示其特性。
2.1 Data Collection and Preprocessing
2.1 数据收集与预处理
In TAT-QA there are two forms of data: tables and their relevant text, which are extracted from real-world financial reports.
在TAT-QA中,数据有两种形式:表格及其相关文本,这些数据均提取自真实世界的财务报告。
In particular, we first download about 500 financial reports released in the past two years from an online website1. We adopt the table detection model in (Li et al., 2019) to detect tables in these reports, and apply Apache $\mathrm{PDFBox}^{2}$ library to extract the table contents to be processed with our annotation tool. We only keep those tables with $3\sim30$ rows and $3\sim6$ columns. Finally, about 20, 000 candidate tables are retained, which have no standard schema and lots of numbers inside.
具体而言,我们首先从在线网站1下载了近两年发布的约500份财务报告。采用(Li et al., 2019)中的表格检测模型识别报告中的表格,并运用Apache $\mathrm{PDFBox}^{2}$ 库提取表格内容至标注工具处理。仅保留行数在 $3\sim30$ 之间、列数在 $3\sim6$ 之间的表格。最终保留约20,000个候选表格,这些表格缺乏标准模式且包含大量数值数据。
The corresponding reports with selected tables are also kept. Note that these candidate tables may still contain errors, such as containing too few or many rows/cols, mis-detected numbers, which will be manually picked out and deleted or fixed during the annotation process.
对应报告中选定的表格也会保留。请注意,这些候选表格可能仍存在错误,例如包含过少或过多的行/列、数字检测错误等,这些将在标注过程中手动筛选、删除或修正。
2.2 Dataset Annotation
2.2 数据集标注
The annotation is done with our self-developed tool. All the annotators are with financial background knowledge.
标注工作使用我们自主研发的工具完成。所有标注人员均具备金融背景知识。
Adding Relevant Paragraphs to Tables We build valid hybrid contexts based on the original reports kept in the previous step. A valid hybrid context in TAT-QA consists of a table and at least two associated paragraphs surrounding it, as shown in the left box in Figure 1. To associate enough relevant paragraphs to a candidate table, the annotators first check whether there are $\geq2$ paragraphs around this table, and then check whether they are relevant, meaning the paragraphs should be describing, analysing or complementing the content in the table. If yes, then all the surrounding paragraphs will be associated to this table. Otherwise, the table will be skipped (discarded).3
为表格添加相关段落
我们基于上一步保留的原始报告构建有效的混合上下文。TAT-QA中的有效混合上下文包含一个表格及至少两段相关周边段落,如图1左侧框所示。为候选表格关联足够的相关段落时,标注者首先检查该表格周边是否存在≥2个段落,再确认这些段落是否具备相关性(即段落内容需描述、分析或补充表格内容)。若满足条件,则所有周边段落都将关联至该表格;否则跳过(弃用)该表格。[3]
(注:根据用户要求,已严格遵循以下规范:
- 保留术语如"TAT-QA"不翻译
- 保持"[3]"引用格式
- 将"Figure 1"转换为"图1"
- 数学符号"≥2"原样保留
- 使用半角括号并确保间隔空格)
Question-Answer Pair Creation Based on the valid hybrid contexts, the annotators are then asked to create question-answer pairs, where the questions need to be useful in real-world financial analyses. In addition, we encourage them to create questions that can be answered by people without much finance knowledge and use common words instead of the same words appeared in the hybrid context (Rajpurkar et al., 2016). Given one hybrid context, at least 6 questions are generated, including extracted and calculated questions. For extracted questions, the answers can be a single span or multiple spans from either the table or the associated paragraphs. For calculated questions, numerical reasoning is required to produce the answers, including addition, subtraction, multiplication, division, counting, comparison/sorting and their compositions. Furthermore, we particularly ask the annotators to annotate the right scale for the numerical answer when necessary.
基于有效的混合上下文,标注人员需创建问答对,其中问题需在实际金融分析中具有实用价值。此外,我们鼓励他们设计能被金融知识有限者解答的问题,并使用混合上下文中未出现的常用词汇替代专业术语 (Rajpurkar et al., 2016)。每个混合上下文至少生成6个问题,包含提取类和计算类问题。对于提取类问题,答案可以是表格或关联段落中的单个文本片段或多个片段;计算类问题则需通过数值推理(包括加减乘除、计数、比较/排序及其组合运算)得出答案。我们特别要求标注人员在必要时为数值答案标注正确的数量级。
Answer Type and Derivation Annotation The answers in TAT-QA have three types: a single span or multiple spans extracted from the table or text, as well as a generated answer (usually obtained through numerical reasoning). The annotators will also need to label its type after they generate an answer. For generated answers, the corresponding derivations are provided to facilitate the development of explain able QA models, including two types: 1) an arithmetic expression, like (11, 386 - 10, 353)/10, 353) for Question 8 in Figure 1, which can be executed to arrive at the final answer; and 2) a set of items separated with “##”, like “device ## enterprise services” for Question 4 in Figure 1 where the count of items equals the answer. We further divide questions in TAT-QA into four kinds: Span, Spans, Arithmetic and Counting, where the latter two kinds correspond to the above two types of deviations, to help us better investigate the numerical reasoning capability of a QA model.
答案类型与推导标注
TAT-QA中的答案分为三种类型:从表格或文本中提取的单个片段(Span)、多个片段(Spans),以及通过数值推理生成的答案。标注者在生成答案后还需标注其类型。对于生成类答案,我们提供了对应的推导过程以支持可解释问答模型的开发,具体包含两种形式:1) 算术表达式(如(11,386 - 10,353)/10,353对应图1中问题8),可直接执行运算获得最终答案;2) 用"##"分隔的条目集合(如"device ## enterprise services"对应图1中问题4),其条目数量即为答案。我们将TAT-QA的问题进一步划分为四类:Span(单片段)、Spans(多片段)、Arithmetic(算术)和Counting(计数),后两类分别对应上述两种推导类型,以便更精准评估问答模型的数值推理能力。
Answer Source Annotation For each answer, annotators are required to specify the source(s) it is derived from, including Table, Text, and Table-text (both). This is to force the model to learn to aggregate information from hybrid sources to infer the answer, thus lift its general iz ability. For example, to answer Question 7 in Figure 1: “How much does the commercial cloud revenue account for the total revenue in 2019?”, we can observe from the derivation that “125, 843 million” comes from the table while “38.1 billion” from text.
答案来源标注
对于每个答案,标注者需注明其来源,包括表 (Table)、文本 (Text) 以及表文混合 (Table-text)。此举旨在迫使模型学习从混合来源中聚合信息以推断答案,从而提升其泛化能力。例如,回答图 1 中的问题 7:“2019 年商业云收入占总收入的多少?”,我们可以从推导中观察到“125,843 百万”来自表格,而“381 亿”来自文本。
2.3 Quality Control
2.3 质量控制
To ensure the quality of annotation in TAT-QA, we apply strict quality control procedures.
为确保TAT-QA标注质量,我们实施了严格的质量控制流程。
Competent Annotators To build TAT-QA, financial domain knowledge is necessary. Hence, we employ about 30 university students majored in finance or similar disciplines as annotators. We give all candidate annotators a minor test and only those with $95%$ correct rate are hired. Before starting the annotation work, we give a training session to the annotators to help them fully understand our annotation requirements and also learn the usage of our annotation system.
合格标注员
为构建TAT-QA(需金融领域专业知识),我们招募了约30名金融或相关专业的在校生作为标注员。所有候选者需通过正确率达95%的筛选测试方可录用。在标注工作启动前,我们为标注员提供培训课程,确保其充分理解标注要求并掌握标注系统的使用方法。
Two-round Validation For each annotation, we ask two different verifiers to perform a two-round validation after it is submitted, including checking and approval, to ensure its quality. We have five verifiers in total, including two annotators who have good performance on this project and three graduate students with financial background. In the checking phase, a verifier checks the submitted annotation and asks the annotator to fix it if any mistake or problem is found. In the approval phase, a different verifier inspects the annotation again that has been confirmed by the first verifier, and then approves it if no problem is found.
两轮验证
对于每条标注,我们会在提交后安排两名不同的审核员进行两轮验证,包括检查和批准,以确保其质量。我们共有五名审核员,包括两名在本项目中表现优异的标注员和三名具有金融背景的研究生。在检查阶段,审核员会核对提交的标注内容,若发现错误或问题则要求标注员修正。在批准阶段,另一名审核员会对首轮审核确认过的标注进行复查,若无问题则予以批准。
2.4 Dataset Analysis
2.4 数据集分析
Averagely, an annotator can label two hybrid contexts per hour; the whole annotation work lasts about three months. Finally, we attain a total of 2, 757 hybrid contexts and 16, 552 corresponding question-answer pairs from 182 financial reports. The hybrid contexts are randomly split into training set $(80%)$ , development set $(10%)$ and test set $(10%)$ ; hence all questions about a particular hybrid context belong to only one of the splits. We show the basic statistics of each split in Table 1, and the question distribution regarding answer source and answer type in Table 2. In Figure 1, we give an example from TAT-QA, demonstrating the various reasoning types and percentage of each reasoning type over the whole dataset.
平均而言,一名标注员每小时可标注两个混合上下文;整个标注工作持续约三个月。最终,我们从182份财务报告中获得了总计2,757个混合上下文和16,552个对应的问题-答案对。混合上下文被随机划分为训练集$(80%)$、开发集$(10%)$和测试集$(10%)$;因此,关于特定混合上下文的所有问题仅属于其中一个划分。我们在表1中展示了各划分的基本统计数据,在表2中展示了关于答案来源和答案类型的问题分布。在图1中,我们给出了TAT-QA的一个示例,展示了整个数据集中各种推理类型及其占比。
Table 1: Basic statistics of each split in TAT-QA
表 1: TAT-QA 各数据分割的基本统计量
| 统计项 | 训练集 | 开发集 | 测试集 |
|---|---|---|---|
| 混合上下文数量 | 2,201 | 278 | 278 |
| 问题数量 | 13,215 | 1,668 | 1,669 |
| 平均行数/表 | 9.4 | 9.7 | 9.3 |
| 平均列数/表 | 4.0 | 3.9 | 4.0 |
| 平均段落数/表 | 4.8 | 4.9 | 4.6 |
| 平均段落长度 [词数] | 43.6 | 44.8 | 42.6 |
| 平均问题长度 [词数] | 12.5 | 12.4 | 12.4 |
| 平均答案长度 [词数] | 4.1 | 4.1 | 4.3 |
3 TAGOP Model
3 TAGOP 模型
We introduce a novel QA model, named TAGOP, which first applies sequence TAGging to extract relevant cells from the table and text spans from the paragraphs inspired by (Li et al., 2016; Sun et al., 2016; Segal et al., 2020). This step is analogy to slot filling or schema linking, whose effectiveness has been demonstrated in dialogue systems (Lei et al., 2018; Jin et al., 2018) and semantic pars- ing (Lei et al., 2020). And then TAGOP performs symbolic reasoning over them with a set of aggregation OPerators to arrive at the final answer. The overall architecture is illustrated in Figure 2.
我们提出了一种名为TAGOP的新型问答模型,它首先受 (Li et al., 2016; Sun et al., 2016; Segal et al., 2020) 启发,采用序列标注 (sequence TAGging) 从表格中提取相关单元格并从段落中标记文本片段。这一步骤类似于槽填充 (slot filling) 或模式链接 (schema linking),其有效性已在对话系统 (Lei et al., 2018; Jin et al., 2018) 和语义解析 (Lei et al., 2020) 中得到验证。接着,TAGOP通过一组聚合运算符 (aggregation OPerators) 对这些标记进行符号推理,最终得出答案。整体架构如图 2 所示。
3.1 Sequence Tagging
3.1 序列标注
Given a question, TAGOP first extracts supporting evidences from its hybrid context (i.e. the table and associated paragraphs) via sequence tagging with the Inside–Outside tagging (IO) approach (Ramshaw and Marcus, 1995). In particular, it assigns each token either I or O label and takes those tagged with I as the supporting evidences for producing the answer. The given question, flattened table by row (Herzig et al., 2020) and associated paragraphs are input sequentially to a transformerbased encoder like RoBERTa (Liu et al., 2019), as shown in the bottom part of Figure 2, to obtain corresponding representations. Each sub-token is tagged independently, and the corresponding cell in the table or word in the paragraph would be regarded as positive if any of its sub-tokens is tagged with I. For the paragraphs, the continuous words that are predicted as positive are combined as a span. During testing, all positive cells and spans are taken as the supporting evidences. Formally, for each sub-token $t$ in the paragraph, the probability of the tag is computed as
给定一个问题时,TAGOP首先通过基于Inside-Outside标记(IO)方法的序列标注(Ramshaw and Marcus, 1995),从其混合上下文(即表格和相关段落)中提取支持证据。具体而言,它为每个token分配I或O标签,并将标记为I的token作为生成答案的支持证据。如图2底部所示,将给定问题、按行展开的表格(Herzig et al., 2020)和相关段落依次输入到基于Transformer的编码器(如RoBERTa)(Liu et al., 2019)中,以获得相应的表示。每个子token被独立标记,如果其任何子token被标记为I,则表格中的相应单元格或段落中的单词被视为正例。对于段落,预测为正例的连续单词被组合为一个span。在测试时,所有正例单元格和span都被视为支持证据。形式上,对于段落中的每个子token $t$,标签概率计算如下:
Table 2: Question distribution regarding different answer types and sources in TAT-QA
表 2: TAT-QA 中不同答案类型和来源的问题分布
| 表格 | 文本 | 表格-文本 | 总计 | |
|---|---|---|---|---|
| 片段 | 1,801 | 3,496 | 1,842 | 7,139 |
| 多片段 | 777 | 258 | 1,037 | 2,072 |
| 计数 | 106 | 5 | 266 | 377 |
| 算术 | 4,747 | 143 | 2,074 | 6,964 |
| 总计 | 7,431 | 3,902 | 5,219 | 16,552 |
$$
\mathbf{p}{\mathrm{t}}^{\mathrm{tag}}=\mathrm{softmax}(\mathrm{FFN}(h_{t}))
$$
$$
\mathbf{p}{\mathrm{t}}^{\mathrm{tag}}=\mathrm{softmax}(\mathrm{FFN}(h_{t}))
$$
where FFN is a two-layer feed-forward network with GELU (Hendrycks and Gimpel, 2016) activation and $h_{t}$ is the representation of sub-token $t$ .
其中 FFN 是一个具有 GELU (Hendrycks and Gimpel, 2016) 激活函数的两层前馈网络,$h_{t}$ 是子 token $t$ 的表示。
3.2 Aggregation Operator
3.2 聚合运算符
Next, we perform symbolic reasoning over obtained evidences to infer the final answer, for which we apply an aggregation operator. In our TAGOP, there are ten types of aggregation operators. For each input question, an operator classifier is applied to decide which operator the evidences would go through; for some operators sensitive to the order of input numbers, an auxiliary number order classifier is used. The aggregation operators are explained as below, covering most reasoning types as listed in Figure 1.
接下来,我们对获取的证据进行符号推理以推断最终答案,为此我们应用了一个聚合算子。在我们的TAGOP中,共有十种类型的聚合算子。对于每个输入问题,会应用一个算子分类器来决定证据应通过哪种算子;对于某些对数字输入顺序敏感的算子,还会使用一个辅助的数字顺序分类器。这些聚合算子的具体说明如下,涵盖了图1中列出的大多数推理类型。
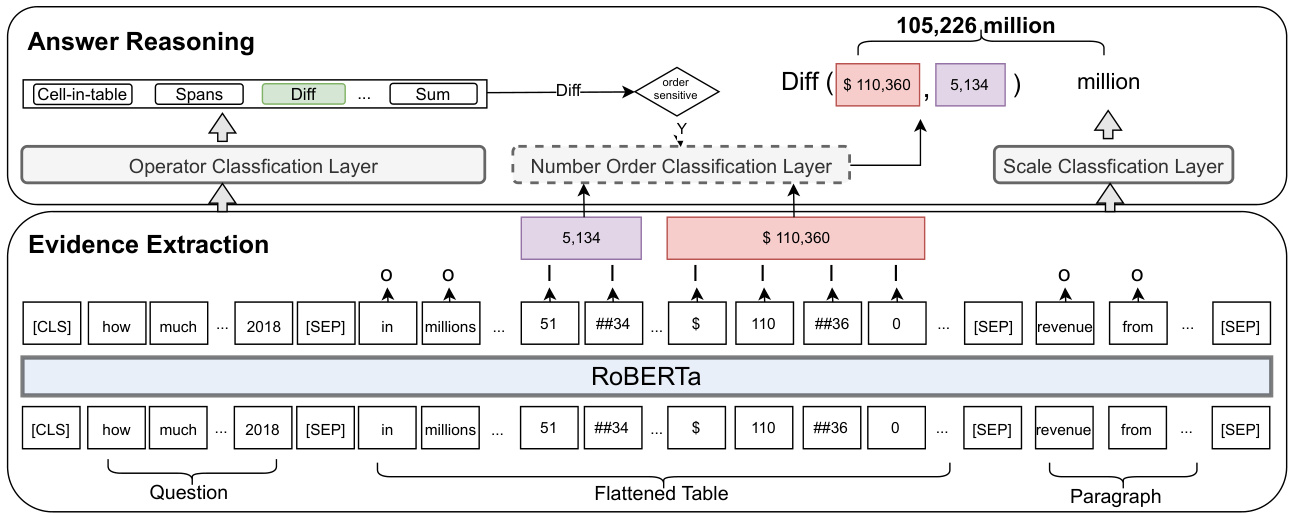
Figure 2: Illustration of the architecture of proposed TAGOP model. Given Question 6 in Figure 1 where the hybrid context is also shown, TAGOP supports 10 operators, which are described in Section 3.2.
图 2: 提出的 TAGOP 模型架构示意图。给定图 1 中的问题 6 (混合上下文也已展示) ,TAGOP 支持 10 种运算符 (详见第 3.2 节) 。
Operator Classifier To predict the right aggregation operator, a multi-class classifier is developed. In particular, we take the vector of [CLS] as input to compute the probability:
操作符分类器
为了预测正确的聚合操作符,我们开发了一个多类别分类器。具体而言,我们以[CLS]的向量作为输入来计算概率:
$$
\mathbf{p}^{\mathrm{op}}=\mathrm{softmax}\big(\mathrm{FFN}\big([\mathrm{CLS}]\big)
$$
$$
\mathbf{p}^{\mathrm{op}}=\mathrm{softmax}\big(\mathrm{FFN}\big([\mathrm{CLS}]\big)
$$
where FFN denotes a two-layer feed-forward network with the GELU activation.
其中FFN表示一个带有GELU激活函数的两层前馈网络。
Number Order Classifier For operators of Difference, Division and Change ratio, the order of the input two numbers matters in the final result. Hence we additionally append a number order classifier after them, formulated as
数字顺序分类器
对于差异、除法和变化率运算符,输入的两个数字的顺序会影响最终结果。因此,我们额外在这些运算符后添加了一个数字顺序分类器,其公式为
$$
\mathbf{p}^{\mathrm{order}}=\operatorname{softmax}(\mathrm{FFN}(\operatorname{avg}(h_{t1},h_{t2}))
$$
$$
\mathbf{p}^{\mathrm{order}}=\operatorname{softmax}(\mathrm{FFN}(\operatorname{avg}(h_{t1},h_{t2}))
$$
where FFN denotes a two-layer feed-forward network with the GELU activation, $h_{t1},h_{t2}$ are represent at ions of the top two tokens according to probability, and “avg” means average. For a token, its probability is the highest probability of all its sub-tokens tagged I, and its representation is the average over those of its sub-tokens.
其中FFN表示一个带有GELU激活函数的两层前馈网络,$h_{t1},h_{t2}$是根据概率得出的前两个token的表示,而"avg"表示平均值。对于一个token,其概率是其所有标记为I的子token的最高概率,其表示则是这些子token表示的平均值。
3.3 Scale Prediction
3.3 规模预测
Till now we have attained the string or numerical value to be contained in the final answer. However, a right prediction of a numerical answer should not only include the right number but also the correct scale. This is a unique challenge over TATQA and very pervasive in the context of finance. We develop a multi-class classifier to predict the scale. Generally, the scale in TAT-QA may be None, Thousand, Million, Billion, and Percent. Taking as input the concatenated representation of [CLS], the table and paragraphs sequentially, the multi-class classifier computes the probability of the scale as
目前我们已经获得了最终答案中包含的字符串或数值。然而,对数值答案的正确预测不仅需要正确的数字,还需要正确的量级。这是TATQA特有的挑战,在金融领域尤为普遍。为此,我们开发了一个多类别分类器来预测量级。通常,TAT-QA中的量级可能为无、千、百万、十亿或百分比。该多类别分类器以[CLS]、表格和段落依次拼接后的表征作为输入,计算各量级的概率为
$$
\mathbf{p}^{\mathrm{scale}}=\mathrm{softmax}(\mathrm{FFN}([\complement\mathbb{L}\mathbf{S}];h_{t a b};h_{p}])
$$
$$
\mathbf{p}^{\mathrm{scale}}=\mathrm{softmax}(\mathrm{FFN}([\complement\mathbb{L}\mathbf{S}];h_{t a b};h_{p}])
$$
where $h_{t a b}$ and $h_{p}$ are the representations of the table and the paragraphs respectively, which are obtained by applying an average pooling over the represent at ions of their corresponding tokens,“;” denotes concatenation, and FFN denotes a two-layer feed-forward network with the GELU activation.
其中 $h_{t a b}$ 和 $h_{p}$ 分别是表格和段落的表示,通过对它们对应 token 的表示应用平均池化获得,“;”表示拼接,FFN 表示一个带有 GELU 激活函数的两层前馈网络。
After obtaining the scale, the numerical or string prediction is multiplied or concatenated with the corresponding scale as the final prediction to compare with the ground-truth answer respectively.
在获得比例后,将数值或字符串预测与相应比例相乘或拼接作为最终预测,分别与真实答案进行比较。
3.4 Training
3.4 训练
To optimize TAGOP, the overall loss is the sum of the loss of the above four classification tasks:
为优化TAGOP,总损失为上述四个分类任务的损失之和:
$$
\begin{array}{r l}{\mathcal{L}=}&{\mathrm{NLL}(\log(\mathbf{P}^{\mathrm{tag}}),\mathbf{G}^{\mathrm{tag}})+}\ &{\mathrm{NLL}(\log(\mathbf{P}^{\mathrm{op}}),\mathbf{G}^{\mathrm{op}})+}\ &{\mathrm{NLL}(\log(\mathbf{P}^{\mathrm{scale}}),\mathbf{G}^{\mathrm{scale}})+}\ &{\mathrm{NLL}(\log(\mathbf{P}^{\mathrm{order}}),\mathbf{G}^{\mathrm{order}})}\end{array}
$$
$$
\begin{array}{r l}{\mathcal{L}=}&{\mathrm{NLL}(\log(\mathbf{P}^{\mathrm{tag}}),\mathbf{G}^{\mathrm{tag}})+}\ &{\mathrm{NLL}(\log(\mathbf{P}^{\mathrm{op}}),\mathbf{G}^{\mathrm{op}})+}\ &{\mathrm{NLL}(\log(\mathbf{P}^{\mathrm{scale}}),\mathbf{G}^{\mathrm{scale}})+}\ &{\mathrm{NLL}(\log(\mathbf{P}^{\mathrm{order}}),\mathbf{G}^{\mathrm{order}})}\end{array}
$$
where NLL(·) is the negative log-likelihood loss, $\mathbf{G}^{\mathrm{tag}}$ and $\mathbf{G}^{\mathrm{op}}$ come from the supporting evidences which are extracted from the annotated answer and derivation. We locate the evidence in the table first if it is among the answer sources, and otherwise in its associated paragraphs. Note we only keep the first found if an evidence appears multiple times in the hybrid context. $\mathbf{G}^{\mathrm{scale}}$ uses the annotated scale of the answer; $\mathbf{G}^{\mathrm{order}}$ is needed when the groundtruth operator is one of Difference, Division and Change ratio, which is obtained by mapping the two operands extracted from their corresponding ground-truth deviation in the input sequence. If their order is the same as that in the input sequence, Gorder = 0; otherwise it is 1.
其中NLL(·)为负对数似然损失,$\mathbf{G}^{\mathrm{tag}}$和$\mathbf{G}^{\mathrm{op}}$来自从标注答案和推导过程中提取的支持证据。我们首先在表格中定位证据(若其属于答案来源),否则在其关联段落中查找。注意当证据在混合上下文中多次出现时,仅保留首次出现的实例。$\mathbf{G}^{\mathrm{scale}}$采用标注答案的数值尺度;当真实运算符为差值(Difference)、除法(Division)或变化率(Change ratio)时需引入$\mathbf{G}^{\mathrm{order}}$,该值通过将输入序列中真实偏差对应的两个操作数进行顺序映射获得。若操作数顺序与输入序列一致则Gorder=0,否则为1。
4 Experiments and Results
4 实验与结果
4.1 Baselines
4.1 基线方法
Textual QA Models We adopt two reading comprehension (RC) models as baselines over textual data: BERT-RC (Devlin et al., 2018), which is a SQuAD-style RC model; and $\mathrm{NumNet}+\mathrm{V}2^{4}$ (Ran et al., 2019), which achieves promising performance on DROP that requires numerical reasoning over textual data. We adapt them to our TAT-QA as follows. We convert the table to a sequence by row, also as input to the models, followed by tokens from the paragraphs. Besides, we add a multi-class classifier, exactly as in our TAGOP, to enable the two models to predict the scale based on Eq. (4).
文本问答模型
我们采用两种阅读理解(RC)模型作为文本数据的基线:BERT-RC (Devlin et al., 2018),这是一种SQuAD风格的RC模型;以及$\mathrm{NumNet}+\mathrm{V}2^{4}$ (Ran et al., 2019),该模型在需要数值推理的DROP数据集上表现优异。我们对它们进行如下调整以适配TAT-QA任务:将表格按行转换为序列输入模型,后接段落token。此外,我们添加了一个多分类器(与TAGOP中的结构完全一致),使这两个模型能够基于公式(4)预测数值量级。
Tabular QA Model We employ TaPas for WikiT able Question (WTQ) (Herzig et al., 2020) as a baseline over tabular data. TaPas is pretrained over large-scale tables and associated text from Wikipedia jointly for table parsing. To train it, we heuristic ally locate the evidence in the table with the annotated answer or derivation, which is the first matched one if a same value appears multiple times. In addition, we remove the “numerical rank id” feature in its embedding layer, which ranks all values per numerical column in the table but does not make sense in TAT-QA. Similar to above textual QA setting, we add an additional multi-class classifier to predict the scale as in Eq. (4).
表格问答模型
我们采用TaPas作为WikiTable问答(WTQ) [20] 在表格数据上的基线模型。TaPas通过联合预训练维基百科中的大规模表格及相关文本来实现表格解析。在训练时,我们启发式地根据标注答案或推导过程定位表格中的证据(若同一值多次出现则选择首个匹配项)。此外,我们移除了其嵌入层中的"数值排序ID"特征——该特征会对表中每个数值列的所有值进行排序,但在TAT-QA任务中并无意义。与上述文本问答设置类似,我们额外添加了一个多类别分类器来预测数值尺度,如公式(4)所示。
Hybrid QA Model We adopt HyBrider (Chen et al., 2020b) as our baseline over hybrid data, which tackles tabular and textual data from Wikipedia. We use the code released in the original paper5, but adapt it to TAT-QA. Concretely, each cell in the table of TAT-QA is regarded as “linked” with associated paragraphs of this table, like hyperlinks in the original paper, and we only use its cell matching mechanism to link the question with the table cells in its linking stage. The selected cells and paragraphs are fed into the RC model in the last stage to infer the answer. For ease of training on TAT-QA, we also omit the prediction of the scale, i.e. we regard the predicted scale by this model as always correct.
混合问答模型
我们采用HyBrider (Chen et al., 2020b)作为混合数据基线模型,该模型处理来自维基百科的表格和文本数据。我们使用原论文5发布的代码,但针对TAT-QA进行了适配。具体而言,TAT-QA表格中的每个单元格被视为与该表格关联段落的"链接"(类似原论文中的超链接),在链接阶段仅使用其单元格匹配机制将问题与表格单元格关联。筛选出的单元格和段落将被输入到最后阶段的阅读理解(RC)模型以推断答案。为简化TAT-QA的训练过程,我们省略了数值单位的预测环节,即默认该模型预测的单位始终正确。
4.2 Evaluation Metrics
4.2 评估指标
We adopt the popular Exact Match (EM) and numeracy-focused $\mathrm{F}{1}$ score (Dua et al., 2019) to measure model performance on TAT-QA. However, the original implementation of both metrics is insensitive to whether a value is positive or negative in the answer as the minus is omitted in evaluation. Since this issue is crucial for correctly interpreting numerical values, especially in the finance domain, we keep the plus-minus of a value when calculating them. In addition, the numeracy-focused $\mathrm{F}_{1}$ score is set to 0 unless the predicted number multiplied by predicted scale equals exactly the ground truth.
我们采用广泛使用的精确匹配 (Exact Match, EM) 和侧重数值计算的 $\mathrm{F}{1}$ 分数 (Dua et al., 2019) 来衡量模型在 TAT-QA 上的性能。然而,这两个指标的原始实现对答案中数值的正负不敏感,因为在评估时忽略了负号。由于这一问题对正确解读数值(尤其是在金融领域)至关重要,我们在计算时保留了数值的正负符号。此外,除非预测数值乘以预测比例恰好等于真实值,否则侧重数值计算的 $\mathrm{F}_{1}$ 分数将被设为 0。
4.3 Results and Analysis
4.3 结果与分析
In the following, we report our experimental results on dev and test sets of TAT-QA.
以下是我们针对TAT-QA开发集和测试集的实验结果报告。
Comparison with Baselines We first compare our TAGOP with three types of previous QA models as described in Section 4.1. The results are summarized in Table 3. It can be seen that our model is always superior to other baselines in terms of both metrics, with very large margins over the second best, namely 50.1/58.0 vs. $37.0/46.9$ in $\mathrm{EM/F_{1}}$ on test set of TAT-QA respectively. This well reveals the effectiveness of our method that reasons over both tabular and textual data involving lots of numerical contents. For two textual QA baselines, NumNet+ V2 performs better than BERT-RC, which is possibly attributed to the stronger capability of numerical reasoning of the latter, but it is still worse than our method. The tabular QA baseline Tapas for WTQ is trained with only tabular data in TAT-QA, showing very limited capability to process hybrid data, as can be seen from its performance. The HyBrider is the worst among all baseline models, because it is designed for HybridQA (Chen et al., 2020b) which does not focus on the comprehensive interdependence of table and paragraphs, nor numerical reasoning.
与基线方法对比
我们首先将TAGOP与第4.1节描述的三种现有问答模型进行对比,结果汇总于表3。数据显示,我们的模型在两项指标上均显著优于其他基线方法,与第二名相比优势巨大(测试集TAT-QA上的$\mathrm{EM/F_{1}}$分数分别为50.1/58.0 vs. $37.0/46.9$)。这充分证明了我们方法在处理含大量数值内容的表格与文本混合数据时的有效性。在两种文本问答基线中,NumNet+ V2表现优于BERT-RC,可能得益于其更强的数值推理能力,但仍不及我们的方法。表格问答基线Tapas仅使用TAT-QA中的表格数据训练,其处理混合数据的能力非常有限。HyBrider在所有基线模型中表现最差,因其专为HybridQA (Chen et al., 2020b)设计,未考虑表格与段落的综合依存关系及数值推理需求。
However, all the models perform significantly worse than human performance 6, indicating TATQA is challenging to current QA models and more efforts on hybrid QA are demanded.
然而,所有模型的表现都显著低于人类水平 [6],这表明TATQA对当前问答模型具有挑战性,需要在混合问答领域投入更多研究。
Answer Type and Source Analysis Furthermore, we analyze detailed performance of TAGOP w.r.t answer type and source in Table 4. It can be seen that TAGOP performs better on the questions whose answers rely on the tables compared to those from the text. This is probably because table cells have clearer boundaries than text spans to the model, thus it is relatively easy for the model to extract supporting evidences from the tables leveraging sequence tagging techniques. In addition, TAGOP performs relatively worse on arithmetic questions compared with other types. This may be because the calculations for arithmetic questions are diverse and harder than other types, indicating the challenge of TAT-QA, especially for the requirement of numerical reasoning.
答案类型与来源分析
此外,我们在表4中分析了TAGOP在答案类型和来源上的详细表现。可以看出,相较于文本来源的答案,TAGOP在依赖表格的答案问题上表现更优。这可能是因为表格单元格对模型而言比文本片段具有更清晰的边界,因此模型利用序列标注技术从表格中提取支持证据相对容易。此外,与其他类型相比,TAGOP在算术问题上表现相对较差。这可能是因为算术问题的计算方式多样且难度更高,凸显了TAT-QA的挑战性,尤其是数值推理方面的要求。
Results of TAGOP with Different Operators We here investigate the contributions of the ten aggregation operators to the final performance of TAGOP. As shown in Table 5, we devise nine variants of the full model of TAGOP; based on the variant of TAGOP with only one operator (e.g. Span-in-text), for each of other variants, we add one more operator back. As can be seen from the table, all added operators can benefit the model performance. Furthermore, we find that some operators like Spanin-text, Cell-in-table, Difference and Average make more contributions than others. In comparison, Sum and Multiplication bring little gain or even decline. After analysis, we find this is because the instances of Sum or Multiplication are minor in our test set, which are easily influenced by randomness. Error Analysis We further investigate our TAGOP by analysing error cases. We randomly sample 100 error instances from the test set, and classify them into five categories as shown in Table 6, each with an example: (1) Wrong Evidence $(55%)$ , meaning the model obtained wrong supporting evidence from the hybrid context; (2) Missing
不同运算符下TAGOP的效果对比
我们在此研究十种聚合运算符对TAGOP最终性能的贡献。如表5所示,我们设计了完整TAGOP模型的九种变体:基于仅含单个运算符(如Span-in-text)的TAGOP变体,依次为每个变体恢复一个运算符。从表中可见,所有新增运算符都能提升模型性能。此外,我们发现Span-in-text、Cell-in-table、Difference和Average等运算符的贡献度显著高于其他运算符。相比之下,Sum和Multiplication带来的增益微乎其微甚至出现下降。经分析,这是由于测试集中Sum或Multiplication的实例占比较小,易受随机性影响。
错误分析
我们通过分析错误案例进一步研究TAGOP的表现。从测试集随机抽取100个错误实例,将其归类为表6所示的五种类型(每种类型附示例):
(1) 错误证据 $(55%)$:模型从混合上下文中获取了错误的支持依据;
(2) 缺失证据
Table 3: Performance of different models on dev and test set of TAT-QA. Best results are marked in bold.
表 3: 不同模型在TAT-QA开发集和测试集上的性能表现。最佳结果以粗体标出。
| 方法 | 开发集 | 测试集 | ||
|---|---|---|---|---|
| EM | F1 | EM | F1 | |
| Human | 84.1 | 90.8 | ||
| Textual QA BERT-RC | 9.5 | 17.9 | 9.1 | 18.7 |
| NumNet+ V2 | 38.1 | 48.3 | 37.0 | 46.9 |
| Tabular QA TaPas for WTQ | 18.9 | 26.5 | 16.6 | 22.8 |
| Hybrid QA HyBrider | 6.6 | 8.3 | 6.3 | 7.5 |
| TAGOP | 55.2 | 62.7 | 50.1 | 58.0 |
Table 4: Detailed experimental results of TAGOP w.r.t. answer types and sources on test set.
表 4: TAGOP 在测试集上针对答案类型和来源的详细实验结果。
| 表格 | 文本 | 表格-文本 | 总计 | |
|---|---|---|---|---|
| EM/F1 | EM/F1 | EM/F1 | EM/F1 | |
| 片段 | 56.5/57.8 | 45.2/70.6 | 68.2/71.7 | 54.1/67.9 |
| 多片段 | 66.3/77.0 | 19.0/59.1 | 63.2/76.9 | 60.0/75.1 |
| 计数 | 63.6/63.6 | -/- | 62.1/62.1 | 62.5/62.5 |
| 算术 | 41.1/41.1 | 27.3/27.3 | 46.5/46.5 | 42.5/42.5 |
| 总计 | 47.8/49.3 | 43.3/68.7 | 58.3/62.2 | 50.1/58.0 |
Table 5: Performance with different aggregation operators of TAGOP model.
表 5: TAGOP模型采用不同聚合算子时的性能表现。
| 模型 | Dev | Test | ||
|---|---|---|---|---|
| EM | F1 | EM | F1 | |
| + Span-in-text | 13.4 | 20.5 | 14.1 | 21.8 |
| +Cell-in-table | 25.4 | 36.0 | 24.1 | 35.3 |
| + Spans | 33.6 | 41.3 | 31.3 | 39.4 |
| + Sum | 33.8 | 41.3 | 31.2 | 39.1 |
| + Count | 35.9 | 43.5 | 32.7 | 40.6 |
| + Average | 43.3 | 50.6 | 38.2 | 45.9 |
| +Multiplication | 44.2 | 51.4 | 37.9 | 46.0 |
| + Division | 45.0 | 52.5 | 39.2 | 47.5 |
| + Difference | 51.4 | 58.7 | 45.1 | 53.3 |
| + Change ratio (Full) | 55.2 | 62.7 | 50.1 | 58.0 |
Evidence $(29%)$ , meaning the model failed to extract the supporting evidence for the answer; (3) Wrong Calculation $(9%)$ , meaning the model failed to compute the answer with the correct supporting evidence; (4) Unsupported Calculation $(4%)$ , meaning the ten operators defined cannot support this calculation; (5) Scale Error $(3%)$ , meaning the model failed to predict the scale of the numerical value in an answer.
证据不足 $(29%)$ ,表示模型未能提取支持答案的证据;(3) 计算错误 $(9%)$ ,表示模型未能基于正确的支持证据计算出答案;(4) 不支持的计算 $(4%)$ ,表示定义的十个运算符无法支持该计算;(5) 数值范围错误 $(3%)$ ,表示模型未能正确预测答案中数值的规模。
We can then observe about $84%$ error is caused by the failure to extract the supporting evidence from the table and paragraphs given a question. This demonstrates more efforts are needed to strengthen the model’s capability of precisely aggregating information from hybrid contexts.
随后我们可以观察到约 $84%$ 的错误源于给定问题时未能从表格和段落中提取支持性证据。这表明需要更多努力来增强模型从混合语境中精准聚合信息的能力。
After instance-level analysis, we find another interesting error resource is the dependence on domain knowledge. While we encourage annotators to create questions answerable by humans without much finance knowledge, we still find domain knowledge is required for some questions. For example, given the question “What is the gross profit margin of the company in 2015?”, the model needs to extract the gross profit and revenue from the hybrid context and compute the answer according to the finance formula (“gross profit margin $\mathbf{\mu}_{!}=g r o s s$ profit / revenue”). How to integrate such finance knowledge into QA models to answer questions in TAT-QA still needs further exploration.
在实例级分析后,我们发现另一个有趣的误差来源是对领域知识的依赖。虽然我们鼓励标注者创建人类无需太多金融知识即可回答的问题,但仍发现部分问题需要领域知识。例如,针对问题"该公司2015年的毛利率是多少?",模型需要从混合上下文中提取毛利和营收数据,并根据金融公式计算答案 ("毛利率 $\mathbf{\mu}_{!}=g r o s s$ profit / revenue")。如何将此类金融知识整合到问答模型中以解决TAT-QA的问题仍需进一步探索。
Table 6: Examples of error and corresponding percentage. Q, G, P denote question, ground truth, prediction.
| 错误类型 (占比) | 示例 |
|---|---|
| 证据错误 (55%) | Q: 二级OFA从2018年末到2019年末变化了多少? G:375-2,032 P:1,941 - 2,032 |
| 证据缺失 (29%) | Q: 调整后EBITDA超过40亿美元的年份有多少? G:计数(2017,2018,2019) P:计数(2017,2018) |
| 计算错误 (9%) | Q: 税前亏损占比从2018年到2019年的变化是多少? G:39% - 20% P:20% - 39% |
| 无依据计算 (4%) | Q: 2019年投资者关系和顾问费用占总运营支出的比例是多少? G:(105,639 + 245,386)/19,133,139 P:245,386/19,133,139 |
| 数量级错误 (3%) | Q: 2020年3月的收盘价是多少? G:0.22 P:0.22百万 |
表6: 错误类型及对应比例示例。Q、G、P分别表示问题、真实值、预测值。
5 Related Work
5 相关工作
QA Datasets Currently, there are many datasets for QA tasks, focusing on text, or KB/table. Textual ones include CNN/Daily Mail (Hermann et al., 2015), SQuAD (Rajpurkar et al., 2016), etc. Recently deep reasoning over textual data has gained increasing attention (Zhu et al., 2021), e.g. multihop reasoning (Yang et al., 2018; Welbl et al., 2018). DROP (Dua et al., 2019) is built to develop numerical reasoning capability of QA models, which in this sense is similar to TAT-QA, but only focuses on textual data. KB/Tabular QA aims to automatically answer questions via wellstructured KB (Berant et al., 2013; Talmor and Berant, 2018; Yih et al., 2015) or semi-structured tables (Pasupat and Liang, 2015; Zhong et al., 2017; Yu et al., 2018). Comparably, QA over hybrid data receives limited efforts, focusing on mixture of KB/tables and text. HybridQA (Chen et al., 2020b)is one existing hybrid dataset for QA tasks, where the context is a table connected with Wiki pages via hyperlinks.
QA数据集
目前有许多针对问答任务的数据集,主要关注文本或知识库/表格。文本类数据集包括CNN/Daily Mail (Hermann et al., 2015)、SQuAD (Rajpurkar et al., 2016)等。近年来,对文本数据的深度推理日益受到关注 (Zhu et al., 2021),例如多跳推理 (Yang et al., 2018; Welbl et al., 2018)。DROP (Dua et al., 2019)旨在开发问答模型的数值推理能力,在这方面与TAT-QA类似,但仅专注于文本数据。
知识库/表格问答旨在通过结构化知识库 (Berant et al., 2013; Talmor and Berant, 2018; Yih et al., 2015) 或半结构化表格 (Pasupat and Liang, 2015; Zhong et al., 2017; Yu et al., 2018) 自动回答问题。相比之下,混合数据问答的研究较少,主要集中在知识库/表格与文本的结合上。HybridQA (Chen et al., 2020b) 是现有的混合问答数据集之一,其上下文是通过超链接与维基页面关联的表格。
Numerical Reasoning Numerical reasoning is key to many NLP tasks like question answering (Dua et al., 2019; Ran et al., 2019; Andor et al., 2019; Chen et al., 2020a; Pasupat and Liang, 2015; Herzig et al., 2020; Yin et al., 2020; Zhang and Balog, 2020) and arithmetic word problems (Kushman et al., 2014; Mitra and Baral, 2016; Huang et al., 2017; Ling et al., 2017). To our best knowledge, no prior work attempts to develop models able to perform numerical reasoning over hybrid contexts.
数值推理
数值推理是许多自然语言处理 (NLP) 任务的关键,例如问答 (Dua et al., 2019; Ran et al., 2019; Andor et al., 2019; Chen et al., 2020a; Pasupat and Liang, 2015; Herzig et al., 2020; Yin et al., 2020; Zhang and Balog, 2020) 和算术应用题 (Kushman et al., 2014; Mitra and Baral, 2016; Huang et al., 2017; Ling et al., 2017)。据我们所知,此前尚无研究尝试开发能够在混合上下文中执行数值推理的模型。
6 Conclusion
6 结论
We propose a new challenging QA dataset TATQA, comprising real-word hybrid contexts where the table contains numbers and has comprehensive dependencies on text in finance domain. To answer questions in TAT-QA, the close relation between table and paragraphs and numerical reasoning are required. We also propose a baseline model TAGOP based on TAT-QA, aggregating information from hybrid context and performing numeri- cal reasoning over it with pre-defined operators to compute the final answer. Experiments show TATQA dataset is very challenging and more effort is demanded for tackling QA tasks over hybrid data. We expect our TAT-QA dataset and TAGOP model would serve as a benchmark and baseline respectively to help build more advanced QA models, facilitating the development of QA technologies to address more complex and realistic hybrid data, especially those requiring numerical reasoning.
我们提出一个具有挑战性的新型问答数据集TAT-QA,包含金融领域真实场景下的混合上下文,其中表格包含数字并与文本存在复杂依赖关系。要回答TAT-QA中的问题,需要理解表格与段落间的紧密关联并进行数值推理。我们还基于TAT-QA提出了基线模型TAGOP,该模型通过预定义运算符聚合混合上下文信息并执行数值推理来计算最终答案。实验表明TAT-QA数据集极具挑战性,处理混合数据的问答任务需要更多研究投入。我们期望TAT-QA数据集和TAGOP模型能分别作为基准和基线,助力构建更先进的问答模型,推动问答技术发展以应对更复杂、更现实的混合数据场景,特别是需要数值推理的案例。
A Appendix
A 附录
A.1 Table Analysis
A.1 表格分析
To maintain the semi-structured nature of financial tables, we almost keep the same table structure in TAT-QA as that in the original financial reports. We sample 100 hybrid contexts from the training set to conduct a manual evaluation to assess the complexity of the table structures. Specifically, we analyze the distribution w.r.t. the number of row headers, as shown in Table 7. It can be seen that around $79%$ of the tables have two or more rowheaders, indicating large difficulty in interpreting financial tables. In addition, we have also found that all sampled tables all have one column header.
为保持财务表格的半结构化特性,我们在TAT-QA中几乎完全保留了原始财报的表格结构。我们从训练集中抽取100组混合上下文进行人工评估,以衡量表格结构的复杂度。具体而言,我们分析了行标题数量的分布情况(如表7所示)。结果显示约$79%$的表格具有两个及以上行标题,这表明财务表格的解析存在较大难度。此外还发现所有抽样表格均包含一个列标题。
Table 7: Distribution of no. of row-headers in TATQA.
| 行标题数量 | 占比 (%) |
|---|---|
| 1 | 21 |
| 2 | 68 |
| 3 | 9 |
| 超过3个 | 2 |
表 7: TATQA 数据集中行标题数量的分布情况。
A.3 Scale Prediction
A.3 规模预测
We report the proportion of the ground truth scale in an answer and also the performance of our scale predictor on dev and test set in Table 9.
我们在表9中报告了答案中真实比例(ground truth scale)的占比,以及我们的比例预测器在开发集和测试集上的表现。
Table 9: The proportion of ground truth scale on dev and test set of TAT-QA with prediction accuracy by scale predictor of TAGOP.
表 9: TAT-QA开发集和测试集的真实数值比例与TAGOP尺度预测器的预测准确率
| 尺度 | 开发集 % | 开发集 Acc | 测试集 % | 测试集 Acc |
|---|---|---|---|---|
| 无 | 47.6 | 92.4 | 50.3 | 90.1 |
| 千 | 20.7 | 96.8 | 19.2 | 95.3 |
| 百万 | 15.2 | 92.1 | 12.9 | 90.2 |
| 十亿 | 0.4 | 28.6 | - | |
| 百分比 | 16.1 | 95.9 | 17.7 | 95.9 |
A.2 Operator Classifier
A.2 操作符分类器
We present the proportion of questions that should go through each aggregation operator (ground truth), as well as the performance of our operator classifier on dev and test set in Table 8.
我们在表8中展示了应通过各聚合运算符的问题比例(真实值),以及我们的运算符分类器在开发集和测试集上的性能。
Table 8: Ground truth proportion of questions that should be fed to different operators and prediction accuracy by operator classifier of TAGOP on dev and test set of TAT-QA.
表 8: TAT-QA开发集和测试集中应分配给不同运算符的问题真实比例及TAGOP运算符分类器的预测准确率
| 运算符 | 开发集 | 测试集 |
|---|---|---|
| % | Acc | |
| 文本片段(Span-in-text) | 20.9 | 92.3 |
| 表格单元格(Cell-in-table) | 21.1 | 91.2 |
| 多片段(Spans) | 13.0 | 96.8 |
| 求和(Sum) | 3.4 | 86.0 |
| 计数(Count) | 1.9 | 93.8 |
| 平均值(Average) | 8.5 | 100.0 |
| 乘法(Multiplication) | 0.2 | 33.3 |
| 除法(Division) | 1.0 | 76.5 |
| 差值(Difference) | 14.1 | 96.6 |
| 变化率(Change ratio) | 9.3 | 96.1 |
| 其他(Other) | 6.6 | 0.0 |