Uni-Mol: A Universal 3D Molecular Representation Learning Framework
Uni-Mol: 通用3D分子表征学习框架
Abstract
摘要
Molecular representation learning (MRL) has gained tremendous attention due to its critical role in learning from limited supervised data for applications like drug design. In most MRL methods, molecules are treated as 1D sequential tokens or 2D topology graphs, limiting their ability to incorporate 3D information for downstream tasks and, in particular, making it almost impossible for 3D geometry prediction or generation. Herein, we propose Uni-Mol, a universal MRL framework that significantly enlarges the representation ability and application scope of MRL schemes. Uni-Mol is composed of two models with the same SE(3)-e qui variant transformer architecture: a molecular pre training model trained by 209M molecular conformations; a pocket pre training model trained by 3M candidate protein pocket data. The two models are used independently for separate tasks, and are combined when used in protein-ligand binding tasks. By properly incorporating 3D information, Uni-Mol outperforms SOTA in 14/15 molecular property prediction tasks. Moreover, Uni-Mol achieves superior performance in 3D spatial tasks, including protein-ligand binding pose prediction, molecular conformation generation, etc. Finally, we show that Uni-Mol can be successfully applied to the tasks with few-shot data like pocket drug g ability prediction. The model and data will be made publicly available at https://github.com/dptech-corp/Uni-Mol.
分子表示学习 (Molecular Representation Learning, MRL) 因其在药物设计等应用中从有限监督数据学习的关键作用而备受关注。大多数MRL方法将分子视为1D序列Token或2D拓扑图,限制了其在下游任务中整合3D信息的能力,尤其使得3D几何预测或生成几乎无法实现。为此,我们提出Uni-Mol——一个通用MRL框架,显著扩展了MRL方案的表征能力和应用范围。Uni-Mol由两个具有相同SE(3)等变Transformer架构的模型组成:基于2.09亿个分子构象训练的分子预训练模型,以及基于300万个候选蛋白质口袋数据训练的口袋预训练模型。这两个模型可独立用于不同任务,并在蛋白质-配体结合任务中联合使用。通过合理整合3D信息,Uni-Mol在14/15的分子性质预测任务中超越SOTA。此外,该框架在3D空间任务(包括蛋白质-配体结合位姿预测、分子构象生成等)中表现出卓越性能。最后,我们证明Uni-Mol能成功应用于少样本数据任务(如口袋成药性预测)。模型与数据将在https://github.com/dptech-corp/Uni-Mol公开。
1 Introduction
1 引言
Recently, representation learning (or pre training, self-supervised learning) [1, 2, 3] has been prevailing in many applications, such as BERT [4] and GPT [5, 6, 7] in Natural Language Processing (NLP), ViT [8] in Computer Vision (CV), etc. These applications have a common characteristic: unlabeled data is abundant, while labeled data is limited. As a solution, in a typical representation learning method, one first adopts a pre training procedure to learn a good representation from large-scale unlabeled data, and then a finetuning scheme is followed to extract more information from limited supervised data.
近年来,表示学习(或称预训练、自监督学习)[1, 2, 3] 在众多应用中占据主导地位,例如自然语言处理 (NLP) 领域的 BERT [4] 和 GPT [5, 6, 7],计算机视觉 (CV) 领域的 ViT [8] 等。这些应用具有一个共同特点:未标注数据丰富,而已标注数据有限。作为解决方案,典型的表示学习方法通常先通过预训练流程从大规模无标注数据中学习优质表示,再采用微调方案从有限的监督数据中提取更多信息。
Applications in the field of drug design share the characteristic that calls for representation learning schemes. The chemical space that a drug candidate lies in is vast, while drug-related labeled data is limited. Not surprisingly, compared with traditional molecular fingerprint based models [9, 10], recent molecular representation learning (MRL) models perform much better in most property prediction tasks [11, 12, 13]. However, to further improve the performance and extend the application scope of existing MRL models, one is faced with a critical issue. From the perspective of life science, the properties of molecules and the effects of drugs are mostly determined by their 3D structures [14,
药物设计领域的应用具有一个共同特点:需要表征学习方案。候选药物的化学空间极为广阔,而药物相关的标注数据却十分有限。与传统基于分子指纹的模型 [9, 10] 相比,近年兴起的分子表征学习 (MRL) 模型在大多数性质预测任务中表现更优 [11, 12, 13] 并不令人意外。然而,要进一步提升现有 MRL 模型的性能并扩展其应用范围,研究者面临一个关键问题。从生命科学角度看,分子特性和药物效应主要由其三维结构决定 [14,
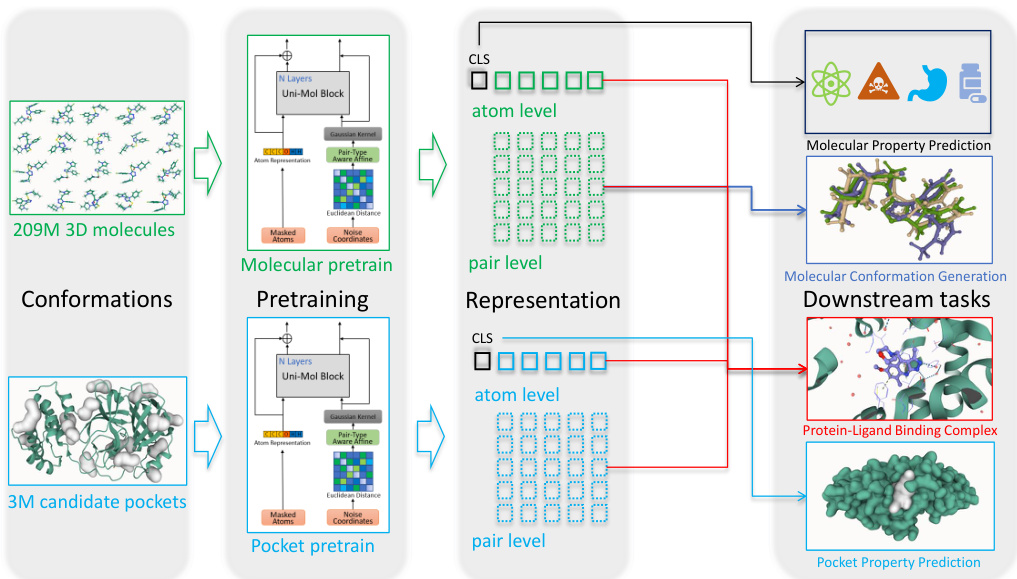
Figure 1: Schematic illustration of the Uni-Mol framework. Uni-Mol is composed of two models: a molecular pre training model trained by 209M molecular 3D conformations; a pocket pre training model trained by 3M candidate protein pocket data. The two models are used independently for separate tasks, and are combined when used in protein-ligand binding tasks.
图 1: Uni-Mol框架示意图。Uni-Mol由两个模型组成:一个通过2.09亿个分子3D构象训练的分子预训练模型;一个通过300万个候选蛋白质口袋数据训练的口袋预训练模型。这两个模型在独立任务中单独使用,在蛋白质-配体结合任务中联合使用。
15]. In most current MRL methods, one starts with representing molecules as 1D sequential strings, such as SMILES [16, 17, 18] and InChI [19, 20, 21], or 2D graphs [22, 11, 23, 12]. This may limit their ability to incorporate 3D information for downstream tasks. In particular, this makes it almost impossible for 3D geometry prediction or generation, such as, e.g., the prediction of proteinligand binding pose [24]. Even though there have been some recent attempts trying to leverage 3D information in MRL [25, 26], the performance is less than optimal, possibly due to the small size of 3D datasets, and 3D positions can not be used as inputs/outputs during finetuning, since they only serve as auxiliary information.
在目前大多数分子表示学习 (MRL) 方法中,研究者通常将分子表示为1D序列字符串(如SMILES [16, 17, 18]和InChI [19, 20, 21])或2D图结构 [22, 11, 23, 12]。这种做法可能限制了下游任务中3D信息的整合能力,尤其使得3D几何预测或生成(例如蛋白质-配体结合位姿预测 [24])几乎无法实现。尽管近期已有研究尝试在MRL中利用3D信息 [25, 26],但由于3D数据集规模较小,且3D坐标仅作为辅助信息无法在微调时作为输入/输出,其性能尚未达到最优。
In this work, we propose Uni-Mol, to our best knowledge, the first universal 3D molecular pre training framework, which is derived from large-scale unlabeled data and is able to directly take 3D positions as both inputs and outputs. Uni-Mol consists of 3 parts. 1) Backbone. Based on Transformer, the invariant spatial positional encoding and pair level representation are added to better capture the 3D information. Moreover, an e qui variant head is used to directly predict 3D positions. 2) Pre training. We create two large-scale datasets, a 209M molecular conformation dataset and a 3M candidate protein pocket dataset, for pre training 2 models on molecules and protein pockets, respectively. For the pre training tasks, besides masked atom prediction, a 3D position denoising task is used for learning 3D spatial representation. 3) Finetuning. According to specific downstream tasks, the used pre training models are different. For example, in molecular property prediction tasks, only the molecular pre training model is used; in protein-ligand binding pose prediction, both two pre training models are used. We refer to Fig. 1 for an overall schematic illustration of the Uni-Mol framework.
在本研究中,我们提出了Uni-Mol——据我们所知,这是首个通用的3D分子预训练框架。该框架基于大规模未标注数据构建,能直接将3D坐标作为输入和输出。Uni-Mol包含三部分:1) 主干网络。基于Transformer架构,通过添加不变空间位置编码和配对级表征来增强3D信息捕捉能力,并采用等变头直接预测3D坐标;2) 预训练。我们构建了两个大规模数据集(2.09亿分子构象数据集和300万候选蛋白质口袋数据集),分别用于分子和蛋白质口袋的预训练模型。除掩码原子预测外,还采用3D位置去噪任务学习空间表征;3) 微调。根据下游任务选择不同预训练模型,例如分子性质预测仅使用分子预训练模型,而蛋白质-配体结合位姿预测则联合使用两个模型。框架整体示意图参见图1:
To demonstrate the effectiveness of Uni-Mol, we conduct experiments on a series of downstream tasks. In the molecular property prediction tasks, Uni-Mol outperforms SOTA on 14/15 datasets on the Molecule Net benchmark. In 3D geometric tasks, Uni-Mol also achieves superior performance. For the pose prediction of protein-ligand complexes, Uni-Mol predicts $88.07%$ binding poses with $\mathrm{RMSD}<=2\mathring{\mathrm{A}}$ , $22.81%$ more than popular docking methods, and ranks 1st in the docking power test on CASF-2016 [27] benchmark. Regarding molecular conformation generation, Uni-Mol achieves SOTA for both Coverage and Matching metrics on GEOM-QM9 and GEOM-Drugs [28]. Moreover, Uni-Mol can be successfully applied to tasks with very limited data like pocket drug g ability prediction.
为验证Uni-Mol的有效性,我们在多个下游任务上进行了实验。在分子属性预测任务中,Uni-Mol在Molecule Net基准测试的14/15数据集上超越了SOTA水平。在3D几何任务中,Uni-Mol同样展现出卓越性能。针对蛋白质-配体复合物的构象预测,Uni-Mol以88.07%的结合构象预测精度达到$\mathrm{RMSD}<=2\mathring{\mathrm{A}}$标准,比主流对接方法提升22.81%,并在CASF-2016[27]基准的对接能力测试中排名第一。在分子构象生成方面,Uni-Mol在GEOM-QM9和GEOM-Drugs[28]数据集上同时取得Coverage和Matching指标的SOTA成绩。此外,Uni-Mol还能成功应用于口袋药物结合能力预测等数据量极少的任务场景。
2 Uni-Mol Framework
2 Uni-Mol 框架
In this section, we introduce the Uni-Mol framework by showing the details of the backbone, the pre training scheme, and the finetuning scheme. We refer to Fig. 2 for a schematic illustration of the model architecture.
在本节中,我们通过介绍主干网络、预训练方案和微调方案的细节来引入Uni-Mol框架。模型架构的示意图可参考图2。
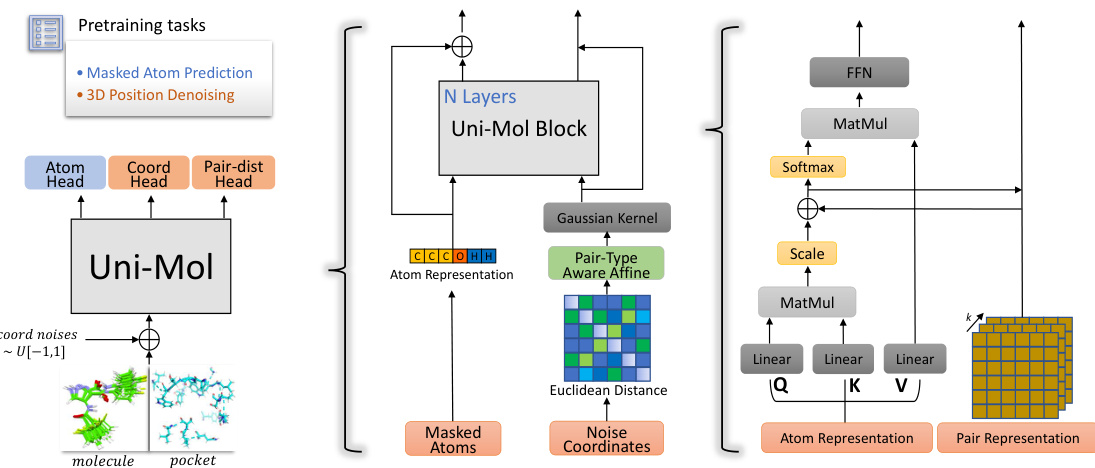
Figure 2: Left: the overall pre training architecture. Middle: the model inputs, including atoms and spatial positional encoding created by pair Euclidean distance. Right: pair representation and its update process.
图 2: 左: 整体预训练架构。中: 模型输入,包括原子和由成对欧几里得距离生成的空间位置编码。右: 成对表示及其更新过程。
2.1 Backbone
2.1 主干网络
Transformer [29] is the default backbone in representation learning. However, Transformer was originally designed for NLP tasks and cannot handle 3D spatial data directly. To tackle this, based on the standard Transformer with Pre-LayerNorm [30] backbone, we introduce several modifications.
Transformer [29] 是表征学习中的默认骨干网络。然而,Transformer最初是为NLP任务设计的,无法直接处理3D空间数据。为此,我们在标准Transformer(采用Pre-LayerNorm [30] 骨干结构)的基础上进行了若干改进。
Invariant spatial positional encoding Due to its permutation ally invariant property, Transformer cannot distinguish the positions of inputs without positional encoding. Different with the discrete (ordinal) positions used in NLP/CV [31, 32], the positions in 3D space, i.e. coordinates, are continuous values. Besides, the positional encoding procedure needs to be invariant under global rotation and translation. To achieve that, similar to the relative positional encoding, we simply use Euclidean distances of all atom pairs, as well as pair-type aware Gaussian kernels [33]. Formally, the $D$ -channel positional encoding of atom pair $i j$ is denoted as
不变空间位置编码
由于其排列不变性,Transformer 在没有位置编码的情况下无法区分输入的位置。与 NLP/CV 中使用的离散(序数)位置 [31, 32] 不同,3D 空间中的位置(即坐标)是连续值。此外,位置编码过程需要在全局旋转和平移下保持不变。为了实现这一点,类似于相对位置编码,我们简单地使用所有原子对的欧几里得距离,以及考虑对类型的高斯核 [33]。形式上,原子对 $i j$ 的 $D$ 通道位置编码表示为
$$
\begin{array}{r}{\pmb{p}{i j}={\mathcal{G}(A(d_{i j},t_{i j};a,b),\mu^{k},\sigma^{k})|k\in[1,D]},\quad\pmb{\mathcal{A}}(d,r;\pmb{a},\pmb{b})=a_{r}d+b_{r},}\end{array}
$$
$$
\begin{array}{r}{\pmb{p}{i j}={\mathcal{G}(A(d_{i j},t_{i j};a,b),\mu^{k},\sigma^{k})|k\in[1,D]},\quad\pmb{\mathcal{A}}(d,r;\pmb{a},\pmb{b})=a_{r}d+b_{r},}\end{array}
$$
where $\begin{array}{r}{\mathcal{G}(d,\mu,\sigma)=\frac{1}{\sigma\sqrt{2\pi}}e^{-\frac{(d-\mu)^{2}}{2\sigma^{2}}}}\end{array}$ is a Gaussian density function with parameters $\mu$ and $\sigma$ , $d_{i j}$ is the Euclidean distance of atom pair $i j$ , and $t_{i j}$ is the pair-type of atom pair $i j$ . Please note the pair-type here is not the chemical bond, and it is determined by the atom types of pair $i j$ . $\mathscr{A}(d_{i j},t_{i j};\pmb{a},\dot{\pmb{b})}$ is the affine transformation with parameters $^{a}$ and $^{b}$ , it affines $d_{i j}$ corresponding to its pair-type $t_{i j}$ . Except $d_{i j}$ and $t_{i j}$ , all remaining parameters are trainable and randomly initialized.
其中 $\begin{array}{r}{\mathcal{G}(d,\mu,\sigma)=\frac{1}{\sigma\sqrt{2\pi}}e^{-\frac{(d-\mu)^{2}}{2\sigma^{2}}}}\end{array}$ 是以 $\mu$ 和 $\sigma$ 为参数的高斯密度函数,$d_{i j}$ 表示原子对 $i j$ 的欧氏距离,$t_{i j}$ 表示原子对 $i j$ 的配对类型。请注意此处的配对类型并非化学键类型,而是由原子对 $i j$ 的原子类型决定。$\mathscr{A}(d_{i j},t_{i j};\pmb{a},\dot{\pmb{b})}$ 是以 $^{a}$ 和 $^{b}$ 为参数的仿射变换,该变换会根据配对类型 $t_{i j}$ 对 $d_{i j}$ 进行仿射处理。除 $d_{i j}$ 和 $t_{i j}$ 外,其余参数均为可训练且随机初始化的参数。
Pair representation By default, Transformer maintains the token(atom) level representation, which is later used in finetuning downstream tasks. Nevertheless, as the spatial positions are encoded at pair-level, we also maintain the pair-level representation, to better learn the 3D spatial representation. Specifically, the pair representation is initialized as the aforementioned spatial positional encoding. Then, to update pair representation, we use the atom-to-pair communication via the multi-head QueryKey product results in self-attention. Formally, the update of $i j$ pair representation is denoted as
配对表示
默认情况下,Transformer 保持 token(原子)级别的表示,该表示随后用于微调下游任务。然而,由于空间位置是在配对级别编码的,我们也保持配对级别的表示,以更好地学习 3D 空间表示。具体来说,配对表示初始化为上述空间位置编码。然后,为了更新配对表示,我们通过多头 QueryKey 乘积结果在自注意力中进行原子到配对的通信。形式上,$i j$ 配对表示的更新表示为
$$
q_{i j}^{0}=p_{i j}M,\quad q_{i j}^{l+1}=q_{i j}^{l}+{\frac{Q_{i}^{l,h}(K_{j}^{l,h})^{T}}{\sqrt{d}}|h\in[1,H]},
$$
$$
q_{i j}^{0}=p_{i j}M,\quad q_{i j}^{l+1}=q_{i j}^{l}+{\frac{Q_{i}^{l,h}(K_{j}^{l,h})^{T}}{\sqrt{d}}|h\in[1,H]},
$$
where $q_{i j}^{l}$ is the pair representation of atom pair $i j$ in $l$ -th layer, $H$ is the number of attention heads, $d$ is the dimension of hidden representations, $Q_{i}^{l,h}(K_{j}^{l,h})$ is the Query $(\mathrm{Key})$ of the $i$ -th ( $j$ -th) atom in the $l$ -th layer $h$ -th head, and $M\in\mathbb{R}^{D\times H}$ is the projection matrix to make the representation the same shape as multi-head Query-Key product results.
其中 $q_{i j}^{l}$ 是第 $l$ 层原子对 $i j$ 的成对表示,$H$ 是注意力头数,$d$ 是隐藏表示的维度,$Q_{i}^{l,h}(K_{j}^{l,h})$ 是第 $l$ 层第 $h$ 个头中第 $i$ 个(第 $j$ 个)原子的查询(键),$M\in\mathbb{R}^{D\times H}$ 是投影矩阵,用于使表示与多头查询-键乘积结果的形状相同。
Besides, to leverage 3D information in the atom representation, we also introduce the pair-to-atom communication, by using the pair representation as the bias term in self-attention. Formally, the self-attention with pair-to-atom communication is denoted as
此外,为了利用原子表示中的3D信息,我们还引入了配对-原子通信机制,通过将配对表示作为自注意力(self-attention)的偏置项。形式上,带有配对-原子通信的自注意力表示为
$$
\mathop{\mathrm{Attention}}(Q_{i}^{l,h},K_{j}^{l,h},V_{j}^{l,h})=\mathop{\mathrm{softmax}}(\frac{Q_{i}^{l,h}(K_{j}^{l,h})^{T}}{\sqrt{d}}+q_{i j}^{l-1,h})V_{j}^{l,h},
$$
$$
\mathop{\mathrm{Attention}}(Q_{i}^{l,h},K_{j}^{l,h},V_{j}^{l,h})=\mathop{\mathrm{softmax}}(\frac{Q_{i}^{l,h}(K_{j}^{l,h})^{T}}{\sqrt{d}}+q_{i j}^{l-1,h})V_{j}^{l,h},
$$
where V lj,h is the Value of the j-th atom in the l-th layer h-th head. The pair representation and atom-pair communication are firstly proposed in the Evoformer in AlphaFold [34], but the cost of Evoformer is extremely large. In Uni-Mol, as we keep them as simple as possible, the extra cost of maintaining pair representation is negligible.
其中V lj,h表示第l层第h个注意力头中第j个原子的Value值。这种配对表征和原子间信息交互机制最早由AlphaFold [34] 的Evoformer提出,但Evoformer的计算开销极大。在Uni-Mol中,我们尽可能简化了这些结构,因此维持配对表征所需的额外计算成本可以忽略不计。
SE(3)-E qui variance coordinate head With 3D spatial positional encoding and pair representation, the model can learn a good 3D representation. However, it still lacks the ability to directly output coordinates, which is essential in 3D spatial tasks. To this end, we add a simple SE(3)-e qui variance head to Uni-Mol. Following the idea of EGNN [35], the design of SE(3)-e qui variance head is denoted as
SE(3)等变坐标头
通过3D空间位置编码和配对表示,模型可以学习到良好的3D表征。然而,它仍缺乏直接输出坐标的能力,而这在3D空间任务中至关重要。为此,我们在Uni-Mol中添加了一个简单的SE(3)等变头。遵循EGNN [35]的思想,SE(3)等变头的设计表示为
$$
\hat{\pmb x}{i}=\pmb x_{i}+\sum_{j=1}^{n}\frac{(\pmb x_{i}-\pmb x_{j})c_{i j}}{n},\quad c_{i j}=\operatorname{ReLU}((\pmb q_{i j}^{L}-\pmb q_{i j}^{0})U)W,
$$
$$
\hat{\pmb x}{i}=\pmb x_{i}+\sum_{j=1}^{n}\frac{(\pmb x_{i}-\pmb x_{j})c_{i j}}{n},\quad c_{i j}=\operatorname{ReLU}((\pmb q_{i j}^{L}-\pmb q_{i j}^{0})U)W,
$$
where $n$ is the number of total atoms, $L$ is the number of layers in model, $\pmb{x}{i}\in\mathbb{R}^{3}$ is the input coordinate of $i$ -th atom, and $\hat{\pmb x}_{i}\in\mathbb{R}^{3}$ is the output coordinate of $i\cdot$ -th atom, $\mathrm{ReLU}(y)=\operatorname*{max}(0,y)$ is Rectified Linear Unit [36], $\pmb{U}\in\mathbb{R}^{H\times H}$ and $\dot{\boldsymbol W}\in\mathbb R^{H\times1}$ are the projection matrices to convert pair representation to scalar.
其中 $n$ 是原子总数,$L$ 是模型的层数,$\pmb{x}{i}\in\mathbb{R}^{3}$ 是第 $i$ 个原子的输入坐标,$\hat{\pmb x}_{i}\in\mathbb{R}^{3}$ 是第 $i$ 个原子的输出坐标,$\mathrm{ReLU}(y)=\operatorname*{max}(0,y)$ 是修正线性单元 (Rectified Linear Unit) [36],$\pmb{U}\in\mathbb{R}^{H\times H}$ 和 $\dot{\boldsymbol W}\in\mathbb R^{H\times1}$ 是将配对表示转换为标量的投影矩阵。
2.2 Pre training
2.2 预训练
For the purpose of pre training, we generate two large-scale datasets, one composed of 3D structures of organic molecules, and another composed of 3D structures of candidate protein pockets. Then, two models are pretrained using these two datasets, respectively. As pockets are directly involved in many drug design tasks, intuitively, the pre training on candidate protein pockets can boost the performance of tasks related to protein-ligand structures and interactions.
为了预训练目的,我们生成了两个大规模数据集:一个由有机分子的3D结构组成,另一个由候选蛋白质口袋的3D结构组成。随后分别使用这两个数据集对两个模型进行预训练。由于口袋直接参与许多药物设计任务,直观而言,对候选蛋白质口袋的预训练能够提升与蛋白质-配体结构及相互作用相关任务的性能。
The molecular pre training dataset is based on multiple public datasets (See Appendix A for more information). After normalizing and de duplicating, it contains about 19M molecules. To generate 3D conformations, we use ETKGD [37] with Merck Molecular Force Field [38] optimization in RDKit [39] to randomly generate 10 conformations for each molecule. We also generate an additional 2D conformation (based on the molecular graph), to avoid some rare cases that fail to generate 3D conformations.
分子预训练数据集基于多个公共数据集(更多信息见附录A)。经过归一化和去重处理后,包含约1900万个分子。为生成3D构象,我们采用RDKit[39]中的ETKGD[37]结合默克分子力场[38]优化方法,为每个分子随机生成10个构象。同时额外生成一个2D构象(基于分子图结构),以避免某些无法生成3D构象的罕见情况。
The protein pocket pre training dataset is derived from the Protein Data Bank (RCSB PDB 3) [40], a collection of 180K 3D structures of proteins. To extract candidate pockets, we first clean the data by adding the missing side chains and hydrogen atoms; then we use Fpocket [41] to detect possible binding pockets of the proteins; and finally, we filter pockets by the number of residues in contact with and retains water molecules in the pocket. In this way, We collect a dataset composed of $3.2\mathbf{M}$ candidate pockets for pre training.
蛋白质口袋预训练数据集来源于蛋白质数据库 (RCSB PDB 3) [40],该库包含180K个蛋白质的3D结构。为提取候选口袋,我们首先通过补充缺失的侧链和氢原子来清洗数据;随后使用Fpocket [41]检测蛋白质的潜在结合口袋;最后根据接触残基数量筛选口袋,并保留口袋内的水分子。通过这种方式,我们收集了由 $3.2\mathbf{M}$ 个候选口袋组成的预训练数据集。
Self-supervised task is vitally important for effective learning from large-scale unlabeled data. For example, the masked token prediction task in BERT [4] encourages the model to learn the contextual information. Similar to BERT, the masked atom prediction task is used in Uni-Mol. For each molecule/pocket, we add a special atom [CLS], whose coordinate is the center of all atoms, to represent the whole molecule/pocket. However, as 3D spatial positional encoding leaks chemical bonds, atom types could be inferred easily, and therefore, the masked atom prediction cannot encourage the model to learn useful information. To tackle this, as well as learning from 3D information, we design a 3D position denoising task. Particularly, uniform noises of $[-1\overset{\circ}{\mathrm{A}},1\mathring{\mathrm{A}}]$ are added to the random $15%$ atom coordinates, then the spatial positional encoding is calculated based on corrupted coordinates. In this way, the masked atom prediction task becomes non-trivial. Besides, two additional heads are used to recover the correct spatial positions. 1) Pair-distance prediction. Based on pair-representation, the model needs to predict the correct Euclidean distances of the atoms pairs with corrupted coordinates. 2) Coordinate prediction. Based on SE(3)-E qui variance coordinate head, the model needs to predict the correct coordinates for the atoms with corrupted coordinates.
自监督任务对于从大规模无标注数据中有效学习至关重要。例如,BERT [4] 中的掩码token预测任务促使模型学习上下文信息。与BERT类似,Uni-Mol采用了掩码原子预测任务。对于每个分子/口袋,我们添加一个特殊原子[CLS](其坐标为所有原子的中心)来代表整个分子/口袋。然而,由于3D空间位置编码会泄露化学键信息,原子类型容易被推断,因此掩码原子预测无法促使模型学习有用信息。为解决这一问题并学习3D信息,我们设计了一个3D位置去噪任务。具体而言,对随机15%的原子坐标添加$[-1\overset{\circ}{\mathrm{A}},1\mathring{\mathrm{A}}]$的均匀噪声,然后基于被污染的坐标计算空间位置编码。通过这种方式,掩码原子预测任务变得不再平凡。此外,我们还使用了两个额外的头来恢复正确的空间位置:1) 配对距离预测。基于配对表示,模型需要预测坐标被污染原子对的正确欧氏距离;2) 坐标预测。基于SE(3)等变坐标头,模型需要预测坐标被污染原子的正确坐标。
Both 2 pre training models use the same self-supervised tasks described above, and Figure 2 is the illustration of the overall pre training framework. For the detailed configurations of pre training, please refer to Appendix C.
两个预训练模型都使用了上述相同的自监督任务,图 2: 展示了整体预训练框架的示意图。关于预训练的详细配置,请参阅附录 C。
2.3 Finetuning
2.3 微调 (Finetuning)
To be consistent with pre training, we use the same data prepossessing pipeline during finetuning. For molecules, as multiple random conformations can be generated in a short time, we can use them as data augmentation in finetuning to improve performance and robustness. Some molecules may fail to generate 3D conformations, and we use their molecular graph as 2D conformation. For tasks that provide atom coordinates, we use them directly and skip the 3D conformation generation process. As there are 2 pre training models and several types of downstream tasks, we should properly use them in the finetuning stage. According to the task types, and the involvement of protein or ligand, we can categorize them as follow.
为了与预训练保持一致,我们在微调阶段使用了相同的数据预处理流程。对于分子而言,由于短时间内可以生成多种随机构象,我们可以在微调中将其作为数据增强手段来提升性能和鲁棒性。部分分子可能无法生成3D构象,此时我们使用其分子图作为2D构象。对于提供原子坐标的任务,我们直接使用这些坐标并跳过3D构象生成过程。由于存在两种预训练模型和多种下游任务类型,我们需要在微调阶段合理选用它们。根据任务类型及蛋白质/配体参与情况,可将其分类如下:
Non-3D prediction tasks These tasks do not need to output 3D conformations. Examples include molecular property prediction, molecule similarity, pocket drug g ability prediction, protein-ligand binding affinity prediction, etc. Similar to NLP/CV, we can simply use the representation of [CLS] which represents the whole molecule/pocket, or the mean representation of all atoms, with a linear head to finetune on downstream tasks. In the tasks with pocket-molecule pair, we can concatenate their [CLS] representations, and then finetune with linear head.
非3D预测任务
这些任务无需输出3D构象,例如分子性质预测、分子相似性、口袋成药性预测、蛋白质-配体结合亲和力预测等。与NLP/CV领域类似,我们可以直接使用代表整个分子/口袋的[CLS]表征,或所有原子的平均表征,通过线性头在下游任务上进行微调。对于涉及口袋-分子配对的任务,可以拼接两者的[CLS]表征,再用线性头进行微调。
3D prediction tasks of molecules or pockets These tasks need to predict a 3D conformation of the input, such as molecular conformation generation. Different with the fast conformation generation method used in Uni-Mol, molecular conformation generation task usually requires running advanced sampling and semi-empirical density functional theory (DFT) to account for the ensemble of 3D conformers that are accessible to a molecule, and this is very time-consuming. Therefore, there are many recent works that train the model to fast generate conformations from molecular graph [42, 43, 44, 45]. While in Uni-Mol, this task straightforwardly becomes a conformation optimization task: generate a new conformation based on a different input conformation. Specifically, in finetuning, the model supervised learns the mapping from Uni-Mol generated conformations to the labeled conformations. Moreover, the optimized conformations can be generated end-to-end by SE(3)-E qui variance coordinate head.
分子或口袋的3D预测任务
这些任务需要预测输入的3D构象,例如分子构象生成。与Uni-Mol中使用的快速构象生成方法不同,分子构象生成任务通常需要运行高级采样和半经验密度泛函理论(DFT)来考虑分子可及的3D构象集合,这非常耗时。因此,最近有许多工作训练模型从分子图中快速生成构象[42, 43, 44, 45]。而在Uni-Mol中,该任务直接变成了构象优化任务:基于不同的输入构象生成新构象。具体来说,在微调阶段,模型通过监督学习从Uni-Mol生成的构象到标记构象的映射。此外,优化后的构象可以通过SE(3)-等变坐标头端到端生成。
3D prediction tasks of protein-ligand pairs This is one of the most important tasks in structurebased drug design. The task is to predict the complex structure of a protein binding site and a molecular ligand. Besides the conformation changes of the pocket and the molecule themselves, we also need to consider how the molecule lays in the pocket, that is, the additional 6 degrees (3 rotations and 3 translations) of freedom of a rigid movement. In principle, with Uni-Mol, we can predict the complex conformation by the SE(3)-E qui variant coordinate head in an end-to-end fashion. However, this is unstable as it is very sensitive to the initial docking positions of molecular ligand. Herein, to get rid of the initial positions, we use a scoring function based optimization method in this paper. In particular, the molecular representation and pocket representation are firstly obtained from their own pre training models by their own conformations; then, their representations are concatenated as the input of an additional 4-layer Uni-Mol encoder, which is finetuned to learn the pair distances of all atoms in molecule and pocket. With the predicted pair-distance matrix as the scoring function, we use a simple differential evolution algorithm [46] to sample and optimize the complex conformations. More details can be found in Appendix C.
蛋白质-配体对的3D预测任务
这是基于结构的药物设计中最重要的任务之一。该任务旨在预测蛋白质结合位点与分子配体的复合物结构。除了口袋和分子自身的构象变化外,我们还需考虑分子如何嵌入口袋中,即刚性运动的额外6个自由度(3个旋转和3个平移)。理论上,通过Uni-Mol的SE(3)-等变坐标头,我们可以端到端地预测复合物构象。然而,由于其对分子配体初始对接位置极为敏感,这种方法并不稳定。为此,本文采用基于评分函数的优化方法以消除初始位置的影响。具体而言,首先通过各自构象从预训练模型中获取分子表示和口袋表示;随后,将二者的表示拼接作为额外4层Uni-Mol编码器的输入,该编码器经微调后可学习分子与口袋中所有原子的配对距离。以预测的配对距离矩阵作为评分函数,我们使用简单的差分进化算法[46]对复合物构象进行采样和优化。更多细节见附录C。
3 Experiments
3 实验
To verify the effectiveness of our proposed Uni-Mol model, we conduct extensive experiments on multiple downstream tasks, including molecular property prediction, molecular conformation generation, pocket property prediction, and protein-ligand binding pose prediction. Besides, we also conduct several ablation studies. Due to space restrictions, we leave the detailed experimental settings and ablation studies to Appendix C.
为验证我们提出的Uni-Mol模型的有效性,我们在多个下游任务上进行了广泛实验,包括分子性质预测、分子构象生成、口袋性质预测以及蛋白质-配体结合姿态预测。此外,我们还进行了多项消融研究。由于篇幅限制,详细的实验设置和消融研究见附录C。
3.1 Molecular property prediction
3.1 分子属性预测
Datasets and setup Molecule Net [47] is a widely used benchmark for molecular property prediction, including datasets focusing on different levels of properties of molecules, from quantum mechanics and physical chemistry to biophysics and physiology. Following previous work GEM [13], we use scaffold splitting for the dataset and report the mean and standard deviation of the results for three random seeds.
数据集与实验设置
Molecule Net [47] 是分子属性预测领域广泛使用的基准测试,包含关注分子不同层次属性的数据集,涵盖量子力学、物理化学到生物物理学和生理学等多个维度。沿用GEM [13] 先前工作的设定,我们采用骨架分割(scaffold splitting)处理数据集,并报告三个随机种子结果的平均值和标准差。
Table 1: Uni-Mol performance on molecular property prediction classification tasks
表 1: Uni-Mol在分子性质预测分类任务中的表现
| 数据集 #分子数 #任务数 | BBBP 2039 1 | BACE 1513 1 | ClinTox 1478 2 | Tox21 7831 12 | ToxCast 8575 617 | SIDER 1427 27 | HIV 41127 1 | PCBA 437929 128 | MUV 93087 17 |
|---|---|---|---|---|---|---|---|---|---|
| D-MPNN | 71.0(0.3) | 80.9(0.6) | 90.6(0.6) | 75.9(0.7) | 65.5(0.3) | 57.0(0.7) | 77.1(0.5) | 86.2(0.1) | 78.6(1.4) |
| AttentiveFP | 64.3(1.8) | 78.4(0.022) | 84.7(0.3) | 76.1(0.5) | 63.7(0.2) | 60.6(3.2) | 75.7(1.4) | 80.1(1.4) | 76.6(1.5) |
| N-GramRF | 69.7(0.6) | 77.9(1.5) | 77.5(4.0) | 74.3(0.4) | - | 66.8(0.7) | 77.2(0.1) | - | 76.9(0.7) |
| N-GramxGB | 69.1(0.8) | 79.1(1.3) | 87.5(2.7) | 75.8(0.9) | - | 65.5(0.7) | 78.7(0.4) | - | 74.8(0.2) |
| PretrainGNN | 68.7(1.3) | 84.5(0.7) | 72.6(1.5) | 78.1(0.6) | 65.7(0.6) | 62.7(0.8) | 79.9(0.7) | 86.0(0.1) | 81.3(2.1) |
| GROVERbase | 70.0(0.1) | 82.6(0.7) | 81.2(3.0) | 74.3(0.1) | 65.4(0.4) | 64.8(0.6) | 62.5(0.9) | 76.5(2.1) | 67.3(1.8) |
| GROVERlarge | 69.5(0.1) | 81.0(1.4) | 76.2(3.7) | 73.5(0.1) | 65.3(0.5) | 65.4(0.1) | 68.2(1.1) | 83.0(0.4) | 67.3(1.8) |
| GraphMVP | 72.4(1.6) 72.2(2.1) | 81.2(0.9) | 79.1(2.8) 91.2(3.5) | 75.9(0.5) | 63.1(0.4) | 63.9(1.2) 58.9(1.4) | 77.0(1.2) 78.1(0.5) | - | 77.7(0.6) |
| MolCLR GEM | 72.4(0.4) | 82.4(0.9) 85.6(1.1) | 90.1(1.3) | 75.0(0.2) 78.1(0.1) | 69.2(0.4) | 67.2(0.4) | 80.6(0.9) | 86.6(0.1) | 79.6(1.9) 81.7(0.5) |
| Uni-Mol | 72.9(0.6) | 85.7(0.2) | 91.9(1.8) | 79.6(0.5) | 69.6(0.1) | 65.9(1.3) | 80.8(0.3) | 88.5(0.1) | 82.1(1.3) |
Table 2: Uni-Mol performance on molecular property prediction regression tasks
表 2: Uni-Mol 在分子性质预测回归任务中的表现
| 回归任务 (数值越低越好 ↓) | ||||||
|---|---|---|---|---|---|---|
| RMSE | MAE | |||||
| 数据集 #分子数 | ESOL 1128 | FreeSolv 642 | Lipo 4200 | QM7 6830 | QM8 21786 | QM9 133885 |
| #任务数 | 1 | 1 | 1 | 1 | 12 | 3 |
| D-MPNN | 1.050(0.008) | 2.082(0.082) | 0.683(0.016) | 103.5(8.6) | 0.0190(0.0001) | 0.00814(0.00001) |
| AttentiveFP | 0.877(0.029) | 2.073(0.183) | 0.721(0.001) | 72.0(2.7) | 0.0179(0.001) | 0.00812(0.00001) |
| N-GramRF | 1.074(0.107) | 2.688(0.085) | 0.812(0.028) | 92.8(4.0) | 0.0236(0.0006) | 0.01037(0.00016) |
| N-GramxGB | 1.083(0.082) | 5.061(0.744) | 2.072(0.030) | 81.9(1.9) | 0.0215(0.0005) | 0.00964(0.00031) |
| PretrainGNN | 1.100(0.006) | 2.764(0.002) | 0.739(0.003) | 113.2(0.6) | 0.0200(0.0001) | 0.00922(0.00004) |
| GROVERbase | 0.983(0.090) | 2.176(0.052) | 0.817(0.008) | 94.5(3.8) | 0.0218(0.0004) | 0.00984(0.00055) |
| GROVERlarge | 0.895(0.017) | 2.272(0.051) | 0.823(0.010) | 92.0(0.9) | 0.0224(0.0003) | 0.00986(0.00025) |
| GraphMVP | 1.029(0.033) | 0.681(0.010) | ||||
| MolCLR | 1.271(0.040) | 2.594(0.249) | 0.691(0.004) | 66.8(2.3) | 0.0178(0.0003) | |
| GEM | 0.798(0.029) | 1.877(0.094) | 0.660(0.008) | 58.9(0.8) | 0.0171(0.0001) | 0.00746(0.00001) |
| Uni-Mol | 0.788(0.029) | 1.620(0.035) | 0.603(0.010) | 41.8(0.2) | 0.0156(0.0001) | 0.00467(0.00004) |
Baselines We compare Uni-Mol with multiple baselines, including supervised and pre training baselines. D-MPNN [48] and Attentive FP [49] are supervised GNNs methods. N-gram [50], Pre train GN N [22], GROVER [11], GraphMVP [25], MolCLR [12], and GEM [13] are pre training methods. N-gram embeds the nodes in the graph and assembles them in short walks as the graph representation. Random Forest and XGBoost [51] are used as the predictor for downstream tasks.
基线方法
我们将Uni-Mol与多种基线方法进行比较,包括监督学习和预训练基线。D-MPNN [48]和Attentive FP [49]属于监督式图神经网络(GNN)方法。N-gram [50]、Pre train GNN [22]、GROVER [11]、GraphMVP [25]、MolCLR [12]以及GEM [13]属于预训练方法。其中N-gram通过将图中节点嵌入后,通过短路径组合形成图表征。下游任务预测器采用随机森林和XGBoost [51]。
Results Table 1 and Table 2 show the experiment results of Uni-Mol and competitive baselines, where the best results are marked in bold. Most baseline results are from the paper of GEM, except for the recent works GraphMVP and MolCLR. The results of GraphMVP are from its paper. As MolCLR uses a different data split setting (without considering chirality), we rerun it with the same data split setting as other baselines. From the results, we can summarize them as follows: 1) overall, Uni-Mol outperforms baselines on almost all downstream datasets. 2) In solubility (ESOL, Lipo), free energy (FreeSolv), and quantum mechanical (QM7, QM8, QM9) properties prediction tasks, Uni-Mol is significantly better than baselines. As 3D information is critical in these properties, it indicates that Uni-Mol can learn a better 3D representation than other baselines. 3) Uni-Mol fails to beat SOTA on the SIDER dataset. After investigation, we find Uni-Mol fails to generate 3D conformations (and rollbacks to 2D graphs) for many molecules (like natural products and peptides) in SIDER. Therefore, due to the missing 3D information, it is reasonable that Uni-Mol cannot outperform others.
结果
表1和表2展示了Uni-Mol与竞争基线的实验结果,其中最佳结果以粗体标出。除近期工作GraphMVP和MolCLR外,大多数基线结果来自GEM论文。GraphMVP的结果引自其原论文。由于MolCLR采用不同的数据划分设置(未考虑手性),我们使用与其他基线相同的数据划分重新运行了该模型。从结果中可以总结出以下结论:
- 总体而言,Uni-Mol在几乎所有下游数据集上均优于基线模型。
- 在溶解度(ESOL、Lipo)、自由能(FreeSolv)和量子力学(QM7、QM8、QM9)性质预测任务中,Uni-Mol显著优于基线。由于3D信息对这些性质至关重要,这表明Uni-Mol能学习到比其他基线更优的3D表征。
- Uni-Mol未能在SIDER数据集上超越SOTA。经调查发现,Uni-Mol无法为SIDER中许多分子(如天然产物和肽类)生成3D构象(因而回退至2D图)。因此,由于缺失3D信息,Uni-Mol未能超越其他模型是合理的。
In summary, by better utilizing 3D information in pre training, Uni-Mol outperforms all previous MRL models in almost all property prediction tasks.
总之,通过在预训练中更好地利用3D信息,Uni-Mol在几乎所有属性预测任务上都超越了以往的MRL模型。
Table 3: Uni-Mol performance on molecular conformation generation
表 3: Uni-Mol在分子构象生成任务上的性能表现
| 数据集方法 | QM9 | QM9 | QM9 | QM9 | Drugs | Drugs | Drugs | Drugs |
|---|---|---|---|---|---|---|---|---|
| COV(↑,%) | COV(↑,%) | MAT(↓,A) | MAT(↓,A) | COV(↑,%) | COV(↑,%) | MAT(↓,A) | MAT(↓,A) | |
| 均值 | 中位数 | 均值 | 中位数 | 均值 | 中位数 | 均值 | 中位数 | |
| RDKit | 83.26 | 90.78 | 0.3447 | 0.2935 | 60.91 | 65.70 | 1.2026 | 1.1252 |
| CVGAE | 0.09 | 0.00 | 1.6713 | 1.6088 | 0.00 | 0.00 | 3.0702 | 2.9937 |
| GraphDG | 73.33 | 84.21 | 0.4245 | 0.3973 | 8.27 | 0.00 | 1.9722 | 1.9845 |
| CGCF | 78.05 | 82.48 | 0.4219 | 0.3900 | 53.96 | 57.06 | 1.2487 | 1.2247 |
| ConfVAE | 80.42 | 85.31 | 0.4066 | 0.3891 | 53.14 | 53.98 | 1.2392 | 1.2447 |
| ConfGF | 88.49 | 94.13 | 0.2673 | 0.2685 | 62.15 | 70.93 | 1.1629 | 1.1596 |
| GeoMol | 71.26 | 72.00 | 0.3731 | 0.3731 | 67.16 | 71.71 | 1.0875 | 1.0586 |
| DGSM | 91.49 | 95.92 | 0.2139 | 0.2137 | 78.73 | 94.39 | 1.0154 | 0.9980 |
| DMCG | 96.34 | 99.53 | 0.2065 | 0.2003 | 96.69 | 100.00 | 0.7223 | 0.7236 |
| GeoDiff | 91.68 | 95.82 | 0.2099 | 0.2026 | 89.13 | 97.88 | 0.8629 | 0.8529 |
| Uni-Mol | 98.68 | 100.00 | 0.1806 | 0.1510 | 92.69 | 100.00 | 0.6596 | 0.6215 |
3.2 Molecular conformation generation
3.2 分子构象生成
Datasets and setup Following the settings in previous works [43, 52], we use GEOM-QM9 and GEOM-Drugs [53] dataset to perform conformation generation experiments. As described in Sec. 2.3, in this task, Uni-Mol optimizes its generative conformations to the labeled ones. To construct the finetuning data, we first randomly generate 10 conformations. Then, for each of them, we calculate the RMSD between it and labeled conformations, and choose the one with minimal RMSD as its optimizing target. For the inference in the test set, we generate the same number of conformations (twice the number of labeled conformations) as previous works do. And we use the same metrics, Coverage (COV) and Matching (MAT). Higher COV means better diversity, while lower MAT means higher accuracy.
数据集与设置
遵循先前工作 [43, 52] 的设置,我们使用 GEOM-QM9 和 GEOM-Drugs [53] 数据集进行构象生成实验。如第 2.3 节所述,在此任务中,Uni-Mol 将其生成的构象优化至标注构象。为构建微调数据,我们首先生成 10 个随机构象,随后计算每个生成构象与标注构象之间的 RMSD (均方根偏差),并选择 RMSD 最小的标注构象作为优化目标。在测试集推理阶段,我们与先前工作保持一致,生成相同数量的构象(标注构象数量的两倍)。我们采用相同的评估指标:覆盖率 (COV) 和匹配度 (MAT)。COV 值越高表示多样性越好,而 MAT 值越低则表明精度越高。
Baselines We compare Uni-Mol with 10 competitive baselines. RDKit [37] is a traditional conformation generation method based on distance geometry. The rest baseline can be categorized into two classes. GraphDG [42], CGCF[43], ConfVAE [54], ConfGF [52], and DGSM [55] combine generative models with distance geometry, which first generates inter atomic distance matrices and then iterative ly generates atomic coordinates. CVGAE [44], GeoMol [45], DMCG [56], and GeoDiff [57] directly generate atomic coordinates.
基线方法
我们将Uni-Mol与10个具有竞争力的基线方法进行比较。RDKit [37]是一种基于距离几何的传统构象生成方法。其余基线可分为两类:GraphDG [42]、CGCF [43]、ConfVAE [54]、ConfGF [52]和DGSM [55]将生成式模型与距离几何结合,首先生成原子间距离矩阵,再迭代生成原子坐标;CVGAE [44]、GeoMol [45]、DMCG [56]和GeoDiff [57]则直接生成原子坐标。
Results The results are shown in Table 3. We report the mean and median of COV and MAT on GEOM-QM9 and GEOM-Drugs datasets. ConfVAE [54], GeoMol[45], DGSM [55], DMCG [56], GeoDiff’s [57] results are from their papers, respectively. Other baseline results are from ConfGF’s paper. As shown in Table 3, Uni-Mol exceeds existing baselines in both COV and MAT metrics on both datasets. Although Uni-Mol outperforms SOTA, we suspect that the above benchmark cannot satisfy the real-world demand of conformation generation tasks in the field of drug design. Since the ensemble of molecular conformations in biological systems is different from that in a vacuum or general solution environment, the ensemble of bioactive conformation must be considered in order to apply the conformation generation model in the context of drug design, while the GEOM dataset just ignores this. Establishing a reasonable benchmark will be crucial in this research direction.
结果
结果如表 3 所示。我们报告了 GEOM-QM9 和 GEOM-Drugs 数据集上 COV 和 MAT 的均值和中位数。ConfVAE [54]、GeoMol [45]、DGSM [55]、DMCG [56]、GeoDiff [57] 的结果分别来自它们的论文。其他基线结果来自 ConfGF 的论文。如表 3 所示,Uni-Mol 在两个数据集的 COV 和 MAT 指标上均超过了现有基线。尽管 Uni-Mol 优于 SOTA (State-of-the-Art) ,但我们怀疑上述基准无法满足药物设计领域中构象生成任务的真实需求。由于生物系统中分子构象的集合与真空或一般溶液环境中的不同,为了在药物设计背景下应用构象生成模型,必须考虑生物活性构象的集合,而 GEOM 数据集恰恰忽略了这一点。建立一个合理的基准对这一研究方向至关重要。
3.3 Pocket property prediction
3.3 口袋属性预测
Datasets and setup Drug g ability, the ability of a candidate protein pocket to produce stable binding to a specific molecular ligand, is one of the most critical properties of a candidate protein pocket. However, this task is very challenging due to the very limited supervised data. For example, NRDLD [58], a commonly used dataset, only contains 113 data samples. Therefore, besides NRDLD, we construct a regression dataset for benchmarking pocket property prediction performance. Specifically, based on Fpocket tool, we calculate Fpocket Score, Drug g ability Score, Total SASA, and Hydrophobic it y Score for the selected 164,586 candidate pockets. Model is trained to predict these scores. To avoid leaking, the selected pockets are not overlapped with the candidate protein pocket dataset used in Uni-Mol pre training.
数据集与实验设置
药物结合能力(Drugability)是指候选蛋白质口袋与特定分子配体产生稳定结合的能力,这是候选蛋白质口袋最关键的特性之一。然而由于监督数据极其有限,这项任务极具挑战性。例如常用数据集NRDLD[58]仅包含113个数据样本。因此除NRDLD外,我们构建了一个回归数据集用于评估口袋属性预测性能。具体而言,基于Fpocket工具,我们为筛选出的164,586个候选口袋计算了Fpocket评分、药物结合能力评分、总溶剂可及表面积(SASA)和疏水性评分。模型训练目标为预测这些评分指标。为防止数据泄露,所选口袋与Uni-Mol预训练使用的候选蛋白质口袋数据集无重叠。
Baselines On the NRDLD dataset, we compare Uni-Mol with 6 previous methods evaluated in [59]. Accuracy, recall, precision, and F1-score are used as metrics for this classification task. On our created benchmark dataset, as there are no appropriate baselines, we use an additional Uni-Mol model without pre training, denoted as $\mathrm{Uni-Mol_{random}}$ , to check the performance brought by pre training on pocket property prediction. MSE (mean square error) is used as the metric.
基准方法
在NRDLD数据集上,我们将Uni-Mol与[59]中评估的6种先前方法进行比较。该分类任务采用准确率(Accuracy)、召回率(Recall)、精确率(Precision)和F1分数(F1-score)作为评估指标。在我们创建的基准数据集上,由于缺乏合适的基线方法,我们额外使用了一个未经预训练的Uni-Mol模型(记为$\mathrm{Uni-Mol_{random}}$)来验证预训练对口袋性质预测的性能提升。该任务采用均方误差(MSE)作为评估指标。
Table 4: Uni-Mol performance on pocket property prediction
表 4: Uni-Mol在口袋属性预测上的表现
| Methods | Cavity-DrugScore | Volsite | DrugPred | PockDrug | TRAPP-CNN | Uni-Mol | Methods | Uni-Molrandom | Uni-Mol |
|---|---|---|---|---|---|---|---|---|---|
| Accuracy | 0.82 | 0.89 | 0.89 | 0.865 | 0.946 | 0.946 | 0.621(0.004) | 0.551(0.008) | |
| Recall | 0.957 | 0.913 | 1.000 | MSEFpocket MSEDruggability | 0.601(0.02) | 0.499(0.007) | |||
| Precision | 0.846 | 1.000 | 0.920 | MSETotalSASA | 0.197(0.008) | 0.129(0.005) | |||
| F1-score | 0.898 | 0.955 | 0.958 | MSEHydrophobicity | 0.0357(0.017) | 0.0127(0.0005) |
Results As shown in Table 4, Uni-Mol shows the best accuracy, recall, and F1-score on NRDLD, the few-show dataset. In our created benchmark dataset, the pre training Uni-Mol model largely outperforms the non-pre training one on all four scores. This indicates that pre training on candidate protein pockets indeed brings improvement in pocket property prediction tasks.
结果
如表 4 所示,Uni-Mol 在少样本数据集 NRDLD 上表现出最佳的准确率、召回率和 F1 分数。在我们创建的基准数据集中,经过预训练的 Uni-Mol 模型在四项指标上均大幅优于未预训练的模型。这表明对候选蛋白质口袋进行预训练确实能提升口袋属性预测任务的性能。
Unlike Molecular property prediction, due to the very limited supervised data, pocket property prediction gained much less attention. Therefore, we also plan to release our created benchmark dataset, and hopefully, it can help future research.
与分子属性预测不同,由于监督数据极为有限,口袋属性预测受到的关注要少得多。因此,我们计划发布所创建的基准数据集,希望它能助力未来研究。
3.4 Protein-ligand binding pose prediction
3.4 蛋白质-配体结合构象预测
Datasets and setup As mentioned above, protein-ligand binding pose prediction is one of the most important tasks in drug design. And Uni-Mol combines both the molecular and pocket pre training models to learn a distance matrix based scoring function, and then sample and optimize the complex conformations. For the benchmark dataset, referring to the previous works [27, 60], we use CASF2016 as the test set. For the training data used in finetuning, we use PDBbind General set v.2020 [61] (19,443 protein-ligand complexes), excluding complexes that already exist in the CASF-2016.
数据集与设置
如前所述,蛋白质-配体结合构象预测是药物设计中最重要的任务之一。Uni-Mol结合了分子与口袋预训练模型,通过学习基于距离矩阵的评分函数,进而对复合物构象进行采样与优化。对于基准数据集,参考先前工作[27,60],我们采用CASF2016作为测试集。微调阶段使用的训练数据来自PDBbind General set v.2020[61](包含19,443个蛋白质-配体复合物),并排除了已存在于CASF-2016中的复合物结构。
Two benchmarks are conducted: 1) Docking power, the default metric to benchmark the ability of a scoring function in CASF-2016. Specifically, it tests whether a scoring function can distinguish the ground truth binding pose from a set of decoys or not. For each ground truth, CASF-2016 provides 50 100 decoy conformations of the same ligand. Scoring functions are applied to rank them, and the ground truth binding pose is expected to be the top 1. 2) Binding pose accuracy. Specifically, we use the semi-flexible docking setting: keep the pocket conformation fixed, while the conformation of the ligand is fully flexible. We evaluate the RMSD between the predicted binding pose and the ground truth. Following previous works, we use the percentage of results that are below predefined RMSD thresholds as metrics.
进行了两项基准测试:1) 对接能力 (docking power),这是 CASF-2016 中评估评分函数能力的默认指标。具体而言,它测试评分函数是否能从一组诱饵构象中区分出真实结合构象。对于每个真实构象,CASF-2016 提供了同一配体的 50 至 100 个诱饵构象。评分函数用于对这些构象进行排序,预期真实结合构象应排名第一。2) 结合构象准确性。具体而言,我们采用半柔性对接设置:保持口袋构象固定,而配体构象完全柔性。我们评估预测结合构象与真实构象之间的 RMSD (均方根偏差)。遵循先前工作,我们使用低于预设 RMSD 阈值的结果百分比作为评价指标。
Baselines For docking power benchmark, the baselines are DeepDock [60] and the top 10 scoring functions reported in [27], including both conventional scoring functions and machine learningbased ones. For the binding pose accuracy, the baselines are Autodock Vina [62, 63], Vinardo [64], Smina [65], and AutoDock4 [66].
对接能力基准的基线包括DeepDock [60] 和文献[27]中报告的10个最佳评分函数(包括传统评分函数和基于机器学习的评分函数)。对于结合姿态准确性,基线为Autodock Vina [62, 63]、Vinardo [64]、Smina [65] 和 AutoDock4 [66]。
Results From the docking power benchmark results shown in Figure 3, Uni-Mol ranks the 1st, with the top 1 success rate of $91.6%$ . For comparison, the previous top scoring function AutoDock Vina [62, 63] achieves $90.2%$ of the top 1 success rate in this benchmark. From the binding pose accuracy results shown in Table 5, Uni-Mol also surpasses all other baselines. Notably, Uni-Mol outperforms the second best method by $22.81%$ under the threshold of $2 A$ . This result indicates that Uni-Mol can effectively learn the 3D information from both molecules and pockets, as well as the interaction in 3D space of them. Even without pre training, Uni-Mol (denoted as Uni-Molrandom) is also better than other baselines. This demonstrates the effectiveness of Uni-Mol backbone, as it effectively learns the 3D information by limited data.
从图3所示的对接能力基准测试结果来看,Uni-Mol以91.6%的Top1成功率位列第一。作为对比,此前得分最高的函数AutoDock Vina [62, 63]在该基准测试中Top1成功率为90.2%。根据表5显示的绑定姿态准确度结果,Uni-Mol同样超越了所有其他基线方法。值得注意的是,在2Å阈值下,Uni-Mol比第二名方法高出22.81%。这一结果表明Uni-Mol能有效学习分子与口袋的三维信息,以及它们在三维空间中的相互作用。即使不进行预训练(标记为Uni-Molrandom),Uni-Mol仍优于其他基线方法,这证明了Uni-Mol主干网络通过有限数据有效学习三维信息的能力。
In summary, by combining molecular and pocket pre training models, Uni-Mol significantly outperforms the widely used docking tools in the protein-ligand binding tasks.
总之,通过结合分子和口袋预训练模型,Uni-Mol在蛋白质-配体结合任务中的表现显著优于广泛使用的对接工具。
4 Related work
4 相关工作
Molecular representation learning Representation learning on large-scale unlabeled molecules attracts much attention recently. SMILES-BERT [18] is pretrained on SMILES strings of molecules using BERT [4]. Subsequent works are mostly pre training on 2D molecular topological graphs [23, 11]. MolCLR [12] applies data augmentation to molecular graphs at both node and graph levels, using a self-supervised contrastive learning strategy to learn molecular representations. Further, several recent works try to leverage the 3D spatial information of molecules, and focus on contrastive or transfer learning between 2D topology and 3D geometry of molecules. For example, GraphMVP [25] proposes a contrastive learning GNN-based framework between 2D topology and 3D geometry. GEM [13] uses bond angles and bond length as additional edge attributes to enhance 3D information. As aforementioned, due to the inability of handling 3D information, most previous representation learning models cannot be used in the important 3D prediction tasks.
分子表征学习
近年来,大规模无标记分子的表征学习备受关注。SMILES-BERT [18] 使用 BERT [4] 对分子的 SMILES 字符串进行预训练。后续工作大多基于二维分子拓扑图进行预训练 [23, 11]。MolCLR [12] 在节点和图级别对分子图进行数据增强,采用自监督对比学习策略学习分子表征。此外,近期多项研究尝试利用分子的三维空间信息,专注于分子二维拓扑与三维几何间的对比或迁移学习。例如,GraphMVP [25] 提出了基于 GNN 的二维拓扑与三维几何对比学习框架。GEM [13] 通过键角和键长作为附加边属性来增强三维信息。如前所述,由于无法处理三维信息,大多数现有表征学习模型无法应用于重要的三维预测任务。
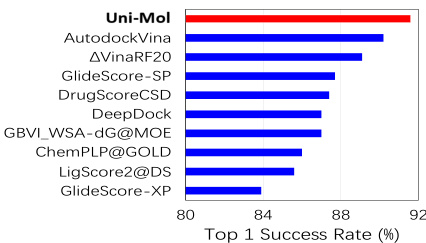
Figure 3: Docking power evaluation on CASF-2016 (Top 10 methods)
图 3: CASF-2016对接能力评估 (Top 10方法)
Table 5: Uni-Mol performance on binding pose prediction
表 5: Uni-Mol在结合构象预测中的表现
| 方法 | 0.5Å 1.0Å 1.5Å 2.0Å 3.0Å 5.0Å |
|---|---|
| AutodockVina Vinardo | 23.86 44.21 57.54 64.56 73.68 84.56 |
| Smina | 23.51 41.75 57.54 62.81 69.82 76.84 |
| Autodock4 | 7.02 21.75 31.58 35.44 47.02 64.56 |
| Uni-Mol随机 | 14.04 49.47 65.26 75.44 87.02 98.60 |
SE(3)-E qui variant models In many-body scenarios such as potential energy surface fitting, SE-(3) e qui variance is usually required. A series of SE(3) models are proposed, such as SchNet [67], tensor field networks [68], SE(3) Transformer [69], DimmNet [70], e qui variant graph neural networks (EGNN) [35], and GemNet [71]. Most of these models are used in supervised learning with energy and force. In Uni-Mol, based on the standard Transformer, we introduce several minor changes to make the model SE(3)-E qui variant.
SE(3)等变模型
在多体场景(如势能面拟合)中,通常需要满足SE(3)等变性。目前已提出SchNet [67]、张量场网络 [68]、SE(3) Transformer [69]、DimmNet [70]、等变图神经网络(EGNN) [35] 和GemNet [71]等一系列SE(3)模型。这些模型大多用于能量和力的监督学习。在Uni-Mol中,我们基于标准Transformer架构进行了若干微调,使模型具备SE(3)等变性。
Pocket drug g ability prediction Drug g ability prediction of protein binding pockets is crucial for drug discovery as druggable pockets need to be identified at the beginning. Since proteins undergo conformation changes that might alter the drug g ability of pockets, it is necessary to utilize 3D spatial data beyond sequential information. Early methods, such as Volsite [72], DrugPred [58], and PockDrug [73], predict drug g ability based on the predefined descriptors of pockets’ static structures. Later, TRAPP-CNN [59], based on 3D-CNN, proposes the analysis of proteins’ conformation changes and the use of such information for drug g ability prediction.
口袋成药性预测
蛋白质结合口袋的成药性预测在药物发现中至关重要,因为需要在初期识别可成药口袋。由于蛋白质会发生构象变化从而可能改变口袋的成药性,因此必须利用序列信息之外的3D空间数据。早期方法(如Volsite [72]、DrugPred [58]和PockDrug [73])基于口袋静态结构的预定义描述符预测成药性。随后,基于3D-CNN的TRAPP-CNN [59]提出分析蛋白质构象变化,并利用此类信息进行成药性预测。
Protein-ligand binding pose prediction In structure-based drug design, it is crucial to understand the interactions between protein targets and ligands. The in vitro estimation of the binding pose and affinity, such as docking, allows for lead identification and guides molecular optimization. In particular, docking is one of the most important approaches in structure-based drug design and has been developed for the past decades. Tools such as AutoDock4 [66], AutoDock Vina [62, 63], and Smina [65] are among the most used docking programs. Also, machine learning-based docking methods, such as $\Delta_{V i n a}\mathrm{RF_{20}}$ [74] and DeepDock [60], have also been developed to predict protein-ligand binding poses and assess protein-ligand binding affinity.
蛋白质-配体结合构象预测
在基于结构的药物设计中,理解蛋白质靶点与配体之间的相互作用至关重要。通过体外评估结合构象和亲和力(如分子对接),可以实现先导化合物的识别并指导分子优化。其中,分子对接是基于结构药物设计中最重要的方法之一,过去几十年间已得到长足发展。AutoDock4 [66]、AutoDock Vina [62, 63] 和 Smina [65] 等工具是最常用的对接程序。此外,基于机器学习的对接方法(如 $\Delta_{V i n a}\mathrm{RF_{20}}$ [74] 和 DeepDock [60])也已被开发用于预测蛋白质-配体结合构象及评估结合亲和力。
5 Conclusion
5 结论
In this paper, to enlarge the application scope and representation ability of molecular representation learning (MRL), we propose Uni-Mol, the first universal large-scale 3D MRL framework. Uni-Mol consists of 3 parts: a Transformer based backbone to handle 3D data; two large-scale pre training models to learn molecular and pocket representations respectively; finetuning strategies for all kinds of downstream tasks. Experiments demonstrate that Uni-Mol can outperform existing SOTA in various downstream tasks, especially in 3D spatial tasks.
本文中,为扩大分子表示学习(MRL)的应用范围和表征能力,我们提出了首个通用大规模3D MRL框架Uni-Mol。该框架包含三部分:基于Transformer的主干网络处理3D数据;两个分别学习分子与口袋表示的大规模预训练模型;适用于各类下游任务的微调策略。实验表明,Uni-Mol在多种下游任务(尤其是3D空间任务)中均能超越现有SOTA方法。
There are 3 potential future directions. 1) Better interaction mechanisms for finetuning two pre training models together. As the interaction between the pre training pocket model and the pre training molecular model is simple in the current version of Uni-Mol, we believe there is a large room for further improvement. 2) Large Uni-Mol models. As larger pre training models often perform better, it is worthy of training a large Uni-Mol model on a bigger dataset. 3) More high-quality benchmarks. Although there have been many applications in the field of drug design, high-quality public datasets have been lacking. Many public datasets cannot satisfy real-world demand due to the low data quality. We believe the high-quality benchmarks will be the lighthouse of the entire field, and will significantly accelerate the development of drug design.
未来有3个潜在发展方向。
- 开发更好的联合微调双预训练模型的交互机制。当前Uni-Mol版本中口袋预训练模型与分子预训练模型的交互较为简单,我们认为存在巨大改进空间。
- 大型Uni-Mol模型。由于更大规模的预训练模型通常表现更优,值得在更大数据集上训练大型Uni-Mol模型。
- 更多高质量基准测试。尽管药物设计领域已有诸多应用,但始终缺乏高质量的公开数据集。许多公共数据集因质量低下无法满足实际需求。我们相信高质量基准将成为整个领域的灯塔,并将显著加速药物设计的发展。
Acknowledgments and Disclosure of Funding
致谢与资金披露
We thank Shuqi Lu, Yuanqi Du, Zhen Wang, Yingze Wang, Xi Chen, Zhengdan Zhu and many colleagues in DP Technology for their great help in this project.
我们感谢Shuqi Lu、Yuanqi Du、Zhen Wang、Yingze Wang、Xi Chen、Zhengdan Zhu以及深度求索(DP Technology)的众多同事对本项目的鼎力相助。
3D structures in Fig. 1 are drawn using the web service Hermite™(https://hermite.dp.tech).
图 1 中的 3D 结构是使用 Hermite™(https://hermite.dp.tech) 网络服务绘制的。
References
参考文献
A Pre training data
预训练数据
Molecular dataset The pre training datasets we use consist of two parts: one part is a database collection of 12 million molecules that can be synthesized and purchased (See Table 6), and the other part is taken from a previous work [23], whose molecules are collected from the ZINC [75] and ChemBL [76] databases. After normalizing and duplicating, we obtain 19 million molecules as our pre training dataset. For each molecule, we add random conformer augmentations with ten 3D conformers generated by RDKit and one 2D graph to avoid ETKDG patterns missing match.
分子数据集
我们使用的预训练数据集由两部分组成:一部分是可合成和购买的1200万分子数据库集合(见表6),另一部分取自先前的工作[23],其分子收集自ZINC[75]和ChemBL[76]数据库。经过归一化和去重后,我们获得了1900万分子作为预训练数据集。对于每个分子,我们通过RDKit生成十个3D构象和一个2D图进行随机构象增强,以避免ETKDG模式缺失匹配。
Candidate protein pocket dataset The pre training dataset for candidate protein pockets is derived from the Protein Data Bank (RCSB PDB 4) [40], a collection of 180K structural data of proteins. We first pre-process the raw data by adding missing side chains and hydrogen atoms, and then we use Fpocket [41] to detect candidate binding pockets of the proteins. After filtering the raw pockets by the number of residues they have contact with (10~25) and including water molecules inside the pockets, we collect a pre training dataset of 3,291,739 candidate pockets.
候选蛋白口袋数据集
候选蛋白口袋的预训练数据集来源于蛋白质数据库(RCSB PDB 4)[40],该数据库包含18万条蛋白质结构数据。我们首先通过添加缺失的侧链和氢原子对原始数据进行预处理,然后使用Fpocket[41]检测蛋白质的候选结合口袋。通过筛选与残基接触数量(10~25)的原始口袋并保留口袋内的水分子后,我们收集了包含3,291,739个候选口袋的预训练数据集。
B Downstream data supplements
B 下游数据补充
Molecular property prediction We conduct experiments on the Molecule Net[47] benchmark in the molecular property prediction task. Molecule Net is a widely used benchmark for molecular property prediction. The details of the 15 datasets we used are described below.
分子属性预测
我们在分子属性预测任务中基于MoleculeNet[47]基准开展实验。MoleculeNet是分子属性预测领域广泛使用的基准测试集。下文详述了我们采用的15个数据集的具体信息。
Table 6: Database collection of 12M purchasable molecules
表 6: 1200万可购买分子的数据库收集
| 数据库 | 分子数量 | 链接 |
|---|---|---|
| Targetmol | 10,000 | https://www.targetmol.com/ |
| Chemdiv | 1,613,931 | https://www.chemdiv.com/ |
| Enamine | 2,734,581 | https://enamine.net/ |
| Chembridge | 1,557,942 | https://www.chembridge.com/ |
| Life Chemical | 509,975 | https://lifechemicals.com/ |
| Specs | 208,670 | https://www.specs.net/ |
| Vitas-M | 1,409,339 | https://vitasmlab.biz/ |
| InterBioScreen | 48,627 | https://www.ibscreen.com/ |
| Maybridge | 53,352 | https://www.thermofisher.in/ |
| Bionet-Key Organics | 259,244 | https://www.keyorganics.net/ |
| Asinex | 530,881 | https://www.asinex.com/ |
| UkrOrgSynthesis | 688,952 | https://uorsy.com/ |
| Eximed | 61,009 | https://eximedlab.com/ |
| HTSBiochemieInnovationen | 58,437 | https://www.hts-biochemie.de/ |
| PrincetonBioMolecular | 1,532,542 | https://princetonbio.com/ |
| Otava | 270,835 | https://otavachemicals.com/ |
| Alinda Chemical | 202,332 | https://www.alinda.ru/ |
| Analyticon | 42,664 | https://www.analyticon-diagnostics.com/ |
Molecular cor formation generation Following the settings in previous works [43, 52], we use GEOM-QM9 and GEOM-Drugs [53] dataset in this task.
分子构象生成
按照先前工作[43, 52]的设置,我们在本任务中使用GEOM-QM9和GEOM-Drugs[53]数据集。
• GEOM This dataset contains 37 million accurate conformations generated for 450,000 molecules by advanced sampling and semi-empirical density flooding theory (DFT). Of these, 133,000 molecules are from QM9, and the remaining 317,000 molecules have bio physical, physiological, or physical chemistry experimental data, i.e., Drugs.
• GEOM 该数据集包含通过高级采样和半经验密度泛函理论 (DFT) 为45万分子生成的3700万个精确构象。其中13.3万分子来自QM9数据集,其余31.7万分子具有生物物理、生理或物理化学实验数据(即药物分子)。
Pocket property prediction NRDLD [58] is a benchmark dataset for pocket drug g ability prediction. As NRDLD and other existing benchmark datasets are too small, we construct a regression dataset to benchmark pocket property prediction performance.
口袋属性预测 NRDLD [58] 是一个用于评估口袋药物结合能力的基准数据集。由于 NRDLD 和其他现有基准数据集规模过小,我们构建了一个回归数据集来评估口袋属性预测性能。
• NRDLD NRDLD contains 113 proteins, and a predefined split is provided: 76 proteins constitute the training set and 37 proteins constitute the test set. It labels 71 proteins as druggable in that they non covalently bind small drug-like ligands [59]. The rest 42 proteins are labeled as less-druggable because none of the ligands they co crystallized satisfy the following requirements simultaneously: the rule of five, $\mathrm{clogP}\ge-2$ , and ligand efficiency, as defined in [28], $\geq0.3\mathrm{kcal}\mathrm{mol}^{-1}$ / heavy atom.
• NRDLD
NRDLD包含113种蛋白质,并提供了预定义的分割:76种蛋白质构成训练集,37种蛋白质构成测试集。其中71种蛋白质被标记为可成药 (druggable),因为它们非共价结合小分子类药物配体 [59]。其余42种蛋白质被标记为较难成药 (less-druggable),原因是它们共结晶的配体均不同时满足以下要求:类药五规则 (rule of five)、$\mathrm{clogP}\ge-2$,以及如[28]所定义的配体效率 (ligand efficiency) $\geq0.3\mathrm{kcal}\mathrm{mol}^{-1}$/重原子。
• Our created benchmark dataset The dataset contains 164,586 candidate pockets, and Fpocket scores each one of them on Fpocket Score, Drug g ability Score, Total SASA, and Hydrophobic it y Score. These four scores are indicators of the drug g ability of candidate pockets. To avoid leaking, the selected pockets are not overlapped with the candidate protein pocket dataset used in Uni-Mol pre training.
• 我们创建的基准数据集
该数据集包含164,586个候选口袋( pocket ),Fpocket对每个口袋的Fpocket Score、Drugability Score、Total SASA和Hydrophobicity Score进行评分。这四项分数是候选口袋成药性(drugability)的指标。为避免数据泄露,所选口袋与Uni-Mol预训练使用的候选蛋白质口袋数据集无重叠。
Protein-ligand binding pose prediction We use PDBbind General set v.2020 [61], excluding the complexes in CASF-2016 [27], as the training set. And CASF-2016 is used as the test set. In particular, we define the pocket for each protein-ligand pair as residues of the protein which have at least one atom within the range of $6A$ from a heavy atom in the ligand. All atoms of the selected residues are included. In addition, we draw the smallest bounding box covering all of the atoms in the pocket and regard the water molecules in the bounding box as a part of the pockets, too.
蛋白质-配体结合姿态预测
我们使用PDBbind通用集v.2020 [61](排除CASF-2016 [27]中的复合物)作为训练集,并以CASF-2016作为测试集。具体而言,我们将每个蛋白质-配体对的结合口袋定义为:蛋白质中至少有一个原子与配体重原子距离在$6A$范围内的残基,所选残基的所有原子均被包含。此外,我们绘制覆盖口袋中所有原子的最小边界框,并将边界框内的水分子也视为口袋的一部分。
• PDBbind General set v.2020 This dataset contains 19,443 protein-ligand complexes with binding data and processed structural files originally from the Protein Data Bank (PDB). Only complexes with experimentally determined binding affinity data are included in the general set.
• PDBbind通用数据集v.2020 该数据集包含19,443个具有结合数据和经过处理的结构文件的蛋白质-配体复合物,原始数据来自蛋白质数据库(PDB)。通用集中仅包含具有实验测定结合亲和力数据的复合物。
• CASF-2016 CASF-2016 is the widely used benchmark for docking and scoring. This dataset, whose primary test set is known as the PDBbind Core set, contains 285 protein-ligand complexes with high quality crystal structures and reliable binding constants from PDBbind General set. For each protein-ligand complex, CASF-2016 provides 50~100 decoy molecular conformations of the same ligand for evaluation.
• CASF-2016
CASF-2016是广泛使用的分子对接与评分基准测试集。该数据集的核心测试集称为PDBbind Core集,包含285个蛋白质-配体复合物,这些复合物均来自PDBbind General集,具有高质量晶体结构和可靠结合常数。针对每个蛋白质-配体复合物,CASF-2016提供50~100个相同配体的诱骗分子构象用于评估。
Table 7: Uni-Mol hyper parameters setup during pre-training
表 7: Uni-Mol 预训练阶段的超参数设置
| 超参数 | 分子预训练 | 口袋预训练 |
|---|---|---|
| 层数 | 15 | 15 |
| 峰值学习率 | 1e-4 | 1e-4 |
| 批量大小 | 128 | 128 |
| 最大训练步数 | 1M | 1M |
| 预热步数 | 10K | 10k |
| 注意力头数 | 64 | 64 |
| FFN丢弃率 | 0.1 | 0.1 |
| 注意力丢弃率 | 0.1 | 0.1 |
| 嵌入丢弃率 | 0.1 | 0.1 |
| 权重衰减 | 1e-4 | 1e-4 |
| 嵌入维度 | 512 | 512 |
| FFN隐藏维度 | 2048 | 2048 |
| 高斯核通道数 | 128 | 128 |
| 掩码比例 | 0.15 | 0.15 |
| 坐标噪声 | 均匀分布 [-1 A, 1 A] | 均匀分布 [-1 A, 1 A] |
| 激活函数 | GELU | GELU |
| 学习率衰减 | 线性 | 线性 |
| Adams E | 1e-6 | 1e-6 |
| Adams (β1, β2) | (0.9, 0.99) | (0.9, 0.99) |
| 梯度裁剪范数 | 1.0 | 1.0 |
| 原子损失函数及其权重 | 交叉熵, 1.0 | 交叉熵, 1.0 |
| 坐标损失函数及其权重 | Smooth L1, 5.0 | Smooth L1, 1.0 |
| 距离损失函数及其权重 | Smooth L1, 10.0 | Smooth L1, 1.0 |
| 最大原子数 | 256 | 256 |
| 词汇表大小 (原子类型) | 30 | 9 |
C Experiments details & reproduce
C 实验细节与复现
Molecular Pre training setup We report the detailed hyper parameters setup of Uni-mol during pre training in Table 7. Uni-Mol training loss is summed up by three components, atom(token) loss, coordinate loss, and pair-distance loss. Atoms are masked, and noise is added to coordinate as described in sections 2.1 and 2.2. Since the values of the above three components differ significantly, to make them have a similar influence, we enlarge the coordinate loss and distance loss.
分子预训练设置
我们在表7中报告了Uni-mol预训练的详细超参数设置。Uni-Mol的训练损失由三部分组成:原子(token)损失、坐标损失和原子对距离损失。如2.1和2.2节所述,我们对原子进行掩码处理并向坐标添加噪声。由于上述三个分量的数值差异较大,为了使它们具有相似的影响,我们放大了坐标损失和距离损失。
Pocket Pre training setup The pocket Uni-Mol model is slightly different from molecule ones during pre training: 1) We use a residue-level masking strategy instead of the original atom-level, as residue granularity is non-redundancy and integrity in protein. 2) Only polar hydrogen is remained in pocket Uni-Mol pre training, to reduce the number of used atoms and thus improve efficiency. 3) All weights of loss functions are set 1, as the residue-level masking strategy makes the 3D denoising task much harder. Other settings are listed in Table 7.
口袋预训练设置
口袋Uni-Mol模型在预训练阶段与分子模型略有不同:
- 采用残基级(residue-level)掩蔽策略替代原子级掩蔽,因为残基粒度在蛋白质中具有非冗余性和完整性。
- 口袋Uni-Mol预训练仅保留极性氢原子,以减少原子数量从而提升效率。
- 所有损失函数权重设为1,因为残基级掩蔽策略使3D去噪任务难度显著增加。其他设置如 表7 所示。
表7:
Molecular property prediction
分子性质预测
• Data split In our experiments, referring to previous work GEM[13], we use scaffold splitting[79] to divide the dataset into training, validation, and test sets in the ratio of 8:1:1. Scaffold splitting is more challenging than random splitting as the scaffold sets of molecules in different subsets do not intersect. This splitting tests the model’s generalization ability and reflects the realistic cases[47]. Since this splitting is according to the scaffold of the molecule, we find that whether or not chirality is considered when generating the scaffold using RDKit has a significant impact on the division results. From the results, the splitting considering chirality makes the task harder. The original implementation of MolCLR does not consider chirality, and we reproduce the experiment by considering it. In all experiments, we choose the checkpoint with the best validation loss, and report the results on the test-set run by that checkpoint.
• 数据划分 在我们的实验中,参考先前工作GEM[13],我们使用骨架划分[79]将数据集按8:1:1的比例分为训练集、验证集和测试集。骨架划分比随机划分更具挑战性,因为不同子集中分子的骨架集合不相交。这种划分方式能测试模型的泛化能力并反映实际情况[47]。由于该划分基于分子骨架,我们发现使用RDKit生成骨架时是否考虑手性对划分结果有显著影响。结果显示,考虑手性的划分会使任务更具挑战性。MolCLR的原始实现未考虑手性,我们通过考虑手性复现了实验。在所有实验中,我们选择验证损失最小的检查点,并报告该检查点在测试集上运行的结果。
Table 8: Search space for small datasets: BBBP, BACE, ClinTox, Tox21, Toxcast, SIDER, ESOL, FreeSolv, Lipo, QM7, QM8, for large datasets: PCBA, MUV, QM9, and for HIV
表 8: 小数据集 (BBBP、BACE、ClinTox、Tox21、Toxcast、SIDER、ESOL、FreeSolv、Lipo、QM7、QM8) 、大数据集 (PCBA、MUV、QM9) 和 HIV 的搜索空间
| 超参数 | 小数据集 | 大数据集 | HIV |
|---|---|---|---|
| 学习率 批量大小 训练轮数 池化丢弃率 | [5e-5,1e-4,4e-4,5e-4] [32,64,128,256] [40,60,80,100] | [2e-5,1e-4] [128,256] [20,40] [0.0,0.1] | [2e-5,5e-5] [128,256] [2,5,10] |
Table 9: Hyper parameters setup for molecular conformation generation
表 9: 分子构象生成的超参数设置
| 学习率 | 批量大小 | 训练轮数 | 预热比例 | 坐标损失函数及权重 | 距离损失函数及权重 |
|---|---|---|---|---|---|
| 1e-4 | 8 | 5 | 0.06 | MSE,1.0 | MSE,1.0 |
• Hyper parameter search space Referring to previous works, we use a grid search to find the best combination of hyper parameters for the molecular property prediction task. To reduce the time cost, we set a smaller search space for the large datasets. The specific search space is shown in Table 8.
• 超参数搜索空间
参考先前工作,我们采用网格搜索为分子属性预测任务寻找最佳超参数组合。为降低时间成本,针对大型数据集设置了较小的搜索空间。具体搜索范围如表 8 所示。
Molecular conformation generation We report the detailed hyper parameters setup for molecular conformation generation in Table 9. Since this is a 3D-related task, we only use coordinate loss and distance loss.
分子构象生成
我们在表 9 中报告了分子构象生成的详细超参数设置。由于这是一个 3D 相关任务,我们仅使用坐标损失 (coordinate loss) 和距离损失 (distance loss)。
Pocket property prediction The hyper parameters we search are listed in Table 10.
口袋属性预测
我们搜索的超参数列于表 10:
Protein-ligand binding pose prediction
蛋白质-配体结合构象预测
• Data split The training set is PDBbind General set v.2020 excluding the complexes covered CASF2016. We perform data preprocessing, such as adding missing atoms to both proteins and ligands and manually fixing file-loading errors, before constructing the training set. And we additionally filter the complexes based on the number of residues contained in the pockets $(>=5$ ), resulting in a training set of 18k protein-ligand complexes. The test set is CASF-2016, which contains 285 protein-ligand complexes.
• 数据划分 训练集为PDBbind General set v.2020中未包含CASF2016复合物的部分。在构建训练集前,我们进行了数据预处理(如为蛋白质和配体补充缺失原子、人工修复文件加载错误等),并基于结合口袋所含残基数 $(>=5$) 进行额外筛选,最终得到18k个蛋白质-配体复合物作为训练集。测试集采用包含285个蛋白质-配体复合物的CASF-2016数据集。
• Binding pose model architecture As shown in Figure 4, the binding pose model is an encoderdecoder architecture consisting of two 15 layers Uni-Mol as encoder and a 4 layers Uni-Mol as decoder. The decoder Uni-Mol block follows the same setting as the pre training ones.
• 结合位姿模型架构 如图 4 所示,结合位姿模型是一个编码器-解码器架构,由两个 15 层的 Uni-Mol 作为编码器和一个 4 层的 Uni-Mol 作为解码器组成。解码器 Uni-Mol 模块遵循与预训练相同的设置。
• Scoring function To evaluate the docking power of our proposed Uni-Mol model, we construct a scoring function, composed of cross distance loss and self-distance loss, out of Uni-Mol. Cross distance loss evaluates the atom-wise distance between atoms on the pocket and ligand, and selfdistance evaluates the atom-wise distance between atoms on the same ligand. The ultimate scoring function is a weighted sum of the cross distance loss and the self-distance loss, and the weights are 1.0 and 5.75 respectively.
• 评分函数
为了评估我们提出的Uni-Mol模型的对接能力,我们基于Uni-Mol构建了一个评分函数,该函数由交叉距离损失和自距离损失组成。交叉距离损失评估口袋(pocket)和配体(ligand)上原子间的距离,自距离损失评估同一配体上原子间的距离。最终的评分函数是交叉距离损失和自距离损失的加权和,权重分别为1.0和5.75。
Table 10: Search space for pocket property prediction
表 10: 口袋属性预测的搜索空间
| 超参数 | NRDLD | Fpocket 分数 |
|---|---|---|
| 学习率 (Learningrate) | [5e-5,1e-4,3e-4] | 3e-4 |
| 批量大小 (Batchsize) | [1,2,4,8,16] | 32 |
| 训练轮数 (Epochs) | 40 | 20 |
| 池化层丢弃率 (Poolerdropout) | [0,0.1,0.2,0.3] | 0 |
| 预热比例 (Warmupratio) | [0.0,0.1] | 0.1 |

Figure 4: protein-ligand binding pose model: 1) Encoder: molecular representation and pocket representation are obtained from their own pre training Uni-Mol models; 2) Decoder: representation is concatenated with atom and pair-level, as inputs of a 4 layers Uni-Mol block learning from scratch. 3) Output: The complex representation is used as a project layer to learn the pair distances of molecule and pocket.
图 4: 蛋白质-配体结合姿态模型: 1) 编码器: 分子表征和口袋表征分别来自预训练的Uni-Mol模型; 2) 解码器: 将表征与原子级和配对级特征拼接,作为4层Uni-Mol模块的输入进行从头学习; 3) 输出: 复合表征作为投影层,用于学习分子与口袋的配对距离。
Table 11: Hyper parameters setup for binding pose prediction
表 11: 结合构象预测的超参数设置
| 微调超参数 | 值 |
|---|---|
| 学习率 批量大小 训练轮数 预热比率 Dropout 距离阈值 交叉距离损失函数及权重 | 3e-4 32 50 0.06 0.2 8.0 |
| 全息距离损失函数及权重 | MSE,1.0 MSE,1.0 |
| 采样超参数 | 值 |
|---|---|
| 种群规模 最大迭代次数 距离阈值 变异率 | 150 500 5.0 (0.5, 1.0) 0.9 |
• Hyper parameter settings
- 超参数设置
As shown in Figure 4, Uni-Mol directly predicts protein-ligand cross distance and self-distance with MSE loss during finetuning. Dist threshold is used to mask distances, since atoms that are more than a certain distance apart do not have interactions that would affect the binding pose. We use 10 randomly generated molecular conformations as data augmentation when sampling. Also, a lower dist threshold is used to reduce variance in sampling with consideration of error in prediction. The details of hyper parameters are shown in Table 11.
如图 4 所示,Uni-Mol 在微调期间直接预测蛋白质-配体交叉距离和自距离,并采用 MSE 损失函数。Dist threshold 用于屏蔽距离,因为相隔超过特定距离的原子不会产生影响结合姿势的相互作用。采样时我们使用 10 个随机生成的分子构象作为数据增强手段。同时,考虑到预测误差,采用更低的距离阈值以减少采样方差。超参数细节见表 11。
• Exhaustive ness search To ensure that the comparison between Uni-Mol and popular molecular docking software is unbiased, we increase the exhaustive ness of the global search (roughly proportional to time) of the molecular docking software to observe the effect of computational complexity to docking power on CASF-2016 benchmark. And we find that when exhaustive ness is above 16, the popular molecular docking software can no longer improve the performance by increasing the computational complexity.
• 穷尽性搜索 为确保Uni-Mol与主流分子对接软件的比较无偏性,我们通过提升分子对接软件的全局搜索穷尽性(与耗时大致成正比)来观察计算复杂度对CASF-2016基准测试中对接效能的影响。研究发现当穷尽性超过16时,主流分子对接软件无法再通过增加计算复杂度来提升性能。
Table 12: Exhaustive ness study of popular docking tools on CASF-2016
表 12: CASF-2016上流行对接工具的详尽性研究
| 方法 | 详尽性 | 0.5 Å 1.0 Å | 1.5 Å | 2.0 Å |
|---|---|---|---|---|
| Autodock Vina | 1 | 21.40 35.79 | 47.02 | 52.28 |
| Autodock Vina | 8 | 23.86 44.21 | 57.54 | 64.56 |
| Autodock Vina | 16 | 25.61 45.96 | 60.70 | 66.67 |
| Autodock Vina | 32 | 25.96 45.96 | 60.00 | 66.32 |
| Vinardo | 1 | 16.84 33.33 | 43.16 | 49.82 |
| Vinardo | 8 | 23.51 41.75 | 57.54 | 62.81 |
| Vinardo | 16 | 23.51 45.26 | 60.70 | 66.67 |
| Vinardo | 32 | 23.86 44.56 | 59.30 | 65.61 |
| Smina | 1 | 23.51 39.65 | 50.53 | 56.14 |
| Smina | 8 | 23.51 47.37 | 59.65 | 65.26 |
| Smina | 16 | 28.77 49.47 | 61.40 | 67.72 |
| Smina | 32 | 28.07 51.23 | 61.75 | 67.37 |
| Autodock4 | 1 | 4.91 18.95 | 26.67 | 28.87 |
| Autodock4 | 8 | 7.02 21.75 | 31.58 | 35.44 |
| Autodock4 | 16 | 6.32 24.56 | 34.04 | 38.95 |
| Autodock4 | 32 | 6.32 23.16 | 34.04 | 38.25 |
| Uni-Mol random | - | 14.04 49.47 | 65.26 | 75.44 |
D Metrics
D Metrics
In the conformation generation task, following previous work [80, 81], we use the Root of Mean Squared Deviations (RMSD) of heavy atoms to evaluate the difference between the generated conformation and the reference one. Before computing RMSD, the generated conformation is first aligned with the reference one, and the function $\Phi$ aligns conformations by applying rotations and translations to them:
在构象生成任务中,沿用先前工作[80, 81]的方法,我们使用重原子均方根偏差(RMSD)来评估生成构象与参考构象之间的差异。在计算RMSD前,需先将生成构象与参考构象通过函数$\Phi$进行对齐,该函数通过旋转和平移操作实现构象对齐:
$$
\mathrm{RMSD}(R,\hat{R})=\operatorname*{min}{\Phi}(\frac{1}{n}\sum_{i=1}^{n}||\Phi({\cal R}{i})-\hat{{\cal R}}_{i}||^{2})^{\frac{1}{2}}
$$
$$
\mathrm{RMSD}(R,\hat{R})=\operatorname*{min}{\Phi}(\frac{1}{n}\sum_{i=1}^{n}||\Phi({\cal R}{i})-\hat{{\cal R}}_{i}||^{2})^{\frac{1}{2}}
$$
where $\pmb{R}$ and $\hat{R}$ are the generated and reference conformation, $i$ is the $i$ -th heavy atom, and $n$ is the number of heavy atoms.
其中 $\pmb{R}$ 和 $\hat{R}$ 分别表示生成构象和参考构象,$i$ 表示第 $i$ 个重原子,$n$ 为重原子总数。
We use Coverage (COV) and Matching (MAT) to evaluate the performance of the conformation generation model. Higher COV means better diversity, while lower MAT means higher accuracy. Formally, COV and MAT are denoted as:
我们使用覆盖率 (COV) 和匹配度 (MAT) 来评估构象生成模型的性能。更高的 COV 意味着更好的多样性,而更低的 MAT 意味着更高的准确性。形式上,COV 和 MAT 表示为:
$$
\mathrm{MAT}(S_{g},S_{r})=\frac{1}{|S_{r}|}\sum_{R\in S_{r}}\operatorname*{min}{\hat{\mathbf{R}}\in S_{g}}\mathrm{RMSD}(R,\hat{R})
$$
$$
\mathrm{MAT}(S_{g},S_{r})=\frac{1}{|S_{r}|}\sum_{R\in S_{r}}\operatorname*{min}{\hat{\mathbf{R}}\in S_{g}}\mathrm{RMSD}(R,\hat{R})
$$
where $S_{g}$ and $S_{r}$ are the set of generated and reference conformations, respectively, and $\delta$ is a given RMSD threshold. Following previous work [43, 52], for GEOM-QM9, the threshold is $0.5A$ , and for GEOM-Drugs, the threshold value is $1.25A$ .
其中 $S_{g}$ 和 $S_{r}$ 分别是生成构象和参考构象的集合,$\delta$ 是给定的 RMSD 阈值。根据先前工作 [43, 52],对于 GEOM-QM9,阈值为 $0.5A$,而对于 GEOM-Drugs,阈值则为 $1.25A$。
E Ablation studies
E 消融研究
We investigate the impact of the pair-type aware affine (PTAA) module on the molecular property prediction tasks. As described in Sec 2.1, in invariant spatial positional encoding, the PTAA is combined with the pair Euclidean distance matrix. Tables 13 and 14 show the results of the ablation studies, and we can find that PTAA largely improves the performance of molecular property prediction. There are several possible reasons: 1) in chemicals (and physics), the interactions between two atoms are determined by their distances and types together. Given pair distance and their types, the model can distinguish different interactions, such as Van der Waals forces, covalent interactions, etc., and thus perform better. 2) PTAA enlarges the capacity of pair representation by introducing more trainable parameters, and therefore, the model learns better pair interactions in 3D space and thus performs better.
我们研究了配对类型感知仿射 (PTAA) 模块对分子性质预测任务的影响。如第2.1节所述,在不变空间位置编码中,PTAA与配对欧氏距离矩阵相结合。表13和表14展示了消融研究的结果,我们可以发现PTAA大幅提升了分子性质预测的性能。可能的原因有几点:1) 在化学(和物理学)中,两个原子之间的相互作用由它们的距离和类型共同决定。给定配对距离及其类型,模型可以区分不同的相互作用,如范德华力、共价相互作用等,从而表现更好。2) PTAA通过引入更多可训练参数扩大了配对表示的容量,因此模型在3D空间中学习了更好的配对相互作用,从而表现更优。
Table 13: Ablation study on pair-type with molecular property prediction classification tasks
表 13: 分子属性预测分类任务中pair-type的消融研究
| 数据集 | BBBP | BACE | ClinTox | Tox21 | ToxCast | SIDER | HIV | PCBA | MUV |
|---|---|---|---|---|---|---|---|---|---|
| 分类(ROC-AUC%, 越高越好↑) | |||||||||
| Uni-Mol w/o pair-type | 66.3(1.7) | 76.2(0.2) | 87.1(2.3) | 72.4(0.1) | 62.3(0.4) | 61.2(1.1) | 75.8(0.5) | 85.1(0.1) | 80.9(0.6) |
| Uni-Mol | 72.9(0.6) | 85.7(0.2) | 91.9(1.8) | 79.6(0.5) | 69.6(0.1) | 65.9(1.3) | 80.8(0.3) | 88.5(0.1) | 82.1(1.3) |
Table 14: Ablation study on pair-type with molecular property prediction regression tasks
表 14: 分子属性预测回归任务中pair-type的消融研究
| 数据集 | QM9 | |||||
|---|---|---|---|---|---|---|
| ESOL | FreeSolv | Lipo | QM7 | QM8 | ||
| Uni-Molw/opair-type Uni-Mol | 0.977(0.007) 0.788(0.029) | 2.053(0.053) 1.620(0.035) | 0.951(0.056) 0.603(0.010) | 45.9(1.7) 41.8(0.2) | 0.0156(0.0001) 0.0156(0.0001) | 0.00473(0.00004) 0.00467(0.00004) |
F Training Stability
F 训练稳定性
With Pre-LayerNorm [30] backbone and mixed-precision training, the pre training sometimes diverges. After investigation, we found there are large numerical values in the intermediate states when divergence happens. We hypothesize that the Final-LayerNorm layer in the Pre-LayerNorm backbone results in the problem. Specifically, Final-LayerNorm is applied to the sum of all encoder layers, denoted as
采用 Pre-LayerNorm [30] 主干结构和混合精度训练时,预训练过程偶尔会出现发散现象。经排查发现,发散发生时中间状态会出现较大数值。我们推测问题根源在于 Pre-LayerNorm 主干结构中的 Final-LayerNorm 层——该层作用于所有编码器层的求和输出(记为
$$
\pmb{o}{i}=\mathrm{LayerNorm}(\pmb{s}{i}),\quad\pmb{s}{i}=\sum_{l=1}^{L}\pmb{o}_{i}^{l}
$$
$$
\pmb{o}{i}=\mathrm{LayerNorm}(\pmb{s}{i}),\quad\pmb{s}{i}=\sum_{l=1}^{L}\pmb{o}_{i}^{l}
$$
where $L$ is the number of layers, $o_{i}^{l}$ is the output of the $i$ -th position in the $l$ -th layer, and $\mathbf{o}{i}$ is the final output of the $i$ -th position, after Final-LayerNorm. Therefore, due to normalization, $s_{i}$ can be arbitrarily large (or arbitrarily small), without affecting model results. However, a too large or too small numerical value will cause the numerical unstable, especially in the mixed-precision training. To tackle this, we introduce a simple loss, to restrict the value range of $s_{i}$ . Formally, the loss is denoted as
其中 $L$ 是层数,$o_{i}^{l}$ 是第 $l$ 层第 $i$ 个位置的输出,$\mathbf{o}{i}$ 是第 $i$ 个位置经过最终层归一化 (Final-LayerNorm) 后的输出。因此,由于归一化的作用,$s_{i}$ 可以任意大(或任意小),而不会影响模型结果。然而,数值过大或过小会导致数值不稳定,尤其是在混合精度训练中。为了解决这个问题,我们引入了一个简单的损失函数来限制 $s_{i}$ 的取值范围。形式上,该损失函数表示为
$$
\mathcal{L}{n o r m}=\mathrm{mean}{i}\left(\mathrm{max}\left(\left|\left|\boldsymbol{s}_{i}\right|-\sqrt{d}\right|-\tau,0\right)\right),
$$
$$
\mathcal{L}{n o r m}=\mathrm{mean}{i}\left(\mathrm{max}\left(\left|\left|\boldsymbol{s}_{i}\right|-\sqrt{d}\right|-\tau,0\right)\right),
$$
where $d$ is the dimension size of $s_{i},\tau$ is the tolerance factor. In Uni-Mol, we set $\tau=1$ , and both atom-level and pair-level representations are constrained by this loss. Besides, to avoid affecting other loss functions, we set a very small loss weight (0.01) to $\mathcal{L}_{n o r m}$ .
其中 $d$ 是 $s_{i}$ 的维度大小,$\tau$ 是容差因子。在 Uni-Mol 中,我们设置 $\tau=1$,原子级和配对级表示都受此损失函数约束。此外,为避免影响其他损失函数,我们为 $\mathcal{L}_{n o r m}$ 设置了极小的损失权重 (0.01)。