AU R-CNN: Encoding Expert Prior Knowledge into R-CNN for Action Unit Detection
AU R-CNN: 将专家先验知识编码到R-CNN中以实现动作单元检测
Abstract
摘要
Detecting action units (AUs) on human faces is challenging because various AUs make subtle facial appearance change over various regions at different scales. Current works have attempted to recognize AUs by emphasizing important regions. However, the incorporation of expert prior knowledge into region definition remains under-exploited, and current AU detection approaches do not use regional convolutional neural networks (R-CNN) with expert prior knowledge to directly focus on AU-related regions adaptively. By incorporating expert prior knowledge, we propose a novel R-CNN based model named AU R-CNN. The proposed solution offers two main contributions: (1) AU R-CNN directly observes different facial regions, where various AUs are located. Specifically, we define an AU partition rule which encodes the expert prior knowledge into the region definition and RoI-level label definition. This design produces considerably better detection performance than existing approaches. (2) We integrate various dynamic models (including convolutional long short-term memory, two stream network, conditional random field, and temporal action localization network) into AU R-CNN and then investigate and analyze the reason behind the performance of dynamic models. Experiment results demonstrate that only static RGB image information and no optical flow-based AU R-CNN surpasses the one fused with dynamic models. AU R-CNN is also superior to traditional CNNs that use the same backbone on varying image resolutions. State-of-the-art recognition performance of AU detection is achieved. The complete network is end-to-end trainable. Experiments on BP4D and DISFA datasets show the effectiveness of our approach. The implementation code is available in https://github.com/sharpstill/AU_R-CNN.
检测人脸动作单元 (Action Units, AUs) 具有挑战性,因为不同动作单元会在多尺度面部区域引发细微的外观变化。现有研究主要通过强调关键区域来识别动作单元,但如何将专家先验知识融入区域定义仍未充分探索,且当前动作单元检测方法尚未结合专家先验知识,通过区域卷积神经网络 (R-CNN) 实现自适应聚焦动作单元相关区域。基于专家先验知识,我们提出新型R-CNN模型AU R-CNN,其核心贡献包括:(1) 直接观测不同动作单元分布的差异化面部区域,通过制定动作单元分区规则将专家先验知识编码至区域定义与兴趣区域 (RoI) 层级标签定义,该设计显著优于现有检测方法;(2) 集成多种动态模型(包括卷积长短期记忆网络、双流网络、条件随机场和时间动作定位网络)并深入分析动态模型的性能成因。实验表明,仅使用静态RGB图像信息且不依赖光流计算的AU R-CNN性能优于融合动态模型的方案,在不同图像分辨率下均优于采用相同骨干网络的传统CNN。该方法实现了动作单元检测的最先进识别性能,完整网络支持端到端训练。BP4D和DISFA数据集上的实验验证了方案有效性,实现代码见https://github.com/sharpstill/AU_R-CNN。
Keywords: Action unit detection, Expert prior knowledge, R-CNN, Facial Action Coding System
关键词:动作单元检测、专家先验知识、R-CNN、面部动作编码系统
1. Introduction
1. 引言
Facial expressions reveal people’s emotions and intentions. Facial Action Coding System (FACS) [1] has defined 44 action units (AUs) related to the movement of specific facial muscles; these units can anatomically represent all possible facial expressions, considering the crucial importance of facial expression analysis. AU detection has been studied for decades and its goal is to recognize and predict AU labels on each frame of the facial expression video. Automatic detection of AUs has a wide range of applications, such as human-machine interfaces, affective computing, and car-driving monitoring.
面部表情能揭示人的情绪和意图。面部动作编码系统 (FACS) [1] 定义了44个与特定面部肌肉运动相关的动作单元 (AUs),这些单元能从解剖学角度表征所有可能的面部表情。考虑到面部表情分析的关键重要性,AU检测技术已历经数十年研究,其目标是对面部表情视频的每一帧进行AU标签识别与预测。自动AU检测在诸多领域具有广泛应用,例如人机交互界面、情感计算 (affective computing) 和驾驶监控系统。
Since the human face may present complex facial expression, and AUs appear in the form of subtle appearance changes on the local regions of face, that current class if i ers cannot easily recognize. This problem is the main obstacle of current AU detection systems. Various approaches focus on fusing with extra information in convolutional neural networks (CNNs), e.g. , the optical flow information [2] or landmark information [3, 4], to help AU detection systems capture such subtle facial expressions. However, these approaches have high detection error rates, due to the lack of using prior knowledge. Human can easily recognize micro facial expression by their long accumulated experience. Hence, integrating the expert prior knowledge of FACS [1] to AU detection system is promising. With fusing of this prior knowledge, our proposed approach addresses the AU detection problem by partitioning the face to easily recognizable AU-related regions, then the prediction of each region is merged to obtain the image-level prediction. Fig. 1 shows our approach’s framework, we design an “AU partition rule” to encode the expert prior knowledge. This AU partition rule decomposes the image into a bunch of AU-related bounding boxes. Then AU R-CNN head module focuses on recognizing each bounding box. This design can well address the three problems of existing approaches.
由于人脸可能呈现复杂的面部表情,而动作单元(AU)以面部局部区域细微外观变化的形式出现,当前分类器难以准确识别。这一问题是现有AU检测系统的主要障碍。现有方法主要通过卷积神经网络(CNN)融合额外信息(如光流信息[2]或面部关键点信息[3,4])来捕捉细微表情变化,但缺乏先验知识利用导致检测错误率较高。人类凭借长期积累的经验能轻松识别微表情,因此将FACS[1]专家先验知识融入AU检测系统具有显著优势。我们提出的方法通过将人脸划分为易识别的AU相关区域,再合并各区域预测结果获得图像级预测。图1展示了我们的框架:设计"AU划分规则"编码专家先验知识,将图像分解为多个AU相关边界框,再由AU R-CNN头部模块专注识别每个边界框。该设计能有效解决现有方法的三个主要问题。
First, existing approaches [3–13] have been proposed to extract features near landmarks (namely, “AU center”), which is trivially defined and leading to emphasize on inaccurate places. AUs occur in regions around specific facial muscles that may be inaccurately located on a landmark or an AU center due to the limitation of the facial muscle’s activity place. Thus, most AUs limit their activities in specific irregular regions of a face, and we call this limitation the “space constraint”. Our approach reviews the FACS and designs the “AU partition rule” to represent this space constraint accurately. This well-designed “AU partition rule” is called the “expert prior knowledge” in our approach which is built on the basis of the space-constraint for regional recognition, so it reduces the detection error rate caused by inaccurate landmark positioning (see experiment Section 4.3.1).
首先,现有方法[3-13]提出在标志点附近(即"AU中心")提取特征,这种定义过于简单,导致关注点集中在不准确的位置。由于面部肌肉活动区域的限制,动作单元(AU)发生在特定面部肌肉周围区域,这些区域可能无法准确定位在某个标志点或AU中心。因此,大多数AU将其活动范围限制在面部特定的不规则区域内,我们将这种限制称为"空间约束"。我们的方法重新审视了FACS系统,并设计了"AU分区规则"来准确表示这种空间约束。这套精心设计的"AU分区规则"在我们的方法中被称为"专家先验知识",它建立在区域识别的空间约束基础上,从而降低了由标志点定位不准确引起的检测错误率(参见实验章节4.3.1)。
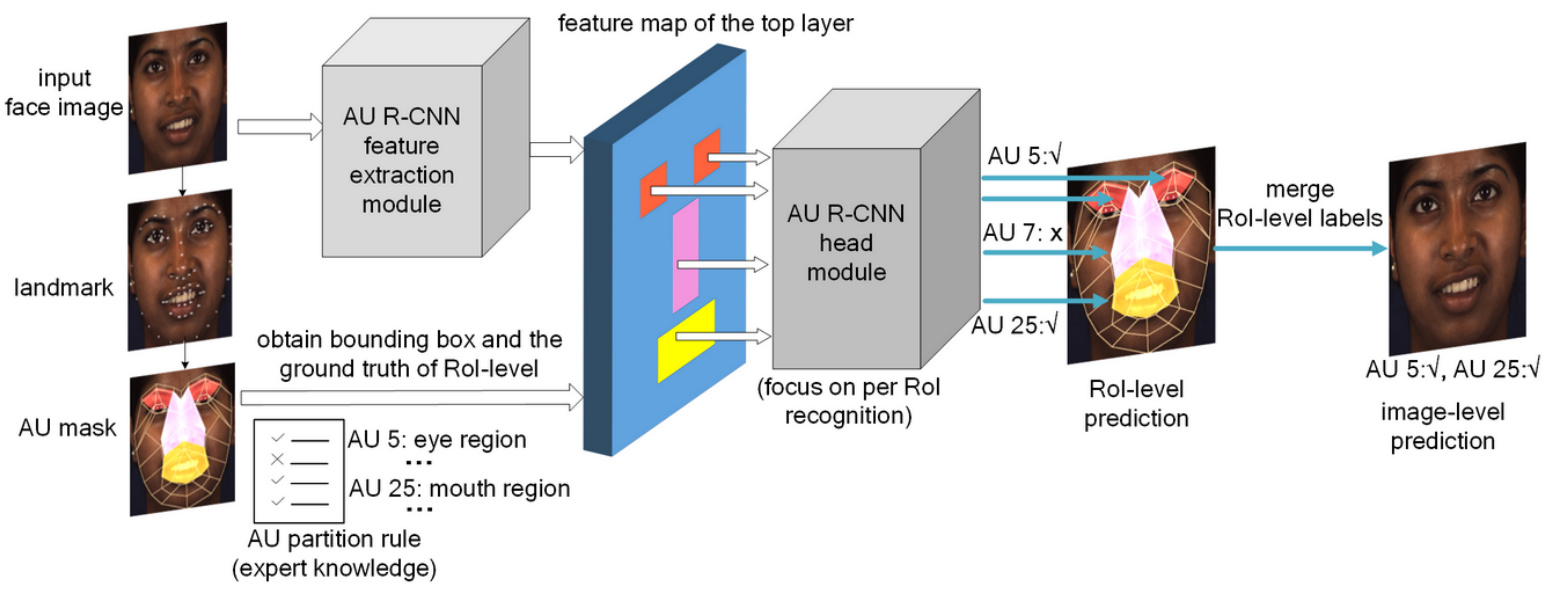
Fig. 1. The overall of AU R-CNN framework. It recognizes each RoI-level’s label based on the AU partition rule, which uses the landmark point location information to encode the expert prior knowledge. This rule indicates the place where the AUs may occur. AU R-CNN head module focuses on recognizing each bounding box to improve performance.
图 1: AU R-CNN框架整体结构。该框架基于AU分区规则识别每个感兴趣区域(RoI)级别的标签,该规则利用关键点位置信息编码专家先验知识。此规则标明了AU可能出现的区域。AU R-CNN头部模块专注于识别每个边界框以提升性能。
Second, existing approaches still use CNNs to recognize a full face image [3, 4, 14, 15] and do not learn to recognize individual region’s labels, which may not use the correct image context to detect. For example, a CNN may use an unreliable context, such as mouth area features, to recognize eye-area-related AUs (e.g. AU 1, AU 2). Recent success in the object detection model of Fast/Faster R-CNN [16, 17] has inspired us to utilize the power of R-CNN based models to learn the accurate regional features of AUs under space constraints. We propose AU R-CNN to detect AUs only from AU-related regions by limiting its vision inside space-constrained areas. In this process, unrelated areas can be excluded to avoid interference, which is key to improve detection accuracy.
其次,现有方法仍使用CNN识别整张人脸图像[3, 4, 14, 15],未学习识别局部区域标签,可能无法利用正确的图像上下文进行检测。例如,CNN可能依赖不可靠的上下文(如嘴部区域特征)来识别眼部相关动作单元(如AU 1、AU 2)。Fast/Faster R-CNN[16, 17]在目标检测模型中的最新成果启发我们:在空间约束条件下,基于R-CNN模型学习动作单元的精确区域特征。我们提出AU R-CNN,通过将视觉范围限制在空间约束区域内,仅从动作单元相关区域进行检测。该过程中可排除无关区域以避免干扰,这是提升检测精度的关键。
Third, the multi-label learning problem in AU detection can be addressed at a fine-grained level under AU-related RoI space constraint. Previous approaches [3, 4, 14] adopt the sigmoid cross-entropy cost function to learn the image-level multi-label and emphasize the important regions, but such a solution is not sufficiently fine-grained. The multi-label relationship can be captured more accurately in the RoI-level supervised information constraint. Most facial muscles can show diverse expres- sions that lead to RoI-level multi-label learning. For example, AU 12 (lip corner puller) is often present in a smile, which may also occur together with AU 10 (upper lip raiser), and deepen the nasolabial fold, as shown in Fig. 2. Therefore, in the definition of the AU partition rule, AUs are grouped by the definition of FACS and related facial muscles. Each AU group shares the same region, and such AU group can be represented by a binary vector with element of 1 if the corresponding AU occurs in the ground truth and 0 otherwise. The sigmoid cross-entropy cost function is adopted in the RoI-level learning. In our experiments, we determine that using RoI-level labels to train and predict and then merging the RoI-level prediction result to that of the image level surpasses the previous approaches.
第三,在AU检测中的多标签学习问题可以在AU相关感兴趣区域(RoI)空间约束下进行细粒度处理。先前的方法[3, 4, 14]采用sigmoid交叉熵损失函数来学习图像级多标签并强调重要区域,但这种解决方案的细粒度程度不足。在RoI级别的监督信息约束下,可以更准确地捕捉多标签关系。大多数面部肌肉能表现出导致RoI级多标签学习的多样化表情。例如,AU 12(嘴角拉伸)常出现在微笑中,也可能与AU 10(上唇提升)同时出现,并加深鼻唇沟,如图2所示。因此,在AU分区规则的定义中,AU根据FACS定义和相关面部肌肉进行分组。每个AU组共享相同区域,这种AU组可以用二进制向量表示,若对应AU在真实标注中出现则元素为1,否则为0。在RoI级别学习中采用sigmoid交叉熵损失函数。我们的实验证明,使用RoI级标签进行训练预测,再将RoI级预测结果合并至图像级别,效果优于先前方法。
Furthermore, we analyze the effects of fusing temporal features into AU R-CNN (dynamic model extension). We conduct complete comparison experiments to investigate the effects of integrating dynamic models, including convolutional long short-term memory (ConvLSTM) [18], two-stream network [19], general graph conditional random field (CRF) model, and TAL-Net [20], into AU R-CNN. We analyze the reason behind such effects and the cases under which the dynamic models are effective. Our AU R-CNN with only static RGB images and no optical flow achieves $63%$ average F1 score on BP4D, and outperforms all dynamic models. The main contributions of our study are as follows.
此外,我们分析了将时序特征融合到AU R-CNN(动态模型扩展)中的效果。我们进行了完整的对比实验,研究将动态模型(包括卷积长短期记忆网络(ConvLSTM) [18]、双流网络[19]、通用图条件随机场(CRF)模型以及TAL-Net [20])集成到AU R-CNN中的效果。我们分析了这些效果背后的原因以及动态模型有效的情况。我们仅使用静态RGB图像且未使用光流的AU R-CNN在BP4D上达到了63%的平均F1分数,并且优于所有动态模型。本研究的主要贡献如下。
(1) AU R-CNN is proposed to learn regional features adaptively by using RoI-level multi-label supervised information. Specifically, we encode the expert prior knowledge by defining the AU partition rule, including the AU groups and related regions, according to FACS [1].
(1) AU R-CNN 提出通过使用 RoI (Region of Interest) 级别的多标签监督信息来自适应学习区域特征。具体而言,我们根据 FACS [1] 定义 AU (Action Unit) 分区规则(包括 AU 组和相关区域)来编码专家先验知识。
(2) We investigate the effects of integrating various dynamic models, including two-stream network, ConvLSTM, CRF model and TAL-Net, in the experiments of BP4D [21] and DISFA [22] databases. The reasons behind such experiment effects and the effective cases are analyzed. The experiment results show that our static RGB image-based AU R-CNN achieves the best average F1 score in BP4D and is close to the performance of the best dynamic model in DISFA. Our approach achieves state-of-the-art performance in AU detection.
(2) 我们在BP4D [21]和DISFA [22]数据库的实验中研究了集成多种动态模型的效果,包括双流网络、ConvLSTM、CRF模型和TAL-Net。分析了这些实验效果背后的原因及有效案例。实验结果表明,我们基于静态RGB图像的AU R-CNN在BP4D中取得了最佳平均F1分数,在DISFA中接近最佳动态模型的性能。我们的方法在AU检测中实现了最先进的性能。
2. Related Work
2. 相关工作
Extensive works on AU detection have been proposed to extract effective facial features. The facial features in AU detection can be grouped into appearance and geometric features. Appearance features portray the local or global changes in facial components. Most popular approaches in this category adopt Haar feature [23], local binary pattern [24], Garbor wavelets [25, 26], and canonical appearance feature [27]. Geometric features represent the salient facial point or skin changing direction or distance. Geometric changes can be measured by optical flows [28] or displacement of facial landmark points [27, 29]. Landmark plays an important role in geometry approaches, and many methods have been proposed to extract features near landmark points [5–12, 30]. Fabian et al. [31] proposed a method that combines geometric changes and local texture information. Wu and Ji [32] investigated the combination of facial AU recognition and facial landmark detection. Zhao et al. [13] proposed joint patch and multi-label learning (JPML) for AU detection with a scale-invariant feature transform descriptor near landmarks. These traditional approaches focus on extracting handcraft features near landmark points. With the recent success of deep learning, CNN has been widely adopted to extract AU features [15]. Zhao et al. [14] proposed a deep region and multi-label learning (DRML) network to divide the face images into $8\times8$ blocks and used individual convolutional kernels to convolve each block. Although this approach treats each face as a group of individual parts, it divides blocks uniformly and does not consider the FACS knowledge, thereby leading to the poor performance. Li et al. [4] proposed Enhancing and Cropping Net (EAC-Net), which intends to give significant attention to individual AU centers. However, this approach defines the AU center trivially and it uses image-level context to learn. Its CNN backbone may use incorrect context to classify and the lack of RoI-level supervised information can only give coarse guidance. Song et al. [33] studied the sparsity and co-occurrence of AUs. Han et al. [15] proposed an Optimized Filter Size CNN (OFS-CNN) to simultaneously learn the filter sizes and weights of all conv-layer. Other related problems, including the effects of dataset size [34], the action detection in videos [35], the pose-based feature of action recognition [36], and generalized multimodal factorized high-order pooling for visual question answering [37] have also been studied. Previous works have mainly focused on landmark-based regions or learning multiple regions with convolutional kernels separately. Detection with the expert prior knowledge and utilizing RoI-level labels are important but have been undervalued in previous methods.
关于动作单元 (AU) 检测的广泛研究已提出多种有效面部特征提取方法。AU检测中的面部特征可分为外观特征和几何特征。外观特征刻画面部组件的局部或全局变化,该类主流方法采用Haar特征 [23]、局部二值模式 [24]、Gabor小波 [25, 26] 和典型外观特征 [27]。几何特征表征显著面部点或皮肤变化方向/距离,可通过光流 [28] 或面部标志点位移 [27, 29] 测量。
标志点在几何方法中具有重要作用,已有大量方法提出在标志点附近提取特征 [5–12, 30]。Fabian等 [31] 提出结合几何变化与局部纹理信息的方法。Wu和Ji [32] 研究了面部AU识别与标志点检测的联合处理。Zhao等 [13] 提出联合区块多标签学习 (JPML) 方法,在标志点附近使用尺度不变特征变换描述符进行AU检测。这些传统方法聚焦于在标志点附近提取手工特征。
随着深度学习的成功,CNN已被广泛用于AU特征提取 [15]。Zhao等 [14] 提出深度区域多标签学习 (DRML) 网络,将人脸图像划分为$8×8$区块并用独立卷积核处理每个区块。虽然该方法将人脸视为多个独立部分,但其均匀划分区块且未考虑FACS知识,导致性能欠佳。Li等 [4] 提出增强裁剪网络 (EAC-Net),重点聚焦各AU中心区域,但其AU中心定义简单且使用图像级上下文学习,CNN主干可能利用错误上下文分类,而缺乏RoI级监督信息仅能提供粗粒度指导。
Song等 [33] 研究了AU的稀疏性与共现性。Han等 [15] 提出优化滤波器尺寸CNN (OFS-CNN) 同步学习所有卷积层的滤波器尺寸与权重。其他相关研究包括数据集规模影响 [34]、视频动作检测 [35]、基于姿态的动作识别特征 [36],以及视觉问答的广义多模态分解高阶池化 [37]。现有工作主要集中于基于标志点的区域或使用卷积核分别学习多个区域,而结合专家先验知识进行检测并利用RoI级标签的方法虽重要却在先前研究中被低估。
Researchers have utilized temporal dependencies in video sequences over the last few years. Romero et al. [2] advocated a two-stream CNN model that combines optical flow and RGB information, and their result was promising. However, they used one binary classification model for each AU, which caused their approach to be time consuming to train and yield numerous model parameters. The CNN and LSTM hybrid network architectures are studied in Chu et al. [38], Li et al. [3] and He et al. [39], which feed the CNN-produced features to LSTM to improve performance by capturing the temporal relationship across frames. However, their solutions are inefficient because they are not an end-to-end networks. In our experiments, we also investigate the effects of using temporal feature relationships in the time axis of videos. We use various dynamic models (including two-stream network, ConvLSTM etc.) that are incorporated into AU R-CNN. Such temporal dependency cannot always improve performance in all cases (Section 4.5).
研究人员在过去几年中利用了视频序列中的时间依赖性。Romero等人[2]提出了一种结合光流和RGB信息的双流CNN模型,其结果很有前景。然而,他们为每个AU使用一个二元分类模型,导致该方法训练耗时且产生大量模型参数。Chu等人[38]、Li等人[3]和He等人[39]研究了CNN与LSTM混合网络架构,通过将CNN生成的特征输入LSTM来捕获帧间时间关系以提高性能。但他们的解决方案效率不高,因为不是端到端网络。在我们的实验中,我们还研究了在视频时间轴上使用时间特征关系的影响。我们采用了多种动态模型(包括双流网络、ConvLSTM等)并将其整合到AU R-CNN中。这种时间依赖性并非在所有情况下都能提升性能(第4.5节)。
Table 1. FACS definition of AUs and related muscles [1]
| AU number | AU name | MuscleBasis |
| 1 | Innerbrowraiser | Frontalis |
| 2 | Outer browraiser | Frontalis |
| 4 | Brow lowerer | Corrugator supercilii |
| 6 | Cheek raiser | Orbicularis oculi |
| 7 | Lid tightener | Orbicularis oculi |
| 10 | Upper lip raiser | Levator labii superioris |
| 12 | Lip corner puller | Zygomaticus major |
| 14 | Dimpler | Buccinator |
| 15 | Lip corner depressor | Depressor anguli oris |
| 17 | Chin raiser | Mentalis |
| 23 | Lip tightener | Orbicularis oris |
| 24 | Lip pressor | Orbicularis oris |
| 25 | Lips part | Depressor labii inferioris |
| 26 | Jaw drop | Masseter |
表 1: FACS定义的AUs及相关肌肉 [1]
| AU编号 | AU名称 | 肌肉基础 |
|---|---|---|
| 1 | Innerbrowraiser | Frontalis |
| 2 | Outer browraiser | Frontalis |
| 4 | Brow lowerer | Corrugator supercilii |
| 6 | Cheek raiser | Orbicularis oculi |
| 7 | Lid tightener | Orbicularis oculi |
| 10 | Upper lip raiser | Levator labii superioris |
| 12 | Lip corner puller | Zygomaticus major |
| 14 | Dimpler | Buccinator |
| 15 | Lip corner depressor | Depressor anguli oris |
| 17 | Chin raiser | Mentalis |
| 23 | Lip tightener | Orbicularis oris |
| 24 | Lip pressor | Orbicularis oris |
| 25 | Lips part | Depressor labii inferioris |
| 26 | Jaw drop | Masseter |
Unlike existing approaches, AU R-CNN is a unified end-toend learning model that encodes expert prior knowledge and outperforms state-of-the-art approaches. Thus, it is a simple and practical model.
与现有方法不同,AU R-CNN 是一个统一的端到端学习模型,它编码了专家先验知识,并优于最先进的方法。因此,它是一个简单实用的模型。
3. Proposed Method
3. 提出方法
3.1. Overview
3.1. 概述
AU detection can be considered a multi-label classification problem. The most popular image classification approach is the CNN, and the basic assumption for a standard CNN is the shared convolutional kernels for an entire image. For a highly structural image, such as a human face, a standard CNN will fail to capture subtle appearance changes. To address this issue, we propose AU R-CNN, in which expert prior knowledge is encoded. We review FACS [1] and define a rule (“AU partition rule”) for partitioning a face on the basis of FACS knowledge using landmarks. With this rule, we can treat each face image as a group of separate regions and AU R-CNN is proposed to recognize each region. The overall procedure is composed of two steps. First, the face image’s landmark points are obtained, and then the face is partitioned into regions on the basis of the AU partition rule and the landmark coordinates. The “AU masks” are generated in this step, and the expert prior knowledge is encoded into the AU masks. Second, the face images are input into the AU R-CNN’s backbone, the produced feature map and the minimum bounding boxes of the AU mask are then fed into AU R-CNN’s RoI pooling layer together. The final fully-connected (fc) layer’s output can be treated as classification probabilities. The image-level ground truth label is also partitioned to RoI-level in the learning. After AU R-CNN is trained over, the prediction is performed on the RoI-level. Then, we use a “bit-wise OR” operator to merge RoI-level prediction labels to image-level ones. In this section, we introduce the AU partition rule and then AU R-CNN. We also introduce a dynamic model extension of AU R-CNN in Section 3.4.
AU检测可以视为一个多标签分类问题。最流行的图像分类方法是CNN,标准CNN的基本假设是整个图像共享卷积核。对于高度结构化的图像(如人脸),标准CNN难以捕捉细微的外观变化。为解决此问题,我们提出了AU R-CNN,其中编码了专家先验知识。我们回顾了FACS [1],并根据FACS知识使用特征点定义了划分面部的规则("AU分区规则")。通过该规则,可将每张人脸图像视为一组独立区域,AU R-CNN被设计用于识别每个区域。整体流程包含两个步骤:首先获取人脸图像特征点坐标,根据AU分区规则和特征点坐标将面部划分为多个区域。此步骤生成"AU掩码",专家先验知识被编码至AU掩码中;其次,将人脸图像输入AU R-CNN主干网络,生成的特征图与AU掩码的最小边界框共同输入RoI池化层。最终全连接(fc)层的输出可作为分类概率。学习过程中,图像级真实标签也被划分至RoI级。AU R-CNN训练完成后,在RoI级进行预测,随后通过"按位或"运算符将RoI级预测标签合并为图像级标签。本节将介绍AU分区规则及AU R-CNN,动态模型扩展将在3.4节阐述。
3.2. AU partition rule
3.2. AU 分区规则
AUs appear in specific regions of a face but are not limited to facial landmark points; previous AU feature extraction approaches directly use facial landmarks or offsets of the landmarks as AU centers [3, 4, 13], but the actual places where activities occur may be missed, and sensitivity of the system may be increased. Instead of identifying the AU center, we adopt the domain-related expertise to guide the partition of AU-related RoIs. The first step is to utilize the dlib [40] toolkit to obtain 68 landmark points. The landmark points provide rich information about the face, and the landmark points help us focus on areas where AUs may occur. Fig. 2 shows the region partition of a face, and several extra points are calculated using 68 landmarks. A typical example is shown in Fig. 2 right. The face image is partitioned into 43 basic RoIs using landmarks. Then, on the basis of FACS definition 1 (Table 1) and the anatomy of facial muscle structure2, the AU partition rule and the AU mask can be defined for representing the expert prior knowledge. For this purpose, we classify AUs into four cases.
动作单元 (AU) 出现在面部的特定区域,但不局限于面部关键点;以往的动作单元特征提取方法直接使用面部关键点或关键点偏移量作为动作单元中心 [3, 4, 13],但可能会遗漏实际发生活动的区域,并增加系统的敏感性。我们采用领域相关知识来指导动作单元相关感兴趣区域 (RoI) 的划分,而非识别动作单元中心。第一步是利用 dlib [40] 工具包获取 68 个关键点。这些关键点提供了丰富的面部信息,帮助我们聚焦可能发生动作单元的区域。图 2 展示了面部区域划分,其中使用 68 个关键点计算了若干额外点。典型示例如图 2 右侧所示。通过关键点将面部图像划分为 43 个基础感兴趣区域。随后,基于面部动作编码系统 (FACS) 定义 1 (表 1) 和面部肌肉结构解剖学 2,可以定义动作单元划分规则和动作单元掩模,用以表示专家先验知识。为此,我们将动作单元分为四种情况。
(1) The RoIs defined in Fig. 2 are the basic building blocks, named basic RoIs. One AU contains multiple basic RoIs; hence, multiple basic RoIs are selected to be grouped and assigned to AUs by RoI numbers (Table 2). The principle of such RoI assignment is the FACS muscle definition (Table 1). The region of the grouped RoIs is called the “AU mask”.
图 2 中定义的 RoI 是基本构建块,称为基础 RoI。一个 AU 包含多个基础 RoI,因此通过 RoI 编号 (表 2) 将多个基础 RoI 分组并分配给 AU。这种 RoI 分配的原则基于 FACS 肌肉定义 (表 1)。分组后的 RoI 区域称为 "AU 掩码"。
(2) Most muscles can present multiple AUs—in other words, some AUs can co-occur in the same place. For example, AU 12 (lip corner puller) and AU 10 (upper lip raiser) are often present together in a smile, which requires lifting of the muscle and may also deepen the nasolabial fold, as shown in Fig. 4(e). Therefore, we group AUs into 8 “AU groups” on the basis of AU-related muscles defined in FACS (Table 1) and the AU cooccurrence statistics of the database. Each AU group has its own mask, whose region is shared by the AUs. One AU group contains multiple basic RoIs, which are defined in Fig. 2, to form an AU mask (Fig. 4).
(2) 大多数肌肉可以呈现多个动作单元(AU)——换言之,某些AU可以在同一部位同时出现。例如,AU 12(嘴角提肌)和AU 10(上唇提肌)经常在微笑时共同出现,这需要肌肉上提并可能加深鼻唇沟,如图4(e)所示。因此,我们根据FACS中定义的AU相关肌肉(表1)和数据库的AU共现统计,将AU分为8个"AU组"。每个AU组都有其专属的面具区域,该区域由组内AU共享。一个AU组包含多个基础感兴趣区域(RoI)(定义见图2),共同构成AU面具(图4)。
In summary, Table 2 and Fig. 4 show the AU partition rule and the AU mask. The AU group definition is related not only to the RoI partition of the face, but also to the RoI-level label assignment.
总结来看,表2和图4展示了AU (Action Unit) 分区规则和AU掩码。AU组的定义不仅与人脸RoI (Region of Interest) 分区相关,还与RoI级别的标签分配有关。
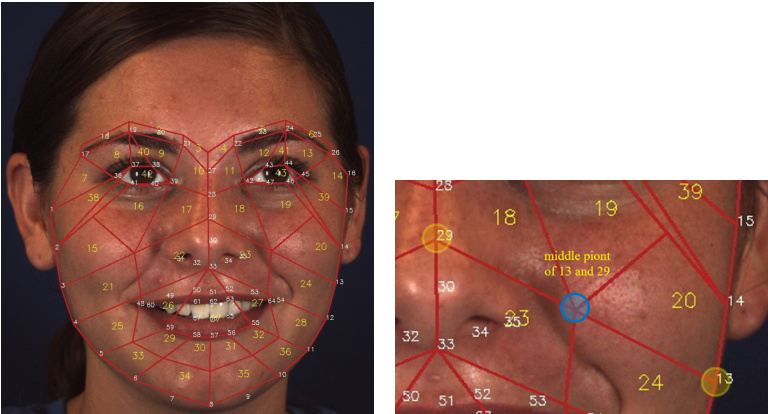
Fig. 2. Landmark and region partition of face. Yellow and white numbers indicate the RoI number and landmark number respectively. Left: Partition of 43 RoIs. Right: Position of blue point is the average position of landmark 13 and 29.
图 2: 人脸关键点及区域划分。黄色和白色数字分别表示感兴趣区域(RoI)编号和关键点编号。左图: 43个感兴趣区域的划分。右图: 蓝点位置是关键点13和29的平均位置。
3.3. AU R-CNN
3.3. AU R-CNN
AU R-CNN is composed of two modules, namely, feature extraction and head modules. This model can use ResNet [41] or VGG [42] as its backbone. Here, we use ResNet-101 to illustrate (Fig. 3). The feature extraction module comprises convlayers that produce the feature maps (ResNet-101’s conv1, bn1, res2, res3, res4 layers), and the head module includes an RoI pooling layer and the subsequent top layers (res5, avg-pool, and fc layers). After AU masks are obtained, unrelated areas can be excluded. However, each AU mask is an irregular polygon area, which means it cannot be directly fed into the fc layer. Therefore, we introduce the RoI pooling layer originally from Fast R-CNN [16]. The RoI pooling layer is designed to convert the features inside any rectangle RoI (or bounding box) into a small feature map with a fixed spatial extent of $H\times W$ . To utilize the RoI pooling layer, each AU mask is converted into a minimum bounding box (named “AU bounding box”) around the mask to input 3(Fig. 6). The RoI pooling layer needs a parameter named “RoI size”, indicates the RoI’s height and width after pooling. In our experiment, we set RoI size to $14\times14$ in ResNet101 backbone and $7\times7$ in VGG-16 and VGG-19 backbone.
AU R-CNN由两个模块组成,即特征提取模块和头部模块。该模型可以使用ResNet [41]或VGG [42]作为主干网络。这里我们以ResNet-101为例进行说明(图3)。特征提取模块包含生成特征图的卷积层(ResNet-101的conv1、bn1、res2、res3、res4层),头部模块包括RoI池化层及其后的顶层(res5、avg-pool和fc层)。
获取AU掩码后,可以排除无关区域。但每个AU掩码都是不规则多边形区域,这意味着无法直接输入到fc层。因此我们引入了源自Fast R-CNN [16]的RoI池化层。RoI池化层旨在将任意矩形RoI(或边界框)内的特征转换为具有固定空间范围$H\times W$的小特征图。
为了使用RoI池化层,每个AU掩码都被转换为围绕该掩码的最小边界框(称为"AU边界框")作为输入(图6)。RoI池化层需要一个名为"RoI尺寸"的参数,表示池化后RoI的高度和宽度。在我们的实验中,ResNet101主干网络设置RoI尺寸为$14\times14$,VGG-16和VGG-19主干网络设置为$7\times7$。
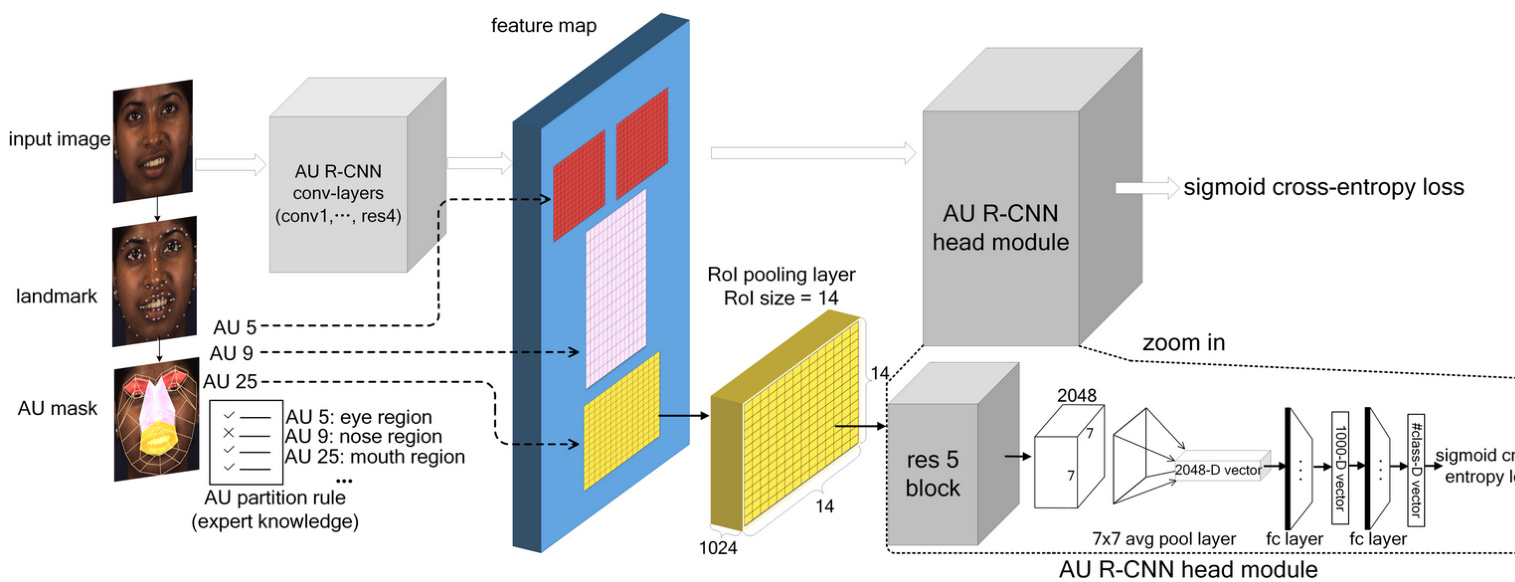
Fig. 3. AU R-CNN using ResNet-101 backbone architecture, where #class denotes the AU category number we wish to discriminate.
图 3: 采用 ResNet-101 骨干网络的 AU R-CNN 架构,其中 #class 表示待区分的 AU 类别数量。
Table 2. AU partition rule
| AU group | AU NO | RoI NO |
| #1* (E#2) | AU1,AU2, AU5,AU7 | 1,2,5,6,8,9,12,13, 40,41,42,43 |
| #2 | AU 4 | 1,2,3,4,5,6,8,9,12, 13,40,41 |
| #3 | AU 6 | 16,17,18,19,42,43 |
| #4 (E #3) | AU9 | 10,11,17,18,22,23 |
| #5 (E#6) | AU 10,AU 11, AU 12,AU 13, AU 14,AU15 | 21,22,23,24,25,26, 27,28,37 |
| #6 (E#5) | AU 16,AU 20, AU 25,AU26, AU 27 | 25,26,27,28,29,30, 31,32,33,34,35,36,37 |
| #7 (E#6) | AU 17 | 29,30,31,32,33,34,35, 36 |
| #8 (E#5,#6) | AU 18,AU 22, AU 23,AU 24, AU 28 | 26,27,29,30,31,32,37 |
Note: Symbol $^*$ means the corresponding AU group have symmetrical regions. Symbol $\in$ indicates the “label fetch”.
表 2. AU分区规则
| AU组 | AU编号 | RoI编号 |
|---|---|---|
| #1* (E#2) | AU1,AU2,AU5,AU7 | 1,2,5,6,8,9,12,13,40,41,42,43 |
| #2 | AU4 | 1,2,3,4,5,6,8,9,12,13,40,41 |
| #3 | AU6 | 16,17,18,19,42,43 |
| #4 (E#3) | AU9 | 10,11,17,18,22,23 |
| #5 (E#6) | AU10,AU11,AU12,AU13,AU14,AU15 | 21,22,23,24,25,26,27,28,37 |
| #6 (E#5) | AU16,AU20,AU25,AU26,AU27 | 25,26,27,28,29,30,31,32,33,34,35,36,37 |
| #7 (E#6) | AU17 | 29,30,31,32,33,34,35,36 |
| #8 (E#5,#6) | AU18,AU22,AU23,AU24,AU28 | 26,27,29,30,31,32,37 |
注: 符号$^*$表示对应AU组具有对称区域。符号$\in$表示"标签获取"。
Object detection networks, such as Fast R-CNN, aim to identify and localize the object. Benefiting from the design of the AU mask, we have strong confidence in where the AUs should occur; thus, we can concentrate on what the AUs are. Fig. 3 depicts the AU R-CNN’s forward process. In the RoI pooling layer, we input the AU bounding box and feature map (The bounding box coordinates and feature map are usually $16\times$ smaller than the input image resolution). We treat the last fully connected layer’s output vector as predicted label probabilities. The total AU category number we wish to discriminate is set as $L^{4}$ ; the number of bounding boxes in each image is $R^{5}$ ; the ground truth $\mathbf{y}\in{0,1}^{R\times L},\bar{\mathbf{y}}{i,j}$ indicates the $(i,j)$ -th element of $\mathbf{y}$ , where $\mathbf{y}{i,j}=0$ denotes AU $j$ is inactive in bounding box $i$ , and AU $j$ is active if $\mathbf{y}{i,j}=1$ . The ground truth y must satisfy the AU partition rule’s space constraint: $\mathbf{y}_{i,j}=0$ if AU $j$ does not belong to bounding box $i$ ’s corresponding AU group (Fig. 6 and Table 2). The RoI-level prediction probability is $\hat{\mathbf{y}}\in\mathbb{R}^{R\times L}$ . Given multiple labels inside each RoI (e.g. AU 10 and AU 12 often occur together in the mouth area), we adopt the multi-label sigmoid cross-entropy loss function, namely,
目标检测网络(如Fast R-CNN)旨在识别并定位对象。得益于AU掩码的设计,我们对AU应出现的位置具有高度信心,因此可专注于识别AU类型。图3展示了AU R-CNN的前向传播过程:在RoI池化层中,我们输入AU边界框和特征图(边界框坐标和特征图通常比输入图像分辨率小$16\times$),将最后一个全连接层的输出向量作为预测标签概率。待区分的AU类别总数设为$L^{4}$,每张图像的边界框数量为$R^{5}$。真实标签$\mathbf{y}\in{0,1}^{R\times L}$中$\bar{\mathbf{y}}{i,j}$表示$\mathbf{y}$的第$(i,j)$个元素——当$\mathbf{y}{i,j}=0$时表示边界框$i$中AU $j$未激活,$\mathbf{y}{i,j}=1$时表示激活。真实标签y必须满足AU分区规则的空间约束:若AU $j$不属于边界框$i$对应的AU组(图6和表2),则$\mathbf{y}_{i,j}=0$。RoI层预测概率为$\hat{\mathbf{y}}\in\mathbb{R}^{R\times L}$。鉴于每个RoI内存在多标签情况(例如嘴部区域常同时出现AU 10和AU 12),我们采用多标签sigmoid交叉熵损失函数,即
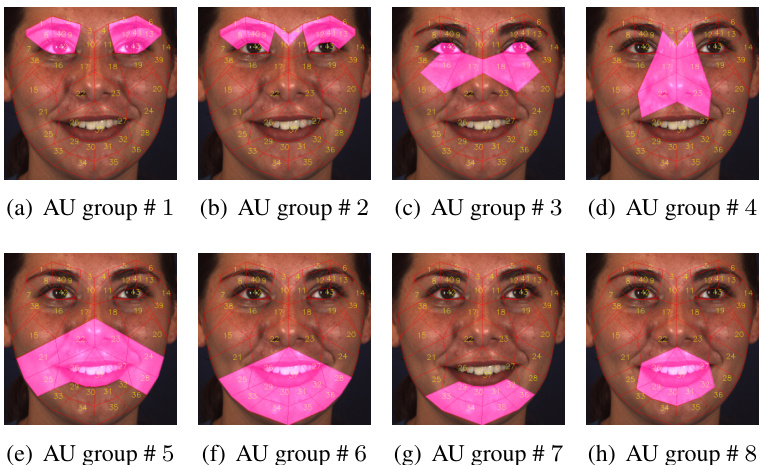
Fig. 4. Action Unit masks for AU group #1 $\sim$ #8 (see Table 2).
图 4: 动作单元组 #1 $\sim$ #8 的面部动作编码掩膜 (参见表 2)。
$$
\mathcal{L}(\mathbf{y},\hat{\mathbf{y}})=-\frac{1}{R}\sum_{r=1}^{R}\sum_{l=1}^{L}{\mathbf{y}_{r,l}\log(\hat{\mathbf{y}}_{r,l})}
$$
$$
\mathcal{L}(\mathbf{y},\hat{\mathbf{y}})=-\frac{1}{R}\sum_{r=1}^{R}\sum_{l=1}^{L}{\mathbf{y}_{r,l}\log(\hat{\mathbf{y}}_{r,l})}
$$
Unlike ROI-Nets [3] and EAC-Net [4], AU R-CNN has considerably fewer parameters due to the sharing of conv-layer in the feature extraction module, which leads to space and time saving. The RoI pooling layer and RoI-level label also help improve classifier performance through the space constraint and supervised information of the RoIs.
与 ROI-Nets [3] 和 EAC-Net [4] 不同,AU R-CNN 由于在特征提取模块中共享卷积层,参数量显著减少,从而节省了空间和时间。RoI 池化层和 RoI 级标签还通过空间约束和 RoI 的监督信息帮助提升分类器性能。
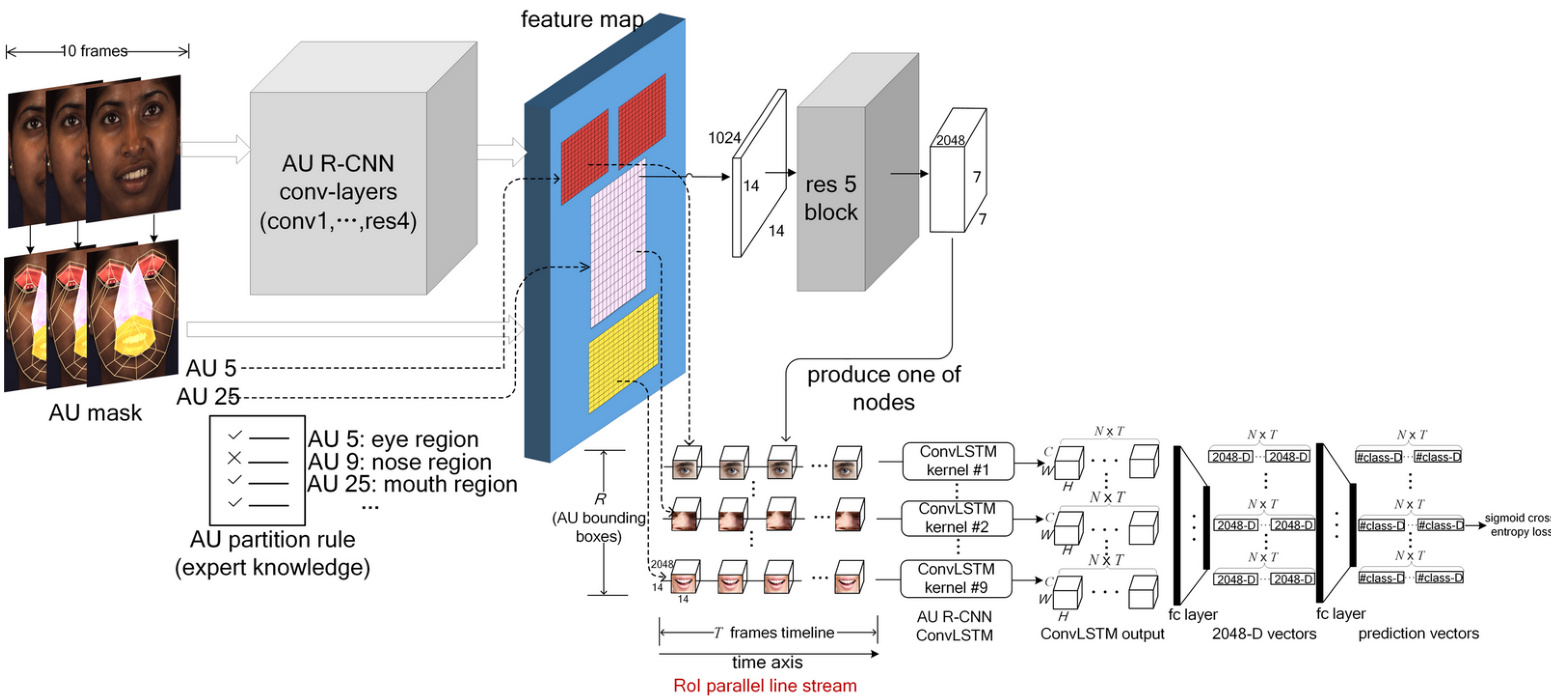
Fig. 5. AU R-CNN integrated with ConvLSTM architecture, where $N$ denotes mini-batch size; $T$ denotes the frames to process in each iteration; $R$ denotes AU bounding box number; $C,H$ , and $W$ denotes the ConvLSTM’s output channel number, height and width respectively. #class denotes the AU category number we wish to discriminate.
图 5: 结合ConvLSTM架构的AU R-CNN模型,其中$N$表示小批量大小;$T$表示每次迭代处理的帧数;$R$表示AU边界框数量;$C,H$和$W$分别代表ConvLSTM的输出通道数、高度和宽度。#class表示待区分的AU类别数量。
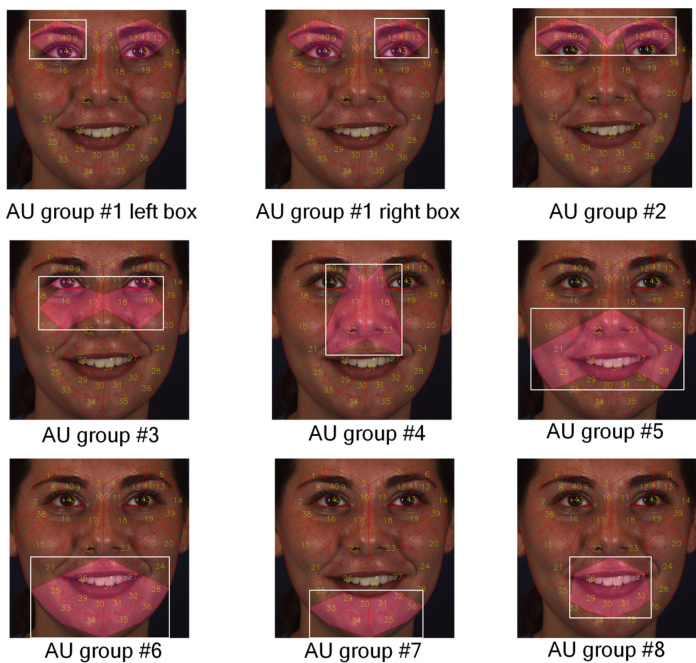
Fig. 6. AU bounding boxes, which are defined as the minimum bounding box around each AU mask. Since AU group #1 has two symmetrical regions, the bounding box number is 9.
图 6: AU边界框,定义为每个AU掩码周围的最小边界框。由于AU组#1包含两个对称区域,因此边界框数量为9。
In the inference stage, the last fc layer’s output is converted to a binary integer prediction vector using the threshold of zero (the elements that greater than 0 set to 1, others set to 0). Multiple RoIs’ prediction results are merged via a “bit-wise OR” operator to obtain the image-level label. We report F1 scores of this merged image-level prediction results in Section 4.
在推理阶段,最后一个全连接层 (fc) 的输出通过零阈值转换为二进制整数预测向量(大于0的元素设为1,其余设为0)。多个感兴趣区域 (RoI) 的预测结果通过"按位或"运算符合并,得到图像级标签。我们在第4节报告了这种合并后的图像级预测结果的F1分数。
3.4. Dynamic model extension of AU R-CNN
3.4. AU R-CNN 的动态模型扩展
AU R-CNN can use only static RGB images to learn. A natural extension is to use the RoI feature map extracted from AU RCNN to model the temporal dependency of RoIs across frames. In this extension, we can adopt various dynamic models to observe RoI-level appearance changes (Experiments are shown in Section 4.5). In this section, we introduce one extension that integrates ConvLSTM [18] into the AU R-CNN architecture.
AU R-CNN仅能通过静态RGB图像进行学习。一个自然的扩展方向是利用从AU R-CNN提取的RoI特征图,来建模跨帧RoI区域的时间依赖性。在此扩展方案中,我们可以采用多种动态模型来观察RoI级别的外观变化(实验结果见第4.5节)。本节将介绍将ConvLSTM [18] 整合到AU R-CNN架构中的一种扩展实现。
Fig. 5 shows the AU R-CNN integrated with ConvLSTM architecture. In each image, we first extract nine AU group RoI features $(7\times7\times2048)$ corresponding to nine AU bounding boxes of Fig. 6 from the last conv-layer. To represent the evolvement of facial local regions, we construct an RoI parallel line stream with nine timelines. The timeline is constructed by skipping four frames per time-step in the video to eliminate the similar frames. In total, we set 10 time-steps for each iteration. In each timeline, we connect the RoI at the current frame to the corresponding RoI at the adjacent frames, e.g. the mouth area has only temporal correlation to the next/previous frame’s mouth area. Therefore, each timeline corresponds to an AU bounding box’s evolution across time. Nine ConvLSTM kernels are used to process on the nine timelines. The output of each ConvLSTM kernel are fed into two fc layers to produce the prediction probability. More specifically, Let’s denote the mini-batch size as $N$ . the time-steps as $T$ , the channel, height and width of RoI feature as $C$ , $H$ and $W$ respectively. The concatenation of ConvLSTM’s all time-step’s output is a five-dimensional tensor of shape $[N,T,C,H,W]$ . We reshape this tensor to a two-dimensional tensor of shape $[N\times T,C\times H\times W]$ , the first dimension is treated as the mini-batch of shape $[N\times T]$ . This reshaped tensor is input to two fc layers to get a prediction probability vector of shape $[N{\times}T,C l a s s]$ , where Class denotes AU category number. We adopt the sigmoid cross-entropy loss function to minimize difference between the prediction probability vector and ground truth, which is the same as Eq. 1. In the inference stage, we use the last frame’s prediction result of the 10-frame video clip to evaluate. This model, named $\mathbf{\tilde{A}R}_{C o n v L S T M}'$ , is trained together with AU R-CNN in an end-to-end form.
图 5 展示了与 ConvLSTM 架构集成的 AU R-CNN。在每张图像中,我们首先从最后一个卷积层提取九个 AU 组 RoI 特征 $(7\times7\times2048)$,对应图 6 的九个 AU 边界框。为表征面部局部区域的动态变化,我们构建了包含九条时间线的 RoI 平行线流。时间线通过视频中每时间步跳过四帧来消除相似帧构建,每次迭代共设置 10 个时间步。每条时间线将当前帧的 RoI 与相邻帧的对应 RoI 相连(例如嘴部区域仅与前后帧的嘴部区域存在时序关联),因此每条时间线对应一个 AU 边界框随时间演化的过程。使用九个 ConvLSTM 核分别处理九条时间线,每个 ConvLSTM 核的输出经两个全连接层生成预测概率。具体而言,设小批量大小为 $N$,时间步为 $T$,RoI 特征的通道数、高度和宽度分别为 $C$、$H$ 和 $W$。ConvLSTM 所有时间步输出的拼接结果是一个五维张量 $[N,T,C,H,W]$,我们将其重塑为二维张量 $[N\times T,C\times H\times W]$,其中第一维度 $[N\times T]$ 视为小批量。该重塑张量输入两个全连接层后,得到形状为 $[N{\times}T,C l a s s]$ 的预测概率向量(Class 表示 AU 类别数)。采用 sigmoid 交叉熵损失函数最小化预测概率向量与真实值间的差异(与公式 1 相同)。推理阶段使用 10 帧视频片段最后一帧的预测结果进行评估。该模型命名为 $\mathbf{\tilde{A}R}_{C o n v L S T M}'$,以端到端形式与 AU R-CNN 联合训练。
The introduction of the dynamic model extension brings new issues, as shown in our experiments (Section 4.5), the dynamic model cannot always improve overall performance as expected. We use database statistics and a data visualization technique to identify the effective cases. Various statistics of BP4D and DISFA databases are collected, including the AU duration of each database and the AU group bounding box areas. Liet al. [4] found that the occurrence of AUs in the database has the influence of static-image-based AU detection class if i ers. However, in the ConvLSTM extension model, the average AU activity duration of videos and $\mathsf{A R}{C o n v L S T M}$ classification performance are correlated. Fig. 9 provides an intuitive figure of such correlation, when the AU duration increases at high peak, the performance of $\mathsf{A R}{C o n v L S T M}$ can be always improved. Therefore, in situations such as long-duration activities, $\mathsf{A R}_{C o n v L S T M}$ can be adopted to improve the performance. Other dynamic models can also be integrated into AU R-CNN, including the two-stream network, TAL-Net, and the general graph CRF model. In Section 4.5, we collect the experiment results and analyze various dynamic models in detail.
动态模型扩展的引入带来了新问题,如实验所示(第4.5节),动态模型并非总能如预期般提升整体性能。我们通过数据库统计数据和数据可视化技术来识别有效案例。收集了BP4D和DISFA数据库的多项统计数据,包括各数据库的动作单元(AU)持续时长及AU组边界框区域。Liet等[4]发现,数据库中AU的出现会影响基于静态图像的AU检测分类器。然而在ConvLSTM扩展模型中,视频的平均AU活动时长与$\mathsf{A R}{C o n v L S T M}$分类性能存在相关性。图9直观展示了这种关联性:当AU持续时长在高峰值增加时,$\mathsf{A R}{C o n v L S T M}$的性能总能得到提升。因此在长时程活动等场景中,可采用$\mathsf{A R}_{C o n v L S T M}$来提升性能。其他动态模型也可集成至AU R-CNN框架,包括双流网络、TAL-Net和通用图CRF模型。第4.5节详细汇总了实验结果并分析了各类动态模型。
4. Experiments and Results
4. 实验与结果
4.1. Settings
4.1. 设置
4.1.1. Dataset description
4.1.1. 数据集描述
We evaluate our method on two datasets, namely, BP4D dataset [21] and DISFA dataset [22]. For both datasets, we adopt a 3-fold partition to ensure that the subjects are mutually exclusive in the train/test split sets. AUs that present more than $5%$ base rate are included for evaluation. In total, we select 12 AUs on BP4D and 8 AUs on DISFA to report the experiment results.
我们在两个数据集上评估了我们的方法,即 BP4D 数据集 [21] 和 DISFA 数据集 [22]。对于这两个数据集,我们采用 3 折划分以确保训练/测试集中的受试者互不重叠。选取基础率超过 $5%$ 的 AU (Action Unit) 进行评估。最终,我们在 BP4D 上选择了 12 个 AU,在 DISFA 上选择了 8 个 AU 来报告实验结果。
(1) BP4D [21] contains 41 young adults of different races and genders (23 females and 18 males). We use 328 videos (41 participants $\times8$ videos) captured in total, which result in $\sim140{,}000$ valid face images. We select positive samples as those with AU intensities equal to or higher than A-level, and the rest are negative samples. We use 3-fold splits exactly the same as [3, 4] partition to ensure that the training and testing subjects are mutually exclusive. The average AU activity duration of all videos in BP4D and the total activity segment count are shown in Table 14. The average AU mask bounding box area is provided in Table 9.
BP4D [21] 包含41名不同种族和性别的年轻人(23名女性和18名男性)。我们共使用328段视频(41名参与者 $\times8$ 段视频),最终得到 $\sim140{,}000$ 张有效面部图像。我们将AU强度达到A级或更高的样本选为正样本,其余为负样本。我们采用与[3,4]完全相同的3折划分方式,确保训练集和测试集的受试者互不重叠。表14展示了BP4D中所有视频的平均AU活动时长及总活动片段数,表9则提供了平均AU掩码边界框面积。
(2) DISFA [22] contains 27 subjects. We use $\sim260{,}000$ valid face images and 54 videos (27 videos captured by left camera and 27 videos captured by right camera). We also use the 3-fold split partition protocol in the DISFA experiment. The average AU activity duration of all videos in DISFA and the total activity segment count are shown in Table 15. The average AU mask bounding box area is given in Table 10.
DISFA [22] 包含27名受试者。我们使用了约260,000张有效人脸图像和54段视频(左摄像头拍摄的27段视频和右摄像头拍摄的27段视频)。在DISFA实验中同样采用3折划分协议。表15展示了DISFA所有视频的平均AU动作持续时间及总动作片段数,表10则给出了平均AU掩膜边界框面积。
4.1.2. Evaluation metric
4.1.2. 评估指标
Our task is to detect whether the AUs are active, which is a multi-label binary classification problem. Since our approach focuses on RoI prediction for each bounding box (Fig. 6), the RoI-level prediction is a binary vector with $L$ elements, where $L$ denotes the total AU category number we wish to discriminate. We use the image-level prediction to evaluate, which is obtained by using a “bit-wise OR” operator for merging an image’s RoI-level predictions. After obtaining the image-level prediction, we directly use the database provided image-level ground truth labels to evaluate, which are binary vectors with elements equal 1 for active AUs and equal 0 for inactive AUs. The F1 score can be used as an indicator of the performances of the algorithms on each AU and is widely employed in AU detection. In our evaluation, we compute frame-based F1 score [9] for 12 AUs in BP4D and 8 AUs in DISFA on image-level prediction. The overall performance of the algorithm is described by the average F1 score(denoted as Avg.).
我们的任务是检测动作单元(AU)是否激活,这是一个多标签二分类问题。由于我们的方法专注于每个边界框的感兴趣区域(RoI)预测(图6),RoI级别的预测是一个包含$L$个元素的二值向量,其中$L$表示我们要区分的AU类别总数。我们使用图像级预测进行评估,该预测是通过对图像的RoI级预测应用"按位或"运算符合并得到的。获得图像级预测后,我们直接使用数据库提供的图像级真实标签进行评估,这些标签是二值向量,元素为1表示AU激活,为0表示AU未激活。F1分数可作为算法在每个AU上性能的指标,并广泛用于AU检测。在我们的评估中,我们计算了BP4D中12个AU和DISFA中8个AU在图像级预测上的基于帧的F1分数[9]。算法的整体性能由平均F1分数(记为Avg.)描述。
4.1.3. Compared methods
4.1.3. 对比方法
Table 3. Compared models details
| Model | E2E | ML | RGB | LANDMARK | CONVERGE | VIDEO |
| CNNres | √ | × | × | |||
| ARvgg16 | √ | √ | √ | √ | × | |
| ARvgg19 | × | |||||
| ARres | √ | × | ||||
| ARmeanbor | 人 | × | × | |||
| ARFPN | √ | × | ||||
| ARConuLSTM | 人 | |||||
| AR2stream | × | √ | ||||
| ARCRF | × | × | √ | √ | √ | |
| ARTAL | × | × | √ |
* E2E: end-to-end trainable, ML: multi-label learning, RGB: only use RGB information, not incorporate optical flow, LANDMARK: use landmark point, CONVERGE: the model converged in training, VIDEO: need video context.
表 3: 对比模型详情
| 模型 | E2E | ML | RGB | LANDMARK | CONVERGE | VIDEO |
|---|---|---|---|---|---|---|
| CNNres | √ | × | × | |||
| ARvgg16 | √ | √ | √ | √ | × | |
| ARvgg19 | × | |||||
| ARres | √ | × | ||||
| ARmeanbor | 人 | × | × | |||
| ARFPN | √ | × | ||||
| ARConuLSTM | 人 | |||||
| AR2stream | × | √ | ||||
| ARCRF | × | × | √ | √ | √ | |
| ARTAL | × | × | √ |
- E2E: 端到端可训练, ML: 多标签学习, RGB: 仅使用RGB信息(不包含光流), LANDMARK: 使用关键点, CONVERGE: 模型在训练中收敛, VIDEO: 需要视频上下文。
We collect the F1 scores of the most popular state-of-theart approaches that used the same 3-fold protocol in Table 4 and Table 7 to compare our approaches with other methods. These techniques include a linear support vector machine (LSVM), active patch learning (APL [43]), JPML [13], a confidence-preserving machine (CPM [10]), a block-based region learning CNN (DRML [14]), an enhancing and cropping nets (EAC-net [4]), an ROI adaption net (ROI-Nets [3]), and LSTM fused with a simple CNN (CNN+LSTM [38]), an optimized filter size CNN (OFS-CNN [15]). We also conduct complete control experiments of AU R-CNN in Table 5 and Table 8, including ResNet-101 based traditional CNN that classifies the entire face images $\left(\mathrm{CNN}{r e s}\right)$ ), ResNet-101 based AU R-CNN $(\mathrm{AR}{r e s})$ , VGG-16 based AU R-CNN $(\mathrm{AR}{v g g16})$ , VGG-19 based AU R-CNN $(\mathrm{AR}{v g g19})$ , mean bounding boxes version AU R-CNN $(\mathrm{AR}{m e a n.b o x})$ , AU R-CNN incorporate with Feature Pyramid Network [ $44](\mathsf{A R}{F P N})$ , AU R-CNN integrated with ConvLSTM [18] $(\mathrm{AR}{C o n v L S T M})$ ), AU R-CNN with optical flow and RGB feature fusion two-stream network architecture [19] $\left|(\mathrm{AR}{2s t r e a m}\right)$ , general graph CRF with features extracted by AU $\mathsf{R{\cdot}C N N}(\mathsf{A R_{\mathit{C}}}R F)$ , and AU R-CNN with a temporal action localization in video network, TAL-Net [20] $(\mathrm{AR}{T A L})$ . We use ResNet-101 based $\mathrm{CNN}(\mathrm{CNN}_{r e s})$ as our baseline model. The details of the compared models are summarized in Table 3.
我们在表4和表7中收集了采用相同3折协议的最先进流行方法的F1分数,以对比我们的方法与其他技术。这些技术包括线性支持向量机(LSVM)、主动补丁学习(APL [43])、JPML [13]、置信保持机(CPM [10])、基于块的区域学习CNN(DRML [14])、增强裁剪网络(EAC-net [4])、ROI自适应网络(ROI-Nets [3])、融合简单CNN的LSTM(CNN+LSTM [38]),以及优化滤波器尺寸CNN(OFS-CNN [15])。我们还在表5和表8中对AU R-CNN进行了完整对照实验,包括基于ResNet-101的传统CNN(对整个面部图像分类的$\left(\mathrm{CNN}{r e s}\right)$)、基于ResNet-101的AU R-CNN$(\mathrm{AR}{r e s})$、基于VGG-16的AU R-CNN$(\mathrm{AR}{v g g16})$、基于VGG-19的AU R-CNN$(\mathrm{AR}{v g g19})$、平均边界框版本的AU R-CNN$(\mathrm{AR}{m e a n.b o x})$、结合特征金字塔网络的AU R-CNN[$44](\mathsf{A R}{F P N})$、集成ConvLSTM的AU R-CNN[18]$(\mathrm{AR}{C o n v L S T M})$)、融合光流与RGB特征的双流网络架构AU R-CNN[19]$\left|(\mathrm{AR}{2s t r e a m}\right)$、使用AU R-CNN提取特征的通用图CRF$\mathsf{A R_{\mathit{C}}}R F)$,以及结合视频时序动作定位网络TAL-Net[20]的AU R-CNN$(\mathrm{AR}{T A L})$。我们采用基于ResNet-101的$\mathrm{CNN}(\mathrm{CNN}_{r e s})$作为基线模型,对比模型的详细信息汇总于表3。
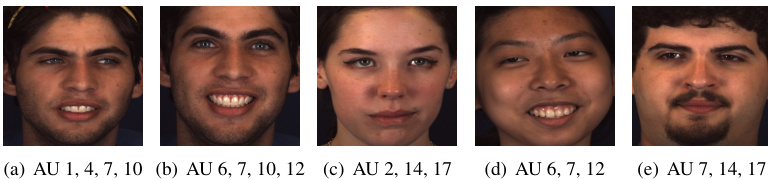
Fig. 7. Example figures of detection result.
图 7: 检测结果示例图。
4.1.4. Implementation details
4.1.4. 实现细节
We resize the face images to $512\times512$ after cropping the face areas. Each image and bounding boxes are horizontally mirrored randomly before being sent to AU R-CNN for data augmentation. We subtract the mean pixel value from all the images in the dataset before sending to AU R-CNN. We use dlib [40] to landmark faces, and the landmark operator is consequently time consuming. We cache the mask in the memcached database to accelerate speed in later epochs. The VGG and ResNet-101 backbones of AU R-CNN use pre-trained ImageNet ILSVRC dataset [45] weights to initialize. AU R-CNN is initialized with a learning rate of 0.001 and further reduced by a factor of 0.1 after every 10 epochs. In all experiments, we select momentum stochastic gradient descent to train AU R-CNN for 25 epochs and set momentum to 0.9 and weight decay to 0.0005. The mini-batch size is set to 5.
我们将裁剪后的人脸区域图像调整为$512\times512$尺寸。在送入AU R-CNN进行数据增强前,每张图像及其边界框会随机进行水平镜像处理。所有图像在输入AU R-CNN前都会减去数据集的平均像素值。我们使用dlib [40]进行人脸特征点检测,该标记操作较为耗时。为提高后续训练效率,我们将生成的面具缓存至memcached数据库。AU R-CNN的VGG和ResNet-101骨干网络采用预训练的ImageNet ILSVRC数据集 [45]权重进行初始化。AU R-CNN初始学习率设为0.001,每10个epoch后衰减为原值的0.1倍。所有实验中,我们采用动量随机梯度下降法训练AU R-CNN共25个epoch,动量参数设为0.9,权重衰减系数为0.0005。mini-batch大小设置为5。
4.2. Conventional CNN versus AU R-CNN
4.2. 传统CNN与AU R-CNN对比
AU R-CNN is proposed for adaptive regional learning in Section 3.3. Thus, our first experiment aims to determine whether it can perform better than the baseline conventional CNN, which uses entire face images to learn. We suppose that by learning the adaptive RoIs separately, recognition capability can be improved. We train ${\mathrm{CNN}}{r e s}$ and $\mathrm{AR}{r e s}$ on the BP4D and DISFA datasets using the same ResNet-101 backbone for comparison. Twelve AUs in BP4D and eight AUs in DISFA are used; therefore, $\mathrm{AR}{r e s}$ and ${\mathrm{CNN}}_{r e s}$ use the sigmoid cross-entropy loss function, as shown in Eq. 1. Both models are based on static images. During each iteration, we randomly select five images to comprise one mini-batch to train and initialize the learning rate to 0.001.
AU R-CNN在3.3节中提出用于自适应区域学习。因此,我们的第一个实验旨在验证其性能是否优于使用整张人脸图像进行学习的传统CNN基线模型。我们假设通过分别学习自适应感兴趣区域(RoIs)可以提升识别能力。我们在BP4D和DISFA数据集上使用相同的ResNet-101骨干网络训练${\mathrm{CNN}}{res}$和$\mathrm{AR}{res}$进行对比。实验选用BP4D的12个AU和DISFA的8个AU,因此$\mathrm{AR}{res}$和${\mathrm{CNN}}_{res}$均采用如公式1所示的sigmoid交叉熵损失函数。两个模型均基于静态图像,每次迭代时随机选取5张图像组成小批量进行训练,初始学习率设为0.001。
Fig. 7 demonstrates the example detection results of our approach. Table 5 and Table 8 show the BP4D and DISFA results, in which the margin is larger in DISFA $(3.69%)$ than in BP4D $(2.1%)$ . These results can be attributed to the relatively lower resolution images in DISFA, which cause $\mathrm{AR}{r e s}$ to benefit more. We also show that AU R-CNN performs efficiently with varying image resolutions. Experiments have been conducted to compare the proposed AU R-CNN and baseline CNN with the same ResNet-101 backbone on the BP4D database with different resolutions of the input image. Table 6 shows the result, and the resolutions of images are set to $256\times256$ , $416\times416$ , $512\times512$ , and $608\times608$ . Most AU results prefer AU R-CNN model by observing subtle cues of facial appearance changes. In $256\times256$ , although the resolution is nearly half of that in $512\times512$ , the performance is close to that in $512\times512$ . This similarity leads to efficient detection when using $256\times256$ . But in the highest resolution $608\times608$ , the F1 score is lower than that of $512\times512$ , we believe this performance drop can be attribute to two possible reasons. (1) As pointed out by Han et al. [15], when the image resolution increases to $608\times608$ , the receptive field covers a smaller actual area of the entire face when using the same convolution filter size. The smaller receptive field deteriorates the vision. (2) Larger images produce larger feature maps before RoI pooling layer in ${\mathrm{AR}}{r e s}$ , or larger feature maps before the final avg pooling layer in $\mathbf{CNN}_{r e s}$ . The increase of feature map size also increases each pooling grid cell’s covered size dramatically in RoI pooling/avg pooling layer, which has negative impact on high level features. Regardless of the overall improvement of AU R-CNN across the 12 AUs. In AU 10 and AU 12, CNN and AU R-CNN obtain similar results. One explanation is that AU 10 and AU 12 have relatively sufficient training samples compared with other AUs.
图 7 展示了我们方法的检测结果示例。表 5 和表 8 分别显示了 BP4D 和 DISFA 的结果,其中 DISFA 的边际 $(3.69%)$ 大于 BP4D $(2.1%)$。这些结果可归因于 DISFA 中图像分辨率相对较低,使得 $\mathrm{AR}{res}$ 获益更多。我们还证明了 AU R-CNN 在不同图像分辨率下均能高效运行。实验在 BP4D 数据库上比较了所提出的 AU R-CNN 与基于相同 ResNet-101 主干的基线 CNN 在不同输入图像分辨率下的表现。表 6 显示了结果,图像分辨率设置为 $256\times256$、$416\times416$、$512\times512$ 和 $608\times608$。通过观察面部外观变化的细微线索,多数 AU 结果更倾向于 AU R-CNN 模型。在 $256\times256$ 分辨率下,虽然分辨率近乎 $512\times512$ 的一半,但性能接近 $512\times512$ 的结果。这种相似性使得使用 $256\times256$ 分辨率时检测效率较高。但在最高分辨率 $608\times608$ 下,F1 分数低于 $512\times512$,我们认为性能下降可能源于两个原因:(1) 如 Han 等人[15]指出,当图像分辨率增至 $608\times608$ 时,使用相同卷积滤波器尺寸会导致感受野覆盖的实际面部区域更小,较小的感受野会损害视觉表现;(2) 较大图像会在 ${\mathrm{AR}}{res}$ 的 RoI 池化层前生成较大特征图,或在 $\mathbf{CNN}_{res}$ 的最终平均池化层前生成较大特征图。特征图尺寸增大会显著扩大 RoI 池化/平均池化层中每个池化网格单元的覆盖范围,这对高层特征产生负面影响。尽管 AU R-CNN 在 12 个 AU 上整体有所改进,但在 AU 10 和 AU 12 上,CNN 与 AU R-CNN 获得相似结果。一种解释是 AU 10 和 AU 12 相比其他 AU 具有相对充足的训练样本。
In the DISFA dataset (Table 8, Table 7), $\mathrm{AR}{r e s}$ outperforms ${\mathrm{CNN}}{r e s}$ in six out of eight AUs. The two remaining AUs are AU 12 and AU 25. As shown in Table 10, AU 12 and AU 25 have the largest area proportions $29.8~%$ and $26.6~%$ ) on the face images. In BP4D and DISFA, AU 1 (inner brow raiser) has a significant improvement in $\mathrm{AR}_{r e s}$ because of the relatively small area on the face.
在DISFA数据集中(表8、表7),$\mathrm{AR}{res}$在八项AU中有六项表现优于${\mathrm{CNN}}{res}$。剩余两项AU为AU12和AU25。如表10所示,AU12和AU25在面部图像中占比面积最大(29.8%和26.6%)。在BP4D和DISFA数据集中,由于AU1(眉毛内侧提升肌)在面部占比较小,$\mathrm{AR}_{res}$对其识别有显著提升。
4.3. ROI-Nets versus AU R-CNN
4.3. ROI-Nets 与 AU R-CNN 对比
Our proposed AU R-CNN in Section 3.3 is designed to recognize local regional AUs in static images under AU mask. Previous state-of-the-art static image AU detection approach ROINets [3] also focuses on regional learning. It attempts to learn regional features by using individual conv-layers over regions centered on AU center (Fig. 8). The two models are based on static images, whereas our AU R-CNN uses the shared convlayer in feature extraction module and RoI-level supervised information. This choice saves space and time, and provides accurate guidance. Instead of using the concept of the AU center area, we introduce the AU mask. We believe that AU mask can preserve more context information than cropping the bounding box from AU center. ROI-Nets adopts VGG-19 as backbone. For fair comparison, we adopt VGG-19 based AU R-CNN (denoted as $\mathrm{AR}{v g g19.}$ ) to compare. $\mathrm{AR}_{v g g19}$ outperforms ROI-Nets in 8 out of 12 AUs in BP4D (Table 4).
我们在3.3节提出的AU R-CNN旨在识别AU掩码下静态图像中的局部区域动作单元(AU)。当前最先进的静态图像AU检测方法ROINets [3]同样专注于区域学习,它通过在AU中心区域(图8)上使用独立卷积层来学习区域特征。这两种模型都基于静态图像,而我们的AU R-CNN在特征提取模块中采用共享卷积层和RoI级别的监督信息,这种选择节省了空间和时间,并提供了精确的指导。与使用AU中心区域的概念不同,我们引入了AU掩码,认为相比从AU中心裁剪边界框,AU掩码能保留更多上下文信息。ROI-Nets采用VGG-19作为主干网络,为公平比较,我们使用基于VGG-19的AU R-CNN(记为$\mathrm{AR}{vgg19}$)进行对比。$\mathrm{AR}_{vgg19}$在BP4D数据集的12个AU中有8个表现优于ROI-Nets(表4)。
The interesting part lies in AU 23 (lip pressor) and AU 24 (lip tighter), in which $\mathrm{AR}{v g g19}$ significantly outperforms ROI-Nets by $7.8%$ and $10.9%$ , respectively. This superiority is because the lip area is a relatively small area on face; AU R-CNN uses AU mask and RoI-level label so that it can concentrate on this area. This fact can be verified from Table 9 that the AU 23 and AU 24 bounding box only occupies $14.7%$ area of the face image. Other typical cases are AU 1, AU 2, and AU 4, which are located in the areas around eyebrows and eyes; $\mathrm{AR}{v g g19}$ outperforms ROI-Nets by $8.5%$ , $11.9%$ , and $8.8%$ , respectively. In AU 6 (cheek raiser, see Fig. 4(c)), AU 10, AU 12, AU 14, and AU 15 results, ROI-Nets and AU R-CNN achieve close results. These areas occupy relatively large proportions in the image (Table 9), and ROI-Nets focuses on the central large area of the image. The experiment in DISFA dataset (Table 7) demonstrates the similar result. The above comparisons prove that, AU R-CNN better expresses the classification information of local regions than ROI-Nets. We also found that the ResNetbased AU R-CNN $(\mathrm{AR}{r e s})$ outperforms $\mathrm{AR}{v g g19}$ in the BP4D and DISFA datasets, and achieves the best performance over all static-image-based approaches. For better representation of AU features, we conduct our remaining experiments on the basis of ${\mathrm{AR}}_{r e s}$ features.
有趣之处在于AU 23(唇部按压肌)和AU 24(唇部收紧肌)的表现,其中$\mathrm{AR}{v g g19}$分别以$7.8%$和$10.9%$的优势显著优于ROI-Nets。这种优势是因为唇部区域在面部占比较小:AU R-CNN通过使用AU掩膜和感兴趣区域(ROI)级标签,能够专注于该区域。这一事实可以从表9中得到验证,AU 23和AU 24的边界框仅占面部图像$14.7%$的面积。其他典型案例包括位于眉毛和眼睛周围的AU 1、AU 2和AU 4区域,$\mathrm{AR}{v g g19}$分别以$8.5%$、$11.9%$和$8.8%$的优势超越ROI-Nets。在AU 6(面颊提升肌,见图4(c))、AU 10、AU 12、AU 14和AU 15的结果中,ROI-Nets与AU R-CNN表现接近。这些区域在图像中占比较大(表9),而ROI-Nets主要关注图像中心的大面积区域。DISFA数据集实验(表7)也呈现出相似结果。上述比较证明,AU R-CNN比ROI-Nets更能表达局部区域的分类信息。我们还发现,基于ResNet的AU R-CNN $(\mathrm{AR}{r e s})$在BP4D和DISFA数据集中表现优于$\mathrm{AR}{v g g19}$,在所有基于静态图像的方法中取得了最佳性能。为了更好地表示AU特征,我们后续实验均基于${\mathrm{AR}}_{r e s}$特征展开。
Table 4. F1 score result comparison with state-of-the-art methods on BP4D dataset. Bracketed bold numbers indicate the best score; bold numbers indicate the second best.
表 4: BP4D数据集上F1分数与最先进方法的对比结果。括号内加粗数字表示最佳得分;加粗数字表示次佳得分。
| AU | LSVM | JPML [13] | DRML [14] | CPM [10] | CNN+LSTM [38] | EAC-Net [4] | OFS-CNN [15] | ROI-Nets [3] | FERA [46] | ARvgg16 | ARugg19 | ARres |
|---|---|---|---|---|---|---|---|---|---|---|---|---|
| 1 | 23.2 | 32.6 | 36.4 | 43.4 | 31.4 | 39 | 41.6 | 36.2 | 28 | 47.5 | 44.8 | [50.2] |
| 2 | 22.8 | 25.6 | 41.8 | 40.7 | 31.1 | 35.2 | 30.5 | 31.6 | 28 | 40.5 | 43.5 | [43.7] |
| 4 | 23.1 | 37.4 | 43 | 43.4 | [71.4] | 48.6 | 39.1 | 43.4 | 34 | 55.1 | 52.2 | 57 |
| 6 | 27.2 | 42.3 | 55 | 59.2 | 63.3 | 76.1 | 74.5 | 77.1 | 70 | 73.8 | 75.7 | [78.5] |
| 7 | 47.1 | 50.5 | 67 | 61.3 | 77.1 | 72.9 | 62.8 | 73.7 | 78 | 76.6 | 75.2 | [78.5] |
| 10 | 77.2 | 72.2 | 66.3 | 62.1 | 45 | 81.9 | 74.3 | [85] | 81 | 82 | 82.7 | 82.6 |
| 12 | 63.7 | 74.1 | 65.8 | 68.5 | 82.6 | 86.2 | 81.2 | [87] | 78 | 85.2 | 85.9 | [87] |
| 14 | 64.3 | 65.7 | 54.1 | 52.5 | 72.9 | 58.8 | 55.5 | 62.6 | [75] | 64.9 | 63.4 | 67.7 |
| 15 | 18.4 | 38.1 | 36.7 | 34 | 34 | 37.5 | 32.6 | 45.7 | 20 | 48.8 | 45.3 | [49.1] |
| 17 | 33 | 40 | 48 | 54.3 | 53.9 | 59.1 | 56.8 | 58 | 36 | 60.6 | 60 | [62.4] |
| 23 | 19.4 | 30.4 | 31.7 | 39.5 | 38.6 | 35.9 | 41.3 | 38.3 | 41 | 43.9 | 46.1 | [50.4] |
| 24 | 20.7 | 42.3 | 30 | 37.8 | 37 | 35.8 | 37.4 | [49.3] | 48.3 | [49.3] | ||
| Avg | 35.3 | 45.9 | 48.3 | 50 | 53.2 | 55.9 | 53.7 | 56.4 | 51.7 | 60.7 | 60.3 | [63] |
Table 5. Control experiments for BP4D. Results are reported using F1 score on 3-fold protocol.
表 5. BP4D的控制实验。结果采用3折协议的F1分数进行报告。
| AU CNNres | ARugg16 ARvgg19 ARresA | ARmean-boz ARFPN ARConuLSTM AR2stream | ARCRFARTAL | |||||||
|---|---|---|---|---|---|---|---|---|---|---|
| 1 | 45.8 | 47.5 | 44.8 | [50.2] | 45.8 | 46.4 | 48 | 46.6 | 50.1 | 41.3 |
| 2 | 43.2 | 40.5 | 43.5 | [43.7] | 41.1 | 40.7 | 43.2 | 42.1 | 35 | 37.4 |
| 4 | 54.3 | 55.1 | 52.2 | [57] | [57] | 47.5 | 53.1 | 52.4 | 45.2 | 44.5 |
| 6 | 77.4 | 73.8 | 75.7 | [78.5] | 75.1 | 76.4 | 76.9 | 75.4 | 71.4 | 64.4 |
| 7 | 77.9 | 76.6 | 75.2 | [78.5] | 77.7 | 76.9 | 78.4 | 77.3 | 77.7 | 73.6 |
| 10 | 81.8 | 82 | 82.7 | 82.6 | 82.2 | 81.3 | [82.8] | 82.1 | 82.1 | 76.2 |
| 12 | 85.8 | 85.2 | 85.9 | 87 | 86.5 | 85.4 | [87.9] | 87.1 | 86.9 | 80 |
| 14 | 60.8 | 64.9 | 63.4 | [67.7] | 62 | 63.5 | [67.7] | 62.7 | 67.2 | 64.9 |
| 15 | [50] | 48.8 | 45.3 | 49.1 | 48 | 44.9 | 45.6 | 49.6 | 47.6 | 45.7 |
| 17 | 58.3 | 60.6 | 60 | 62.4 | 61.5 | 57.9 | [63.4] | 63.2 | 58.7 | 53.3 |
| 23 | 47.6 | 43.9 | 46.1 | [50.4] | 48.7 | 42.3 | 47.9 | 49.9 | 36.8 | 39.1 |
| 24 | 48.4 | 49.3 | 48.3 | 49.3 | 53.2 | 46.6 | 56.4 | [57.6] | 51.6 | 49.5 |
| Avg | 60.9 | 60.7 | 60.3 | [63] | 61.6 | 59.2 | 62.6 | 62.2 | 59.2 | 55.8 |
Table 6. F1 score of varying resolutions comparison result on BP4D dataset. The bold highlights the best performance in each resolution experiment.
表 6: BP4D数据集上不同分辨率的F1分数对比结果。加粗部分表示各分辨率实验中的最佳性能。
| 分辨率 | 256×256 | 256×256 | 416×416 | 416×416 | 512×512 | 512×512 | 608×608 | 608×608 |
|---|---|---|---|---|---|---|---|---|
| AU | CNNres | ARres | CNNres | ARres | CNNres | ARres | CNNres | ARres |
| 1 | 45.6 | 50.1 | 47.4 | 49.3 | 45.8 | 50.2 | 44.3 | 47.5 |
| 2 | 43.6 | 46.5 | 38.3 | 42.1 | 43.2 | 43.7 | 40.1 | 39.2 |
| 4 | 52.2 | 54.6 | 53.3 | 50.0 | 54.3 | 57.0 | 49.5 | 53.5 |
| 6 | 74.9 | 77.7 | 75.7 | 75.2 | 77.4 | 78.5 | 76.3 | 76.9 |
| 7 | 76.3 | 78.3 | 75.7 | 78.7 | 77.9 | 78.5 | 76.4 | 78.6 |
| 10 | 82.5 | 81.7 | 82.4 | 82.3 | 81.8 | 82.6 | 81.5 | 82.7 |
| 12 | 86.5 | 87.5 | 87.2 | 86.5 | 85.8 | 87.0 | 87.5 | 85.5 |
| 14 | 55.4 | 62.1 | 59.5 | 61.9 | 60.8 | 67.7 | 59.5 | 62.0 |
| 15 | 48.0 | 51.2 | 44.1 | 49.2 | 50.0 | 49.1 | 44.9 | 49.6 |
| 17 | 59.9 | 61.8 | 57.5 | 61.4 | 58.3 | 62.4 | 57.4 | 61.3 |
| 23 | 44.7 | 46.2 | 41.2 | 44.9 | 47.6 | 50.4 | 45.6 | 45.1 |
| 24 | 46.9 | 52.3 | 44.5 | 47.7 | 48.4 | 49.3 | 48.2 | 51.1 |
| Avg | 59.7 | 62.5 | 58.9 | 60.8 | 60.9 | 63.0 | 59.3 | 61.1 |
Table 7. F1 score result comparison with state-of-the-art methods on DISFA dataset. Bracketed bold numbers indicate the best score; bold numbers indicate the second best.
表 7. DISFA数据集上F1分数与最先进方法的对比结果。方括号加粗数字表示最佳得分;加粗数字表示次佳得分。
| AU | LSVM | APL[43] | DRML [14] ROI-Nets [3] CNNres | ARvgg16 | ARvgg19 | ARres | ||
|---|---|---|---|---|---|---|---|---|
| 1 | 10.8 | 11.4 | 17.3 | [41.5] | 26.3 | 24.9 | 26.9 | 32.1 |
| 2 | 10 | 12 | 17.7 | [26.4] | 23.4 | 23.5 | 21 | 25.9 |
| 4 | 21.8 | 30.1 | 37.4 | [66.4] | 51.2 | 55.5 | 59.6 | 59.8 |
| 6 | 15.7 | 12.4 | 29 | 50.7 | 48.1 | 51 | [56.5] | 55.3 |
| 9 | 11.5 | 10.1 | 10.7 | 8.5 | 29.9 | 41.8 | [46] | 39.8 |
| 12 | 70.4 | 65.9 | 37.7 | [89.3] | 69.4 | 68 | 67.7 | 67.7 |
| 25 | 12 | 21.4 | 38.5 | [88.9] | 80.1 | 74.9 | 79.8 | 77.4 |
| 26 | 22.1 | 26.9 | 20.1 | 15.6 | 52.4 | 49.4 | 47.6 | [52.6] |
| Avg | 21.8 | 23.8 | 26.7 | 48.5 | 47.6 | 48.6 | 50.7 | [51.3] |

Fig. 8. The AU centers of ROI-Nets, each AU center location is an offset of landmark point, and the $3\times3$ bounding boxes centered at AU centers from top layer’s feature map are cropped.
图 8: ROI-Nets的AU中心点分布,每个AU中心位置是特征点的偏移量,并以顶层特征图中AU中心点为中心的$3\times3$边界框进行裁剪。
Table 8. Control experiments for DISFA. Results are reported using F1 score on 3-fold protocol.
表 8: DISFA控制实验。结果采用3折协议的F1分数进行报告。
| AU | CNNres | ARvgg16 | ARvgg19 | ARres | AR mean_boz | ARFPN | ARConuLSTM | AR2stream | ARCRF |
|---|---|---|---|---|---|---|---|---|---|
| 1 | 26.3 | 24.9 | 26.9 | 32.1 | 31.3 | [39.9] | 26.9 | 34.3 | 24.1 |
| 2 | 23.4 | 23.5 | 21 | 25.9 | 28.3 | [33.3] | 24.4 | 27.4 | 26.5 |
| 4 | 51.2 | 55.5 | 59.6 | [59.8] | 59.3 | 59.3 | 58.6 | 59.4 | 51.7 |
| 6 | 48.1 | 51 | 56.5 | 55.3 | 55.4 | 49.3 | 49.7 | [59.8] | 57.8 |
| 9 | 29.9 | 41.8 | [46] | 39.8 | 38.4 | 32.5 | 34.2 | 42.1 | 33 |
| 12 | 69.4 | 68 | 67.7 | 67.7 | 67.7 | 65.5 | [71.3] | 65 | 65.5 |
| 25 | 80.1 | 74.9 | 79.8 | 77.4 | 77.2 | 72.6 | [83.4] | 77.4 | 71 |
| 26 | 52.4 | 49.4 | 47.6 | 52.6 | 52.8 | 47.9 | 51.4 | 50.1 | [53.5] |
| Avg | 47.6 | 48.6 | 50.7 | 51.3 | 51.3 | 50 | 50 | [51.9] | 47.9 |
Table 9. Average bounding box area in BP4D
表 9. BP4D 中的平均边界框面积
| AU 组 | #1 | #2 | #3 | #5 | #7 | #8 |
|---|---|---|---|---|---|---|
| AU 索引 | 1,2,7 | 4 | 6 | 10,12,14,15 | 17 | 23,24 |
| 平均框面积 (像素) | 17785 | 46101 | 54832 | 103875 | 42388 | 38470 |
| 面积占比 | 6.8% | 17.6% | 20.9% | 39.6% | 16.2% | 14.7% |
Table 10. Average bounding box area in DISFA
表 10. DISFA 中的平均边界框面积
| AU 组别 | #1 | #2 | #3 | #4 | #5 | #6 |
|---|---|---|---|---|---|---|
| AU 编号 | 1,2 | 4 | 6 | 9 | 12 | 25,26 |
| 平均框面积 (像素) | 17545 | 45046 | 46317 | 48393 | 78131 | 69624 |
| 面积占比 | 6.7% | 17% | 17.7% | 18.5% | 29.8% | 26.6% |
We further evaluate the inference time of our approach, LCN (CNN with locally connected layer [47]) and ROI-Nets on a Nvidia Geforce GTX 1080Ti GPU. We run each network for 20 trails over 1000 iterations with the mini-batch size sets to 1; then we evaluate the running time for each iteration, and finally compute the mean and standard deviation over the 20 trials. The inference time is showed in Table 11, we can see our approach benefits from the RoI pooling layer’s parallel computing over multiple bounding boxes, its inference time is lower than LCN and ROI-Nets. The RoI-Nets adopt 20 individual conv-layers for 20 bounding boxes, thus it results worst performance.
我们进一步评估了我们的方法、LCN (采用局部连接层[47]的CNN) 和ROI-Nets在Nvidia Geforce GTX 1080Ti GPU上的推理时间。我们将每个网络的mini-batch大小设置为1,运行20次试验,每次试验进行1000次迭代;然后评估每次迭代的运行时间,最后计算20次试验的平均值和标准差。推理时间如表11所示,可以看出我们的方法受益于RoI池化层对多个边界框的并行计算,其推理时间低于LCN和ROI-Nets。ROI-Nets为20个边界框采用了20个独立的卷积层,因此性能最差。
4.3.1. AU R-CNN $+$ Mean Box
4.3.1. AU R-CNN $+$ 平均框
The computation of each image’s precise landmark point location is time consuming. We believe it is enough to use the “mean” AU bounding box coordinates to represent all images’ bounding boxes. In this section, we collect the average coordinates of all images of nine AU group bounding boxes in each database to form a unified “mean box” across all images (Table 12 and Table 13). We use this “mean box” coordinates to replace the real bounding box coordinates calculated from the landmark in each image to evaluate. The experiment results are shown in Table 5 and Table 8, denoted as $\mathrm{AR}{m e a n_b o x}$ . Although most images of BP4D and DISFA dataset are the frontal face, the deviation of mean bounding box coordinates from real box location exists. However, the F1 score is remarkably close to $\mathrm{AR}_{r e s}$ , because the RoI pooling layer in AU R-CNN performs a coarse spatial quantization. This performance similarity demonstrates that AU R-CNN is robust to small landmark location error, and the computation consumption of each image’s landmark can be saved via using “mean box”.
计算每张图像精确特征点位置非常耗时。我们认为使用"平均"AU边界框坐标来代表所有图像的边界框即可。本节收集了各数据库中九组AU边界框在所有图像上的平均坐标,形成跨所有图像的统一"均值框" (表12和表13)。我们使用该"均值框"坐标替代基于特征点计算得到的真实边界框坐标进行评估。实验结果如表5和表8所示,记为$\mathrm{AR}{mean_box}$。尽管BP4D和DISFA数据集大部分为正面人脸图像,均值边界框坐标与真实框位置仍存在偏差。但由于AU R-CNN中的RoI池化层执行的是粗粒度空间量化,其F1分数与$\mathrm{AR}_{res}$极为接近。这种性能相似性表明AU R-CNN对微小特征点定位误差具有鲁棒性,通过使用"均值框"可节省每张图像特征点的计算开销。
Table 11. Inference time(ms) of VGG-19 on $512\times512$ images
表 11: VGG-19 在 $512\times512$ 图像上的推理时间(ms)
| Ours | ROI-Nets [3] | LCN [47] |
|---|---|---|
| 27.4 ± 0.0005 | 67.7 ± 0.0004 | 34.7 ± 0.008 |
Table 12. Mean box coordinates of $512\times512$ images in BP4D.
表 12. BP4D 数据集中 $512\times512$ 图像的平均边界框坐标
| AU分组 | AU编号 | 平均边界框坐标 (ymin,xmin,ymax,xmax格式) |
|---|---|---|
| #1 | 1,2,7 | (30.4, 58.1,140.3,222.5), (30.1, 297.2,140.9,456.5) |
| #2 | 4 | (23.9,57.8,139,455.9) |
| #3 | 6 | (109.4,79.8,264.5,431.8) |
| #5 | 10,12,14,15 | (198.9,35.2,437.0,472.6) |
| #7 | 17 | (378.7,94.5,510.9,416.6) |
| #8 | 23,24 | (282.7,145.5,455.0,368.3) |
4.4. AU R-CNN $^+$ Feature Pyramid Network
4.4. AU R-CNN$^+$特征金字塔网络
In the previous sections, we use the single scale ( $16\times$ smaller scale) RoI feature to detect. Feature Pyramid Network (FPN) [44] is a popular architecture for leveraging a CNN’s pyramidal features in the object detection field, which has semantics from low to high levels. In this experiment, FPN is integrated into AU R-CNN’s backbone as feature extractor that extracts RoI features from the feature pyramid. The assignment of an RoI of width $w$ and height $h$ to the level $k$ of FPN is as follows [44]:
在前面的章节中,我们使用单一尺度(缩小16倍)的RoI特征进行检测。特征金字塔网络 (FPN) [44] 是目标检测领域中利用CNN金字塔特征的流行架构,其语义信息从低层到高层逐渐丰富。本实验将FPN集成到AU R-CNN的主干网络中作为特征提取器,从特征金字塔中提取RoI特征。对于宽度为$w$、高度为$h$的RoI,其分配到FPN第$k$层的规则如下[44]:
$$
k=\lceil k_{0}+\log_{2}(\sqrt{w h}/224)
$$
$$
k=\lceil k_{0}+\log_{2}(\sqrt{w h}/224)
$$
4.5. Static versus Dynamic
4.5. 静态与动态
Can the previous state of facial expression action always improve AU detection? In this section, we conduct a series of experiments using the most popular dynamic models that are integrated into AU R-CNN, including $\mathsf{A R}_{C o n v L S T M}$ , as described in Section 3.4, to determine the answer.
面部表情动作的先前状态总能提升AU检测效果吗?本节我们采用集成到AU R-CNN中最流行的动态模型(包括第3.4节所述的$\mathsf{A R}_{C o n v L S T M}$)进行系列实验以寻找答案。
Table 13. Mean box coordinates of $512\times512$ images in DISFA.
表 13. DISFA数据集中 $512\times512$ 图像的平均边界框坐标
| AU组 | AU编号 | 平均边界框坐标 (ymin,xmin,ymax,xmax格式) |
|---|---|---|
| #1 | 1,2 | (55.5,71.3,168.6,220.0),(53.5,277.6,167.6,431.4) |
| #2 | 4 | (48.5,58.7,165.1,444.0) |
| #3 | 6 | (141.4,86.7,281.5,418.9) |
| #4 | 9 | (107.8,152.2,348.8,352.8) |
| #5 | 12 | (236.9,53.5,433.3,454.4) |
| #6 | 25,26 | (316.4,73.8,511.0,433.4) |

Fig. 9. Correlation between F1 score improvement of that in $\mathrm{AR}{C o n v L S T M}$ over that in $\mathrm{AR}_{r e s}$ and AU activity duration, AU activity duration is rescaled presenting clarity.
图 9: $\mathrm{AR}{ConvLSTM}$ 相比 $\mathrm{AR}_{res}$ 的 F1 分数提升与 AU (Action Unit) 活动时长的相关性,AU 活动时长经过重新缩放以呈现清晰度。
Table 14. AU average duration & segments count in BP4D
表 14. BP4D 中 AU 平均持续时间和片段数量
| AU | 1 | 2 | 4 | 6 | 7 | 10 | 12 | 14 | 15 | 17 | 23 | 24 |
|---|---|---|---|---|---|---|---|---|---|---|---|---|
| 平均持续时间 | 165 | 66 | 73 | 125 | 142 | 148 | 184 | 120 | 38 | 42 | 30 | 49 |
| 片段数量 | 474 | 380 | 408 | 540 | 569 | 591 | 448 | 571 | 647 | 1203 | 806 | 458 |
Table 15. AU average duration & segments count in DISFA
表 15. DISFA 中 AU 的平均持续时间和片段数量
| AU | 1 | 2 | 4 | 6 | 9 | 12 | 25 | 26 |
|---|---|---|---|---|---|---|---|---|
| 平均持续时间 | 55 | 68 | 112 | 115 | 96 | 133 | 154 | 82 |
| 片段数量 | 320 | 218 | 438 | 340 | 148 | 464 | 600 | 606 |
4.5.1. AU R-CNN $+$ ConvLSTM
4.5.1. AU R-CNN $+$ ConvLSTM
In this section, we conduct experiments on $\mathrm{AR}{C o n v L S T M}$ , whose architecture is described in Section 3.4. Table 5 and Table 8 present that $\mathsf{A R}{C o n v L S T M}$ has a slightly lower average F1 score than $\mathrm{AR}{r e s}$ . The main reason of the overall performance drop is that the action duration varies drastically in different AUs (Table 14 and Table 15); if the temporal length of AU duration is short, ConvLSTM model does not have sufficient capability to observe such actions. The switch of action is so rapid that ConvLSTM cannot infer such label change when processing in the video. We draw a plot of F1 score improvement of $\mathrm{AR}{C o n v L S T M}$ over $\mathrm{AR}{r e s}$ and average AU duration (rescale to 1/60 scale) in Fig. 9 to justify our hypothesis. Other factors also influence the performance of ConvLSTM, we can see the red line and the black line have strong correlation in most AUs except AU 1, 2, 4 and AU 15, 17, 23. The reason of high F1 score improvement in AU 17 is that AU 17 has much more segment count (1203) than AU 15 and AU 23 (Table 14), which results in sufficient training samples of AU 17. The AU 4 has lower F1 score improvement than that of AU 1, 2, because AU 4’s bounding box (corresponding AU group #2) is double the size of the area of AU 1 and AU 2 (Fig. 6), the larger bounding box leads to weaker recognition capability of capturing the subtle skin change between eyebrows. Most AUs do not have long activity duration; hence, $\mathrm{AR}{r e s}$ surpasses $\mathsf{A R}_{C o n v L S T M}$ in average F1 score.
在本节中,我们对 $\mathrm{AR}{ConvLSTM}$ 进行了实验,其架构如第3.4节所述。表5和表8显示 $\mathsf{AR}{ConvLSTM}$ 的平均F1分数略低于 $\mathrm{AR}{res}$。整体性能下降的主要原因是不同AU(动作单元)的动作持续时间差异巨大(表14和表15)。如果AU持续时间的时序长度较短,ConvLSTM模型无法充分观察此类动作。动作切换过快导致ConvLSTM在处理视频时难以推断此类标签变化。我们在图9中绘制了 $\mathrm{AR}{ConvLSTM}$ 相对于 $\mathrm{AR}{res}$ 的F1分数提升与平均AU持续时间(按1/60比例缩放)的关系图以验证我们的假设。其他因素也影响了ConvLSTM的性能,可以看到除AU 1、2、4和AU 15、17、23外,红线和黑线在大多数AU中具有强相关性。AU 17的F1分数提升较高是因为其片段数量(1203)远多于AU 15和23(表14),这为AU 17提供了充足的训练样本。AU 4的F1分数提升低于AU 1、2,因为AU 4的边界框(对应AU组#2)面积是AU 1和2的两倍(图6),较大的边界框导致捕捉眉毛间细微皮肤变化的识别能力较弱。大多数AU的活动持续时间不长,因此 $\mathrm{AR}{res}$ 在平均F1分数上优于 $\mathsf{AR}_{ConvLSTM}$。
4.5.2. AU R-CNN $+$ Two-Stream Network
4.5.2. AU R-CNN + 双流网络

Fig. 10. $\mathrm{AR}{r e s}$ vs. $\mathrm{AR}_{2s t r e a m}$ train loss curve
图 10: $\mathrm{AR}{res}$ 与 $\mathrm{AR}_{2stream}$ 训练损失曲线对比
Convolutional two-stream network [19] achieves impressive results in video action recognition. In this experiment, we experiment a two-stream network integrated into the AU R-CNN architecture for comparison, denoted as “AR2stream”. We use a 10-frame optical flow and a single corresponding RGB image,6 which are fed into two AU R-CNNs. Both AU R-CNN branches use the same bounding boxes, which is the corresponding bounding boxes of RGB image branch, for classification. Two produced $7\times7\times2048\mathrm{RoI}$ features are concatenated along the channel dimension. The channel size of 4096 feature map is yielded, which will be reduced to 2048 channels using one kernel size of 1 conv-layer. The features are sent to two fc layers to obtain the classification scores. The ground truth label involved in calculating the loss function adopts the single RGB image’s labels.
卷积双流网络 [19] 在视频动作识别中取得了显著成果。本实验中,我们将双流网络集成到AU R-CNN架构中进行对比测试,记为"AR2stream"。该方法使用10帧光流图和单张对应RGB图像作为输入,分别馈入两个AU R-CNN分支。两个分支采用相同的边界框(即RGB图像分支对应的边界框)进行分类,生成的$7\times7\times2048\mathrm{RoI}$特征沿通道维度拼接,形成4096通道的特征图后,通过1×1卷积核降维至2048通道。最终特征经过两个全连接层获得分类分数,损失函数计算采用RGB图像的单帧标注真值。
Table 16. The features and applications of dynamic models extension
表 16: 动态模型扩展的特性与应用
| 模型 | 应用场景 | 训练速度 | 特性 |
|---|---|---|---|
| ARres | 多数情况下无需视频上下文 | 快 | 高精度且通用性强 |
| ARFPN | 不适用 | 中等 | 精度较低且比ARres层数更多 |
| ARConuLSTM | 适用于AU(动作单元)活动持续时间较长的场景 | 慢 | 在长时间活动中可提升精度 |
| AR2stream | 适用于小区域(尤其是眼部或嘴部)的AU检测 | 快(需预计算光流) | 需先预计算光流 |
| ARCRF | 仅限CPU运行的场景 | 中等(需预计算特征) | 模型参数量小且无需GPU |
| ARTAL | 不适用 | 快 | 训练无法完全收敛 |
The performance of the two-stream network $\mathrm{AR}{2s t r e a m}$ is remarkably close to that of RGB-image-based ${\mathrm{AR}}{r e s}$ , which is slightly worse in the BP4D database (Table 5) and is better in the DISFA database (Table 8). In BP4D, the score significantly increases in AU 17 and AU 24 in $\mathrm{AR}{r e s}$ . All these AUs are in the lip area. We attribute this result to the relative small area in the lip area causes the optical flow to be an obvious signal to classify. If we check the result in DISFA dataset in Table 8, this reason can be verified — AU 1, AU 6, and AU 9 in the DISFA dataset have the smallest AU group areas (Table 10), and the F1 scores of these AUs increase. However, the performance of $\mathrm{AR}{C o n v L S T M}$ in these AUs cannot be improved compared with $\mathrm{AR}{2s t r e a m}$ . This justifies that AU group bounding box area is not the reason of the performance improvement in $\mathsf{A R}{C o n v L S T M}$ but is the reason of performance improvement in $\mathrm{AR}{2s t r e a m}$ . Although the average F1 score of $\mathrm{AR}{2s t r e a m}$ is worse than that of ${\mathrm{AR}{r e s}}$ in the BP4D database, an interesting property exists in $\mathrm{AR}{2s t r e a m}$ — the training convergence speed is faster than that in ${\mathrm{AR}}_{r e s}$ (see loss curve comparison in Fig. 10).
双流网络 $\mathrm{AR}{2s t r e a m}$ 的性能与基于RGB图像的 ${\mathrm{AR}}{r e s}$ 非常接近,在BP4D数据库中稍逊 (表 5),而在DISFA数据库中表现更优 (表 8)。在BP4D数据集中,$\mathrm{AR}{r e s}$ 在AU 17和AU 24的分数显著提升,这些动作单元均位于唇部区域。我们认为这是由于唇部区域相对较小,使得光流信号成为明显的分类特征。通过观察表 8 中DISFA数据集的结果可验证这一点——该数据集中AU 1、AU 6和AU 9的动作单元组区域最小 (表 10),这些AU的F1分数均有所提升。但 $\mathrm{AR}{C o n v L S T M}$ 在这些AU上的表现相比 $\mathrm{AR}{2s t r e a m}$ 并未改进,这表明动作单元组边界框面积是 $\mathrm{AR}{2s t r e a m}$ 性能提升的原因,而非 $\mathsf{A R}{C o n v L S T M}$ 的改进因素。尽管 $\mathrm{AR}{2s t r e a m}$ 在BP4D数据库中的平均F1分数低于 ${AR}{r e s}$,但其具有一个有趣特性——训练收敛速度比 ${AR}_{r e s}$ 更快 (见图 10 的损失曲线对比)。