Full-scale Representation Guided Network for Retinal Vessel Segmentation
全尺度表征引导的视网膜血管分割网络
Abstract
摘要
The U-Net architecture and its variants have remained state-of-the-art (SOTA) for retinal vessel segmentation over the past decade. In this study, we introduce a Full Scale Guided Network (FSG-Net), where the feature representation network with modernized convolution blocks extracts full-scale information and the guided convolution block refines that information. Attention-guided filter is introduced to the guided convolution block under the interpretation that the filter behaves like the unsharp mask filter. Passing full-scale information to the attention block allows for the generation of improved attention maps, which are then passed to the attention-guided filter, resulting in performance enhancement of the segmentation network. The structure preceding the guided convolution block can be replaced by any U-Net variant, which enhances the scalability of the proposed approach. For a fair comparison, we re-implemented recent studies available in public repositories to evaluate their s cal ability and re prod uci bility. Our experiments also show that the proposed network demonstrates competitive results compared to current SOTA models on various public datasets. Ablation studies demonstrate that the proposed model is competitive with much smaller parameter sizes. Lastly, by applying the proposed model to facial wrinkle segmentation, we confirmed the potential for s cal ability to similar tasks in other domains. Our code is available on https://github. com/ZombaSY/FSG-Net-pytorch.
U-Net架构及其变体在过去十年中一直是视网膜血管分割领域的最先进(SOTA)技术。本研究提出全尺度引导网络(FSG-Net),其中采用现代化卷积块的特征表示网络提取全尺度信息,引导卷积块则对这些信息进行精炼。在引导卷积块中引入注意力引导滤波器,其原理是该滤波器的行为类似于非锐化掩模滤波器。将全尺度信息传递至注意力块可以生成改进的注意力图,这些注意力图随后被传递至注意力引导滤波器,从而提升分割网络的性能。引导卷积块之前的结构可替换为任何U-Net变体,这增强了所提方法的可扩展性。为公平比较,我们重新实现了公开代码库中的近期研究,以评估其可扩展性和可复现性。实验表明,与当前SOTA模型相比,所提网络在多个公开数据集上展现出具有竞争力的结果。消融研究证明,所提模型在参数量显著减小的情况下仍具竞争力。最后,通过将所提模型应用于面部皱纹分割,我们验证了其向其他领域类似任务扩展的潜力。代码已开源:https://github.com/ZombaSY/FSG-Net-pytorch。
1. Introduction
1. 引言
Convolutional neural networks (CNNs) have seen significant improvements in performance and optimization since the 2010s. The introduction of hardware acceleration using GPUs, ReLU activation function, and residual block [11, 1] has enabled smooth back-propagation in deep neural network architectures. Research in this field has focused on finding a balance between computational efficiency, parameter size, code s cal ability, and fidelity. Depthwise separable convolution [5] and squeeze-and-excitation [12] have been particularly influential in this regard. The inverted residual block [19] achieved higher fidelity with optimized computational efficiency and a smaller parameter size compared to ResNet.
卷积神经网络(CNN)自2010年代以来在性能和优化方面取得了显著进步。通过引入GPU硬件加速、ReLU激活函数和残差块[11,1],深度神经网络架构实现了平滑的反向传播。该领域的研究重点在于计算效率、参数量、代码可扩展性和保真度之间的平衡。深度可分离卷积[5]和压缩激励模块[12]在这方面产生了特别重要的影响。与ResNet相比,倒残差块[19]以优化的计算效率和更小的参数量实现了更高的保真度。
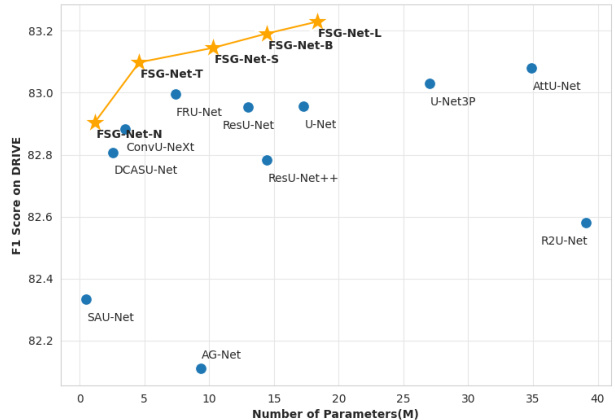
Figure 1. F1 scores of compared networks on the DRIVE dataset, measured against the validation dataset comprising zero-padded images of resolution $608\times608$ . Among the considered architectures, FSG-Net-T achieved a superior F1 score compared to competitive models while maintaining a reduced parameter size relative to its counterparts. Additionally, the FSG-Net-L achieved the highest F1 scores while possessing a median parameter size.
图 1: 在DRIVE数据集上各对比网络的F1分数,评测基于由分辨率$608\times608$的零填充图像组成的验证集。在考虑的架构中,FSG-Net-T在保持较小参数量级的同时,获得了优于竞争模型的F1分数。此外,FSG-Net-L以中等参数量级取得了最高的F1分数。
In the evolutionary history of CNNs, a noteworthy highlight is the dominance of U-Net [18] and its variants [14, 21, 20, 28, 13, 8, 22] as SOTA models in the field of medical image segmentation, especially for retinal vessel segmentation tasks on well-known datasets such as DRIVE, STARE, CHASE_DB1, and HRF. On the contrary, for clinical segmentation tasks on the CVC-clinic and Kvasir-SEG datasets, vision transformer models are employed [23, 2, 3, 9]. The primary distinction between retinal vessels and other clinical datasets lies in the level of feature intricacy required. Vision transform models exhibit some limitations in overcoming their constrained inductive bias. Meanwhile, our experiments underscore the ongoing relevance and effectiveness of attention mechanisms in addressing such challenges.
在CNN的发展历程中,一个值得关注的亮点是U-Net [18]及其变体[14, 21, 20, 28, 13, 8, 22]作为医学图像分割领域的SOTA模型占据主导地位,尤其是在DRIVE、STARE、CHASE_DB1和HRF等知名数据集上的视网膜血管分割任务中。相反,对于CVC-clinic和Kvasir-SEG数据集上的临床分割任务,则采用了视觉Transformer模型[23, 2, 3, 9]。视网膜血管与其他临床数据集的主要区别在于所需特征的复杂程度。视觉Transformer模型在克服其有限的归纳偏置方面表现出一些局限性。同时,我们的实验强调了注意力机制在应对此类挑战时持续的相关性和有效性。
In this study, we aimed to propose a U-Net-based segmentation network that reflects the thin and elongated structural characteristics of retinal vessels, starting with the lower layers and gradually working our way up to the upper layers. Furthermore, based on the understanding that the guided filter [10] can function as a type of edge sharpening filter, the guided filter is located at the decoder after features from the encoder are merged so that full scale features can be used as input to the guided filters at each stage. Our network architecture improves both performance and computational efficiency simultaneously as shown in Figure 1. To ensure a fair comparison of the robustness of competing models, the training environment was maintained consistently.
在本研究中,我们旨在提出一种基于U-Net的分割网络,该网络从底层开始逐步向上层延伸,以反映视网膜血管细长结构的特性。此外,基于引导滤波器 [10] 可作为边缘锐化滤波器使用的认知,我们将引导滤波器置于解码器中编码器特征合并之后,从而使全尺度特征能够作为各阶段引导滤波器的输入。如图1所示,我们的网络架构同时提升了性能和计算效率。为确保公平比较各竞争模型的鲁棒性,训练环境始终保持一致。
The main contributions of this paper are summarized as follows: Firstly, enhancement of feature extraction through the proposal of a novel and efficient convolutional block. Secondly, proposing guided convolution blocks in the decoder, demonstrating performance enhancement as a result and enabling integration with various U-Net segmentation models. Thirdly, a comparison of various SOTA algorithms under a fixed experimental environment.
本文的主要贡献总结如下:首先,通过提出一种新颖高效的卷积块 (convolutional block) 来增强特征提取能力。其次,在解码器中引入引导卷积块 (guided convolution block),验证了其性能提升效果,并实现了与各类U-Net分割模型的兼容性。第三,在固定实验环境下对比了多种SOTA算法。
2. Method
2. 方法
2.1. Motivation
2.1. 动机
The guided filter was first introduced in [10] for image processing under the assumption that the guidance image and the filtered output have a locally linear relationship. The guided filter is formulated as:
导向滤波最初在[10]中提出,用于图像处理,其假设引导图像与滤波输出具有局部线性关系。导向滤波的公式为:
$$
\hat{I}{i}=a_{k}I_{i}+b_{k},\quad\forall i\in{w}_{k},
$$
$$
\hat{I}{i}=a_{k}I_{i}+b_{k},\quad\forall i\in{w}_{k},
$$
where $a,b$ are linear coefficients, and $w$ is a local window. Here, we show why the guided filter can improve edgelike blood vessel segmentation performance. If we consider overlapping windows, the $i\cdot$ -th pixel has several $a_{k}$ and $b_{k}$ values depending on the window size. Thus, the guided filter output of $I_{i}$ can be averaged as follows:
其中 $a,b$ 是线性系数,$w$ 是局部窗口。这里我们说明引导滤波器为何能提升类边缘血管分割性能。若考虑重叠窗口,第 $i$ 个像素会因窗口尺寸不同而拥有多个 $a_{k}$ 和 $b_{k}$ 值。因此,$I_{i}$ 的引导滤波器输出可按下式求取平均值:
$$
{\hat{I}}{i}={\frac{1}{|w|}}\sum_{k\in w_{i}}\left(a_{k}I_{i}+b_{k}\right),\quad\forall i\in w_{k}.
$$
$$
{\hat{I}}{i}={\frac{1}{|w|}}\sum_{k\in w_{i}}\left(a_{k}I_{i}+b_{k}\right),\quad\forall i\in w_{k}.
$$
Now, (2) can be rewritten to have a more intuitive form. In the original paper of the guided filter [10], $b_{k}$ is computed as:
现在,(2) 可以改写为更直观的形式。在引导滤波的原始论文 [10] 中,$b_{k}$ 的计算方式为:
$$
\begin{array}{r}{b_{k}=\bar{p}{k}-a_{k}\bar{I}_{k},}\end{array}
$$
$$
\begin{array}{r}{b_{k}=\bar{p}{k}-a_{k}\bar{I}_{k},}\end{array}
$$
where $\bar{(\cdot)}{k}$ means average in $w_{k}$ . Then, by putting Eq. (3) into Eq. (2), we have the following formulation:
其中 $\bar{(\cdot)}{k}$ 表示在 $w_{k}$ 上的平均值。然后,将方程(3)代入方程(2),得到以下表达式:
$$
\hat{I}{i}=\bar{a}{i}(I_{i}-\bar{I}{i})+\tilde{p}_{i},
$$
$$
\hat{I}{i}=\bar{a}{i}(I_{i}-\bar{I}{i})+\tilde{p}_{i},
$$
where $(\tilde{\cdot}){k}$ denotes the average of the average, meaning $\begin{array}{r}{\tilde{p}{i}=\frac{1}{|w|}\sum_{k\in w_{i}}\bar{p}{k}}\end{array}$ . The unsharp mask filtering is defined as $\hat{I}=\alpha\left(I-L(I)\right)+I,$ , where $L(\cdot)$ is a low-pass filter such as the Gaussian filter. Eq. (4) looks like unsharping mask filter, where sharpening mask $\left({{I}{i}}-{{\bar{I}}_{i}}\right)$ from the guidance image is added to the averaged target image. The filter strength is controlled by $\alpha$ .
其中 $(\tilde{\cdot}){k}$ 表示平均值的平均,即 $\begin{array}{r}{\tilde{p}{i}=\frac{1}{|w|}\sum_{k\in w_{i}}\bar{p}{k}}\end{array}$。非锐化掩模滤波定义为 $\hat{I}=\alpha\left(I-L(I)\right)+I,$ ,其中 $L(\cdot)$ 是低通滤波器(如高斯滤波器)。式(4)类似于非锐化掩模滤波器,其将引导图像的锐化掩模 $\left({{I}{i}}-{{\bar{I}}_{i}}\right)$ 叠加到平均后的目标图像上。滤波强度由 $\alpha$ 控制。
In their pioneering work [26], Zhang et al. adopted the guided filter in the segmentation network and suggested incorporating the attention map $M$ into the minimization problem to estimate $a$ and $b$ :
在开创性研究[26]中,Zhang等人将引导滤波器应用于分割网络,并提出将注意力图$M$纳入最小化问题来估计$a$和$b$:
$$
E(a_{k},b_{k})=\sum_{i\in w_{k}}\left(M_{i}^{2}\left(a_{k}I_{d i}+b_{k}-g_{i}\right)^{2}+\mu a_{k}^{2}\right).
$$
$$
E(a_{k},b_{k})=\sum_{i\in w_{k}}\left(M_{i}^{2}\left(a_{k}I_{d i}+b_{k}-g_{i}\right)^{2}+\mu a_{k}^{2}\right).
$$
In Eq. (5), the $I_{d i}$ is the down sampled input feature from encoding parts, and the $g_{i}$ is the gating signal from upward path at the decoding parts. Eq. (5) implies that an improved attention map can lead to better solutions. In the following, we are going to propose a method that can generate an improved attention map with full-scale information.
在式(5)中,$I_{di}$是来自编码部分的下采样输入特征,$g_{i}$是解码部分上采样路径的门控信号。式(5)表明改进的注意力图可以带来更好的解决方案。接下来,我们将提出一种能够生成具有全尺度信息的改进注意力图的方法。
2.2. Network architecture
2.2. 网络架构
As can be seen in Figure 2, the proposed network basically follows the U-Net architecture but has an additional guided convolution block after the feature representation network, unlike usual U-Net based structures. Contrary to the standard U-Net consisting of five stages, we have opted for four stages in FSG-Net based on the assumption that a wider receptive field is less critical for retinal vessel segmentation.
如图 2 所示,该网络基本遵循 U-Net 架构,但与常见的基于 U-Net 的结构不同,它在特征表示网络后增加了一个引导卷积块。不同于标准 U-Net 的五阶段设计,我们基于"视网膜血管分割对宽感受野需求较低"的假设,在 FSG-Net 中采用了四阶段结构。
As described in the left part of FSG-Net, which is called the feature representation network, the input layer of the down-convolution is concatenated with a separate convolution from the other layers. These preserved features are then connected to the up-convolution layer. The deep bottleneck structure of the convolution block, indicated by the thick arrows, delivers a more enhanced feature representation. In the feature representation network, the key area to note is the feature merging section, indicated by the red dashed box. In this feature merging process, features from three paths—the current, upper, and lower stages—are concatenated and passed through a newly designed convolution block before being forwarded to the subsequent stages. This approach allows the integration and transmission of information across all scales.
如FSG-Net左侧部分所示,该模块称为特征表示网络 (feature representation network) ,其下采样卷积层的输入层与其他层的独立卷积相拼接。这些保留的特征随后连接到上采样卷积层。由粗箭头标示的卷积块深度瓶颈结构能提供更强大的特征表示能力。在特征表示网络中,需重点关注红色虚线框标注的特征融合区域。该融合过程将当前阶段、上层阶段和下层阶段的三路特征拼接后,通过新设计的卷积块处理,再传递至后续阶段。这种方法实现了跨所有尺度的信息整合与传递。
In the right part of the model, namely the guided convolution block, compressed features reflecting full scale information are given as the current stage input to the guided residual module (GRM). Up-stage input from the higher stage is given as another input for guided filtering. After GRM, predictions are derived through convolution and activation. For training, a combination of the dice loss and
在模型的右侧部分,即引导卷积块中,反映全尺度信息的压缩特征作为当前阶段输入被提供给引导残差模块(GRM)。来自更高阶段的上游输入作为引导滤波的另一个输入。经过GRM处理后,通过卷积和激活操作得到预测结果。训练时采用dice损失与...
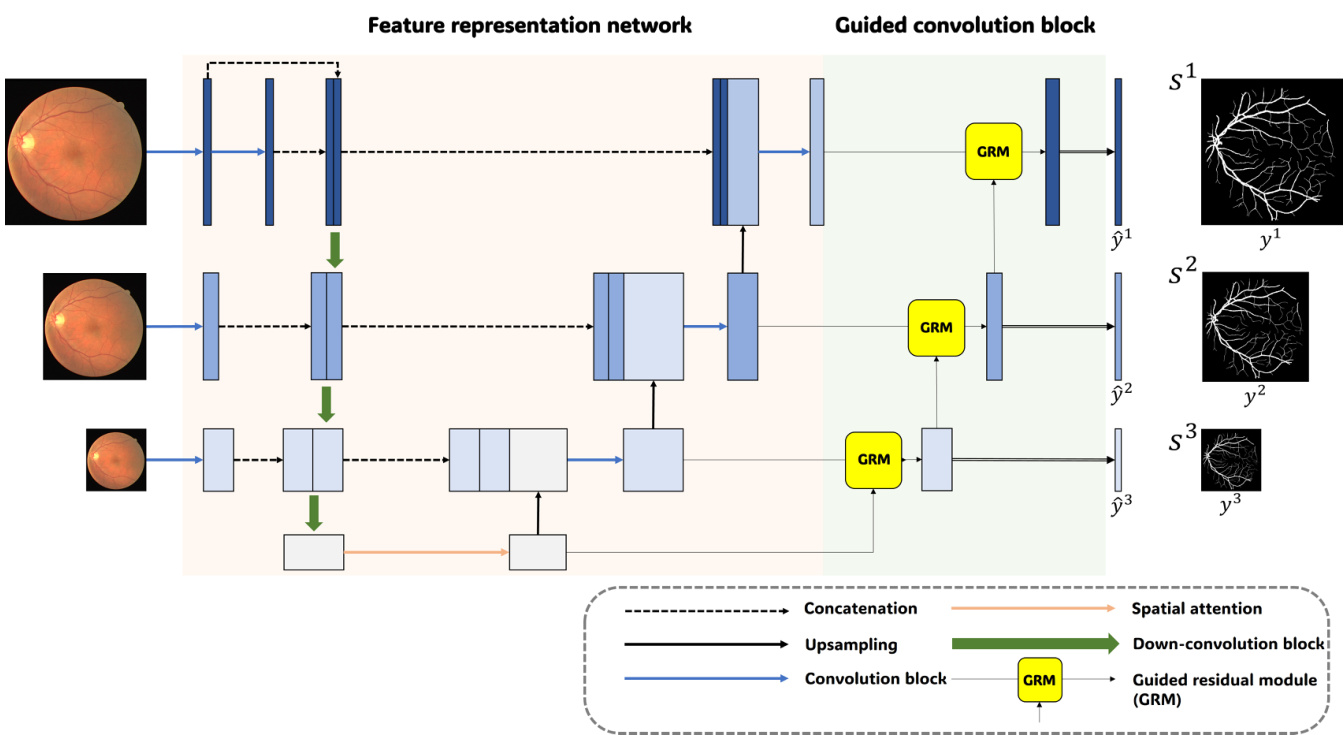
Figure 2. Network architecture of the proposed FSG-Net.
图 2: 提出的FSG-Net网络架构。
BCE loss was employed to improve segmentation performance of the edge-like structures [7]:
采用BCE损失函数提升边缘状结构的分割性能 [7]:
$$
L_{\mathrm{DS}}=\sum_{d=1}^{D}\sum_{i=0}^{S^{d}}\left(y_{i}\log\hat{y}{i}^{d}+(1-y_{i})\log(1-\hat{y}_{i}^{d})\right),
$$
$$
L_{\mathrm{DS}}=\sum_{d=1}^{D}\sum_{i=0}^{S^{d}}\left(y_{i}\log\hat{y}{i}^{d}+(1-y_{i})\log(1-\hat{y}_{i}^{d})\right),
$$
$$
L_{D i c e}=1-\sum_{d=1}^{D}\sum_{i=1}^{S^{d}}\frac{2\left(y_{i}\cdot\hat{y}{i}^{(d)}\right)}{y_{i}+\hat{y}_{i}^{(d)}+\epsilon},
$$
$$
L_{D i c e}=1-\sum_{d=1}^{D}\sum_{i=1}^{S^{d}}\frac{2\left(y_{i}\cdot\hat{y}{i}^{(d)}\right)}{y_{i}+\hat{y}_{i}^{(d)}+\epsilon},
$$
$$
L_{t o t a l}=L_{D S}+L_{D i c e},
$$
$$
L_{t o t a l}=L_{D S}+L_{D i c e},
$$
where $S$ denotes the indices and $\scriptstyle L_{D i c e}$ for Dice loss over pixels. For deep-supervision, $D$ represents the number of layers, the prediction at layer $d$ , and weights for each layer, respectively.
其中 $S$ 表示索引,$\scriptstyle L_{D i c e}$ 为像素级的Dice损失。对于深度监督,$D$ 分别表示层数、第 $d$ 层的预测结果以及各层的权重。
Lastly, we can consider the s cal ability of the proposed architecture. The feature representation network can be replaced by other U-Net variants, enabling integration with the guided convolution block. For instance, we can consider integrating with FR-UNet [15], which proposes alternative methods for utilizing full-scale information.
最后,我们可以考虑所提出架构的可扩展性。特征表示网络可替换为其他U-Net变体,从而与引导卷积块集成。例如,可以考虑与FR-UNet [15] 集成,该研究提出了利用全尺度信息的替代方法。
2.3. Modernized convolution block
2.3. 现代化卷积块
The standard U-Net has a fundamental structure comprising skip connections and double convolution blocks. Recent studies have shown that incorporating different CNN structures can significantly improve the performance of the original model [16, 9]. Inspired by the ConvNeXt [16], we have designed a convolutional block suitable for retinal vessel segmentation.
标准U-Net的基础结构包含跳跃连接和双重卷积块。近期研究表明,融入不同的CNN结构能显著提升原始模型性能 [16, 9]。受ConvNeXt [16] 启发,我们设计了一个适用于视网膜血管分割的卷积块。
Figure 3(a) and (b) represent the depthwise residual block and inverted residual block, respectively. Figure 3(c) shows the proposed convolution block. The structure of the block is an extension of the latest advancements in convolutional block development, characterized by features such as $1\times1$ convolution, inverted bottleneck, and depth-wise convolution. Like other modernized convolution blocks, the proposed block employs a convolution with kernel size 2 and stride 2 in the first stage. By incorporating spatial and dimensional changes within the first block, we enable the design of a deep bottleneck stage in the down-convolution structure. This approach not only increases the information on the feature but also separates it from the bottleneck, allowing for more detailed feature representation. Furthermore, to maintain linearity, we utilize unique ReLU activa- tion between each inverted residual block. For regularization purposes, we employ a learnable gamma parameter and apply a drop block before joining the identity block.
图 3(a) 和 (b) 分别展示了深度残差块 (depthwise residual block) 和倒残差块 (inverted residual block)。图 3(c) 展示了提出的卷积块结构。该模块是对卷积块开发最新进展的扩展,具有 $1\times1$ 卷积、倒置瓶颈 (inverted bottleneck) 和深度卷积 (depth-wise convolution) 等特征。与其他现代化卷积块类似,该模块在第一阶段采用了核大小为2、步长为2的卷积操作。通过在首个模块内融入空间和维度变化,我们实现了下采样卷积结构中深度瓶颈阶段的设计。这种方法不仅增加了特征信息量,还将其与瓶颈区分开,从而实现更精细的特征表示。此外,为保持线性特性,我们在每个倒残差块之间采用了独特的ReLU激活函数。出于正则化目的,我们使用了可学习的gamma参数,并在连接恒等块前应用了drop block技术。
2.4. Guided convolution block
2.4. 引导卷积块
As shown in Figure 2, the guided convolution block consists of GRM to refine the input from the feature representation network and a convolution to output the prediction map. Figure 4 shows the overall process of GRM. The purpose of GRM is to refine the feature from the feature represent ation network at the same stage. In GRM, both the features at the current stage and at the higher stage are used to generate an attention map, and then the attention map is multiplied with the current feature to generate the output, which is described in the right part of Figure 4. Here we can expect an improved attention map $M$ can be estimated to solve Eq. (5) because the input feature from the feature representation network has full scale information. To further enhance the feature refinement, a residual block is introduced after the attention-guided filtering, as shown in the left part of Figure 4. By passing the features through the residual block, a stable map is generated for both the deep supervision and subsequent layers. Moreover, we incorporate a $1\times1$ convolution to preserve the semantic information present in the feature maps.
如图 2 所示,引导卷积块由 GRM (Guided Refinement Module) 和用于输出预测图的卷积层组成。图 4 展示了 GRM 的整体流程。GRM 的作用是对同阶段特征表示网络输出的特征进行细化。在 GRM 中,当前阶段和高阶特征共同生成注意力图,随后该注意力图与当前特征相乘产生输出 (如图 4 右侧所示)。由于来自特征表示网络的输入特征包含完整尺度信息,我们可以预期通过改进的注意力图 $M$ 来求解公式 (5)。为进一步增强特征细化能力,在注意力引导滤波后引入了残差块 (如图 4 左侧所示)。特征经过残差块处理后,会生成同时适用于深度监督和后续层的稳定特征图。此外,我们还采用 $1\times1$ 卷积来保留特征图中的语义信息。
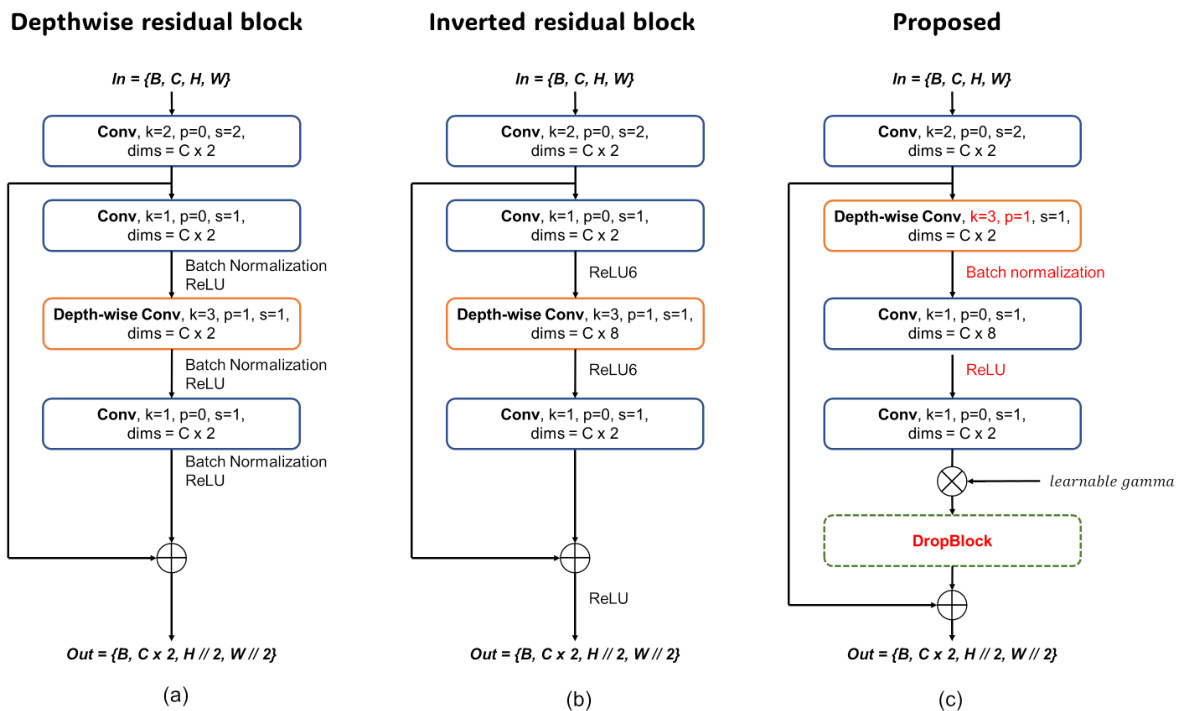
Figure 3. The evolutionary structure from (a): Depthwise residual block, (b): Inverted residual block to (c): The proposed convolutio block.
图 3: 从 (a) 深度残差块, (b) 逆残差块到 (c) 所提出的卷积块的演进结构。
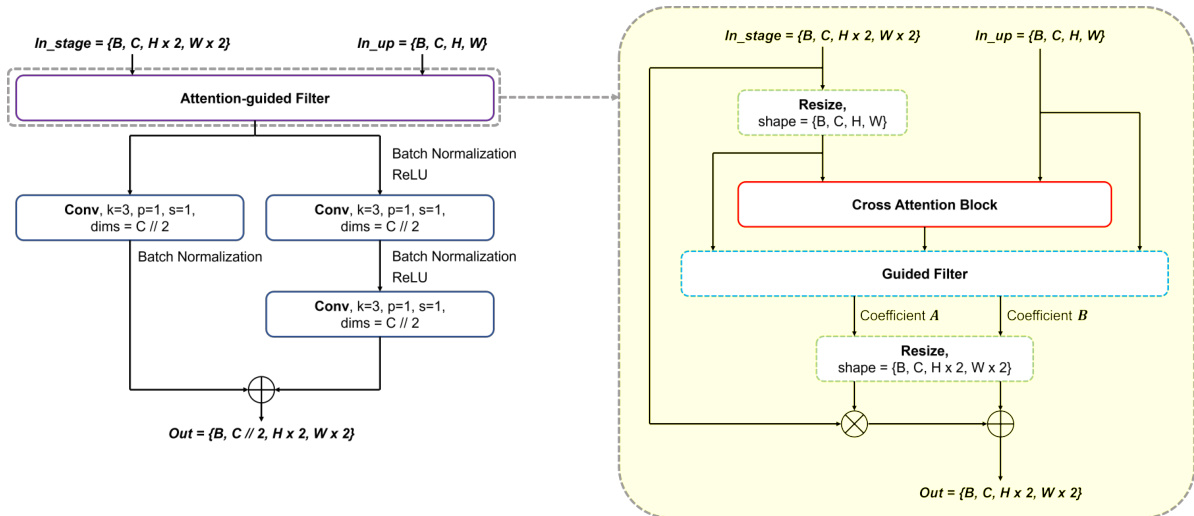
Figure 4. Detailed structure of guided residual module (GRM)
图 4: 引导残差模块 (GRM) 的详细结构
3. Experiments
3. 实验
3.1. Training Techniques
3.1. 训练技术
In retinal vessel segmentation, the performance of studies is often determined by subtle gaps. We believe that these subtle gaps are highly influenced by the choice of hyperparameters and training/inference environment. To address this imbalance, we fixed all hyper parameters for training and inference. We empirically found that Rand Augment [6] with a specific scale did not work well on medical datasets; therefore, we customized it to better suit our datasets. Training techniques include blur, color jitter, horizontal flip, perspective transformation, resize, crop, and CutMix [25].
在视网膜血管分割任务中,研究性能往往由细微差距决定。我们认为这些细微差距很大程度上受超参数选择及训练/推理环境影响。为解决这种不平衡性,我们固定了所有训练和推理阶段的超参数。通过实验发现,特定尺度的Rand Augment [6]在医学数据集上表现不佳,因此我们对其进行了定制化调整以更好地适配我们的数据集。训练技术包括模糊处理、色彩抖动、水平翻转、透视变换、尺寸调整、裁剪以及CutMix [25]。
Table 1. Train settings and hyper-parameters.
表 1: 训练设置与超参数。
| 超参数 | 值 |
|---|---|
| 基础学习率 (base lr) | 1e-3 |
| 学习率调度器 (lr scheduler) | 余弦退火 (Cosine annealing) |
| 学习率调度器预热轮数 (lr scheduler warm-up epochs) | 20 |
| 学习率调度器周期轮数 (lrscheduler cycleepochs) | 100 |
| 学习率调度器最小学习率 (lrscheduleretamin) | 1e-5 |
| 早停轮数 (earlystopepochs) | 400 |
| 早停指标 (earlystopmetric) | F1分数 (F1 score) |
| 优化器 (optimizer) | AdamW |
| 优化器动量 (optimizermomentum) | β1,β2=0.9,0.999 |
| 权重衰减 (weightdecay) | 0.05 |
| 损失函数 (criterion) | Dice +BCE |
| 二值化阈值 (binary threshold) | 0.5 |
| 批量大小 (batch size) | 4 |
| 随机裁剪 (random crop) | 288 |
| 随机模糊 (random blur) | 概率=0.8 |
| 随机抖动 (random jitter) | 概率=0.8 |
| 随机水平翻转 (random horizontalflip) | 概率=0.5 |
| 随机透视变换 (random perspective) | 概率=0.3 |
| 随机缩放 (randomrandomresize) | 概率=0.8 |
| CutMix | n=1, 概率=0.8 |
3.2. Implementation Details
3.2. 实现细节
Our experimental environment comprises an Intel Xeon Gold 5220 processor, a Tesla V100-SXM2-32GB GPU, Pytorch 1.13.1, and CUDA version 11.7. The inference time for FSG-Net-L was approximately $600m s$ for an input size of (608, 608) using a GPU-synchronized flow. To address as much variability as possible, we re-implemented comparison studies and integrated them into a single environment. To ensure experimental fairness, certain hyper parameters, including the framework, loss function, metric, data augmentation, and random seed, were fixed to measure the robustness of the model. Our training settings followed the hyper parameters in Table 1, used for segmentation tasks in ADE20K multiscale learning in ConvNeXt [16].
我们的实验环境包括Intel Xeon Gold 5220处理器、Tesla V100-SXM2-32GB GPU、Pytorch 1.13.1和CUDA 11.7版本。在使用GPU同步流程处理(608, 608)输入尺寸时,FSG-Net-L的推理时间约为$600m s$。为了尽可能覆盖各种变量,我们重新实现了对比研究并将其整合到统一环境中。为确保实验公平性,固定了包括框架、损失函数、评估指标、数据增强和随机种子在内的超参数,以测量模型鲁棒性。训练设置遵循表1中用于ConvNeXt [16]在ADE20K多尺度学习分割任务的超参数。
表1:
To evaluate the compared models under the same conditions, we prioritized the search for an optimized model in our training settings. For example, the learning rate can affect the gradient updating and training time, depending on the model’s parameter size and depth. Training for a predetermined number of epochs can result in diverging weights for heavy models and, conversely, for light models. Therefore, we chose the optimized model using an early stop based on cycles in the learning rate scheduler. To select the optimized model during the training step, we used the highest F1 score [27], with an early stop of 400 epochs. To balance exploitation and exploration in the learning parameters, we stack the batch to have more than two sets of minibatches in one epoch with a learning rate scheduler. The detailed hyper-parameters are described in Table 1. With these experimental settings, the performance of the pure UNet dramatically increased and even surpassed that of some recent studies, as shown in Table 2.
为了在相同条件下评估对比模型,我们优先在训练设置中寻找优化模型。例如,学习率会影响梯度更新和训练时间,具体取决于模型的参数量和深度。对于重型模型,固定训练轮数可能导致权重发散,而轻型模型则相反。因此,我们基于学习率调度器的周期采用早停机制来选择优化模型。在训练阶段,我们使用最高F1分数[27]作为选择标准,并设置400轮早停阈值。为平衡学习参数的利用与探索,我们采用批次堆叠技术使每轮训练包含超过两组小批次,并配合学习率调度器。详细超参数如 表 1 所示。实验表明,通过这些设置,纯UNet性能显著提升,甚至超越部分近期研究成果,如 表 2 所示。
3.3. Datasets
3.3. 数据集
The DRIVE dataset comprised 40 retinal images with a resolution of $565\times584$ pixels, captured as part of a retinopathy screening study in the Netherlands. The STARE dataset comprises 20 retinal fundus images with a resolution of $700\times605$ pixels, and the CHASE_DB1 dataset includes 28 retinal images from schoolchildren with a resolution of $999\times960$ pixels. Both the STARE and CHASE_DB1 datasets were manually annotated by two independent experts. We used the annotation of the first expert, named "Hoover A." in STARE and "1stHO" in CHASE_DB1, for our analysis. The HRF dataset comprises 45 images, equally divided into a 1:1:1 ratio of healthy patients, diabetic ret in o paths, and glaucoma to us patients, with a high resolution of $3504\times2336$ pixels. To measure the performance of the models, it is necessary to divide the data into training and validation sets. As the retinal vessel segmentation dataset was relatively limited, we split the data into a 1:1 ratio of the training and validation sets. The DRIVE dataset was officially divided into training and validation sets, each containing 20 images. For the STARE, CHASE_DB1, and HRF datasets, we used the first half as training and the remaining half as valiation.
DRIVE数据集包含40张分辨率为$565\times584$像素的视网膜图像,采集自荷兰的一项视网膜病变筛查研究。STARE数据集包含20张分辨率为$700\times605$像素的视网膜眼底图像,CHASE_DB1数据集包含28张学龄儿童视网膜图像,分辨率为$999\times960$像素。STARE和CHASE_DB1数据集均由两名独立专家手动标注。我们采用STARE中标注者"Hoover A."和CHASE_DB1中标注者"1stHO"的标注结果进行分析。HRF数据集包含45张图像,按1:1:1比例分为健康患者、糖尿病视网膜病变患者和青光眼患者三组,分辨率为$3504\times2336$像素的高清图像。
为评估模型性能,需将数据划分为训练集和验证集。由于视网膜血管分割数据集规模有限,我们采用1:1比例划分。DRIVE数据集已官方划分为各含20张图像的训练集和验证集。对于STARE、CHASE_DB1和HRF数据集,我们采用前50%作为训练集,剩余50%作为验证集。
3.4. Results
3.4. 结果
In binary task evaluations, the Matthew correlation coefficient (MCC) is a powerful metric, as noted by Chicco et al. [4]. However, to avoid evaluations oriented towards a specific metric, we also report the average rank of each model, denoted as "Rank Avg" in Table 2. This average rank provides a measure of the stable performance of a model across different datasets. For example, FSG-Net, U $\mathrm{Net}3+$ [13], and AttU-Net [17] achieved high ranks in all three datasets, whereas ResU-Net and FR-UNet recorded inconsistent results across the three datasets. FSG-Net achieved the highest rank in terms of performance across all three datasets, recording dominant scores in mIoU, F1 score, and MCC, which is equivalent to a detailed expression of the segmentation map. Notably, FSG-Net outperformed the DRIVE dataset, recording SOTA in the F1 score and sensitivity. Figure 5 represents the predicted segmentation maps of the three best models in our evaluation metrics. The FSG-Net shows the best results, especially in segmenting thin vessels. FSG-Net incorporates deep supervision, which allows for the extraction of segmentation maps at each stage. Figure 6 shows the vessel detection results at various stages. It can be observed that as we move to lower levels, the performance in detecting thinner vessels improves. An interesting point is that even at coarse stage $S_{3}$ , the detection of thicker vessels is generally wellmaintained.
在二分类任务评估中,Matthews相关系数 (MCC) 是一项强有力的指标,正如Chicco等人[4]所指出的那样。然而,为了避免针对特定指标的评估,我们还报告了每个模型的平均排名,如表2中的"Rank Avg"所示。这一平均排名衡量了模型在不同数据集上的稳定表现。例如,FSG-Net、U $\mathrm{Net}3+$ [13]和AttU-Net [17]在所有三个数据集中均获得较高排名,而ResU-Net和FR-UNet在三个数据集中的结果不一致。FSG-Net在三个数据集上的性能排名最高,在mIoU、F1分数和MCC上均取得主导性分数,这相当于对分割图的详细表达。值得注意的是,FSG-Net在DRIVE数据集上表现优异,在F1分数和灵敏度上创下了SOTA记录。图5展示了我们评估指标中三个最佳模型的预测分割图。FSG-Net显示出最佳结果,尤其是在分割细小血管方面。FSG-Net采用了深度监督机制,能够在每个阶段提取分割图。图6展示了不同阶段的血管检测结果。可以观察到,随着层级降低,检测更细血管的性能有所提升。一个有趣的现象是,即使在粗糙阶段 $S_{3}$,较粗血管的检测通常也能保持良好。
In the inference settings, we padded the original image with a multiple of 32 to preserve the flexible operation of specific models. Resizing the shape can lead to informational loss, which is critical in retinal vessel segmentation that requires high-fidelity maps. When measuring the metrics, we again removed the padding to generate a perfectly similar shape to the original image with no informational loss. With this unpadding trick, metrics that require true negatives and false negatives can be decreased compared with padded or resized images. Remarkably, the majority of models examined in our study exhibited superior performance compared to their original implementations in our training settings. For example, AG-Net achieved better performance on the DRIVE dataset (cIoU:69.71, Sen:82.16) in our environment than the results reported in the original paper (cIoU:69.65, Sen:81.00). Furthermore, U-Net, despite being an early model introduced over a decade ago, demonstrated robustness by achieving middle-range performance using only pure convolution layers.
在推理设置中,我们将原始图像填充为32的倍数以保留特定模型的灵活操作。调整形状可能导致信息丢失,这在需要高保真图的视网膜血管分割中至关重要。测量指标时,我们再次移除填充以生成与原始图像完全一致的形状,确保零信息损失。通过这种去填充技巧,相较于填充或调整尺寸的图像,需要真阴性和假阴性的指标值得以降低。值得注意的是,我们研究中检验的大多数模型在训练设置中表现优于其原始实现。例如,AG-Net在我们的DRIVE数据集测试中(cIoU:69.71, Sen:82.16)表现优于原论文报告结果(cIoU:69.65, Sen:81.00)。此外,尽管U-Net是十多年前提出的早期模型,仅使用纯卷积层就实现了中游性能,展现出卓越的鲁棒性。
表 2: 各数据集上的指标对比结果
| 数据集 | 架构 | mIoU | F1分数 | Acc AUC | Sen | MCC | Rank Avg | 排名 |
|---|---|---|---|---|---|---|---|---|
| DRIVE | U-Net | 83.857 | 82.956 | 97.013 | 97.853 | 83.449 | 81.456 | 5 |
| U-Net++ | 81.228 | 79.564 | 96.524 | 96.271 | 77.802 | 77.830 | 13 | |
| U-Net3+ Deep | 83.909 | 83.030 | 97.017 | 98.082 | 83.721 | 81.520 | 3.1 | |
| ResU-Net | 83.862 | 82.953 | 97.021 | 97.766 | 83.226 | 81.453 | 5.8 | |
| ResU-Net++ | 83.729 | 82.783 | 97.001 | 97.708 | 82.791 | 81.263 | 9.1 | |
| SAU-Net | 83.368 | 82.334 | 96.925 | 97.616 | 82.311 | 80.782 | 11.2 | |
| DCASU-Net | 83.743 | 82.808 | 96.996 | 97.838 | 83.080 | 81.290 | 7.8 | |
| AG-Net | 83.176 | 82.111 | 96.882 | 97.628 | 82.155 | 80.540 | 11.8 | |
| AttU-Net | 83.958 | 83.080 | 97.039 | 97.844 | 83.422 | 81.584 | 3.2 | |
| R2U-Net | 83.555 | 82.580 | 96.952 | 97.879 | 82.961 | 81.038 | 8.8 | |
| ConvU-NeXt | 83.800 | 82.882 | 97.012 | 97.835 | 83.019 | 81.367 | 7.2 | |
| FR-UNet | 83.884 | 82.995 | 97.007 | 98.158 | 83.869 | 81.485 | 3.8 | |
| FSG-Net-L (ours) | 84.068 | 83.229 | 97.042 | 98.235 | 84.207 | 81.731 | 1 | |
| STARE | U-Net | 85.924 | 84.873 | 97.754 | 98.341 | 84.361 | 83.713 | 3.3 |
| U-Net++ | 81.514 | 79.061 | 97.022 | 94.479 | 75.539 | 77.764 | 12.8 | |
| U-Net3+ Deep | 85.824 | 84.829 | 97.707 | 99.146 | 85.522 | 83.626 | 3.5 | |
| ResU-Net | 85.964 | 84.872 | 97.767 | 98.050 | 83.997 | 83.726 | 3.5 | |
| ResU-Net++ | 83.185 | 81.358 | 97.319 | 95.221 | 78.456 | 80.196 | 11.7 | |
| SAU-Net | 85.158 | 84.061 | 97.604 | 97.784 | 84.015 | 82.885 | 7 | |
| DCASU-Net | 84.423 | 83.064 | 97.454 | 98.362 | 83.583 | 81.771 | 8.8 | |
| AG-Net | 84.811 | 83.766 | 97.565 | 98.403 | 83.347 | 82.516 | 7.7 | |
| AttU-Net | 85.848 | 84.772 | 97.694 | 99.050 | 86.226 | 83.588 | 3.8 | |
| R2U-Net | 83.727 | 81.786 | 97.468 | 93.457 | 77.048 | 80.810 | 11.3 | |
| ConvU-NeXt | 85.339 | 84.186 | 97.658 | 97.866 | 83.401 | 82.998 | 6.7 | |
| FR-UNet | 84.815 | 83.496 | 97.577 | 96.637 | 81.872 | 82.327 | 9.2 | |
| FSG-Net-L (ours) | 86.118 | 85.100 | 97.746 | 98.967 | 86.608 | 83.958 | 1.7 | |
| CHASE_DB1 | U-Net | 82.065 | 80.159 | 97.404 | 99.368 | 85.370 | 79.002 | 6 |
| U-Net++ | 81.512 | 79.415 | 97.321 | 99.362 | 84.143 | 78.201 | 8.2 | |
| U-Net3+ Deep | 82.489 | 80.697 | 97.483 | 99.506 | 85.740 | 79.558 | 2.7 | |
| ResU-Net | 82.254 | 80.368 | 97.483 | 99.329 | 83.916 | 79.161 | 5.3 | |
| ResU-Net++ | 81.104 | 78.810 | 97.320 | 99.278 | 81.311 | 77.479 | 11.5 | |
| SAU-Net | 73.276 | 67.411 | 95.966 | 96.223 | 67.782 | 65.593 | 13 | |
| DCASU-Net | 81.335 | 79.100 | 97.338 | 99.407 | 82.265 | 77.802 | 8.8 | |
| AG-Net | 82.158 | 80.272 | 97.440 | 99.544 | 84.817 | 79.070 | 4.2 | |
| AttU-Net | 82.562 | 80.742 | 97.546 | 99.430 | 83.907 | 79.537 | 3.3 | |
| R2U-Net | 81.250 | 78.944 | 97.384 | 98.792 | 80.054 | 77.625 | 10.8 | |
| ConvU-NeXt | 81.752 | 79.704 | 97.405 | 99.402 | 83.009 | 78.439 | 7 | |
| FR-UNet | 81.330 | 79.170 | 97.269 | 99.544 | 84.744 | 77.944 | 7.7 | |
| FSG-Net-L (ours) | 82.680 | 81.019 | 97.515 | 99.378 | 85.995 | 79.899 | 2.2 | |
| HRF | U-Net3+ Deep | 82.291 | 81.329 | 97.093 | 98.571 | 82.756 | 79.868 | 4.8 |
| U-Net | 82.653 | 80.995 | 97.040 | 98.450 | 82.402 | 79.522 | 7.6 |

Figure 5. Qualitative evaluation on top-3 model structure on DRIVE validation set.
图 5: DRIVE验证集上top-3模型结构的定性评估。
3.5. Ablation study
3.5. 消融实验
To further understand the impact of the model capacity and structure on FSG-Net, we conducted ablation studies. In Table 3, we vary the depth of the down-convolution, base channel (Base_c) and structure. The F1 score of three datasets is used as a metric here. The results showed that even the smallest version of FSG-Net surpassed the other models. By comparing the scores in Table 2, the smallest FSG-Net with 1.17M parameters outperformed recent studies with an average rank of 5.2 across all metrics on the three datasets, compared to SAU-Net’s rank of 9.0 with a parameter size of 0.5M, DCASU-Net’s [24] rank of 7.0 with a parameter size of 2.6M, ConvU-NeXt’s rank of 6.7 with a parameter size of 3.5M, and FR-UNet’s rank of 6.6 with a parameter size of 7.4M.
为了进一步理解模型容量和结构对FSG-Net的影响,我们进行了消融实验。在表3中,我们改变了降卷积的深度、基础通道数(Base_c)和结构。此处使用三个数据集的F1分数作为评估指标。结果表明,即使是最小版本的FSG-Net也超越了其他模型。通过对比表2中的分数,参数量仅1.17M的最小FSG-Net在三个数据集所有指标上的平均排名为5.2,优于近期研究成果:参数量0.5M的SAU-Net排名9.0、参数量2.6M的DCASU-Net[24]排名7.0、参数量3.5M的ConvU-NeXt排名6.7,以及参数量7.4M的FR-UNet排名6.6。

Figure 6. Inspection on output map at each stage $S_{i}$ on FSG-Net. The finer scale of map describes more detailed lines.
图 6: FSG-Net各阶段 $S_{i}$ 输出图的检测结果。更精细的尺度图能呈现更详细的线条特征。
Table 3. Ablation studies on model capacity and model structure
表 3. 模型容量与模型结构的消融研究
| 模型 | Base_c | Depth | 参数量 (M) | DRIVE | STARE | CHASE_DB1 |
|---|---|---|---|---|---|---|
| FSG-Net-L | 64 | [3, 3, 9, 3] | 18.32 | 83.229 | 85.100 | 81.019 |
| FSG-Net-B | 64 | [2, 2, 6, 2] | 14.46 | 83.191 | 84.934 | 79.658 |
| FSG-Net-S | 48 | [3, 3, 9, 3] | 10.33 | 83.145 | 84.917 | 80.529 |
| FSG-Net-T | 32 | [3, 3, 9, 3] | 4.61 | 83.098 | 84.698 | 79.982 |
| FSG-Net-N | 16 | [3, 3, 9, 3] | 1.17 | 82.904 | 84.692 | 79.431 |
| 结构 | ||||||
| 核尺寸 3 到 7 | 35.77 | 83.006 | 84.200 | 80.044 | ||
| AGF 转 AttU-Net 风格 | 19.61 | 83.115 | 84.671 | 79.333 | ||
| 下采样卷积转残差 | 45.60 | 82.893 | 82.734 | 75.765 | ||
| 无深度监督 | 18.32 | 83.131 | 84.698 | 79.889 | ||
| 移除空间注意力 | 18.32 | 83.237 | 84.598 | 79.946 |
To optimize the network structure, we investigated the impact of increasing the kernel size, replacing the attentionguided filter with a simple attention block, and the effect of using pure residual blocks or removing the spatial attention. Our findings show that while increasing the kernel size expands the receptive field, it fails to improve performance in retinal vessel segmentation tasks that require detailed expression of the segmentation map. We found that the attention-guided filter proved to be robust and effective for this task. Additionally, we observed that using pure residual blocks in the deep bottleneck stage increases the parameter size and reduces computational efficiency without significantly improving feature extraction. Removing the spatial attention improved the performance in the DRIVE dataset; however, as the input size increased, the performance decreased proportionally.
为优化网络结构,我们研究了增大卷积核尺寸、用简单注意力模块替换注意力引导滤波器、以及使用纯残差块或移除空间注意力带来的影响。实验表明:虽然增大卷积核能扩展感受野,但在需要精细表达分割图的视网膜血管分割任务中无法提升性能。注意力引导滤波器被证实对该任务具有稳健高效性。此外,我们发现深度瓶颈阶段使用纯残差块会增大参数量并降低计算效率,却未显著改善特征提取能力。移除空间注意力在DRIVE数据集上表现提升,但随着输入尺寸增大,性能呈现比例性下降。
4. Discussion
4. 讨论
We previously emphasized the method of feature merging within the network architecture. This is because feature merging allows information from all stages to be mixed and provided as input to the guided filtering module. This approach can be compared to AG-Net, which also gathers features and provides them to the guided filter. Figure 7(a) illustrates the feature merging in the proposed method, while Figure 7(b) shows the corresponding part of AG-Net. Let us focus on the left path to the guided filtering modules in both cases. As can be seen in Figure 7(a), feature maps from three stages (current, upward, and downward) are concatenated and passed through the proposed convolution block. For AG-Net, only the features from the current and lower stages are merged for the attention-guided filter. In summary, our GRM gets feature information from all stages with a modernized convolution, while the AG-Net gets it from current and lower stages with conventional convolutions. For this reason, we were able to achieve superior performance with one fewer stage than AG-Net.
我们之前强调了网络架构中的特征合并方法。这是因为特征合并允许混合所有阶段的信息,并将其作为输入提供给引导滤波模块。这种方法可以与AG-Net进行比较,后者也收集特征并将其提供给引导滤波器。图7(a)展示了所提出方法中的特征合并,而图7(b)显示了AG-Net的对应部分。让我们关注两种情况下通往引导滤波模块的左侧路径。如图7(a)所示,来自三个阶段(当前、向上和向下)的特征图被拼接并通过提出的卷积块。对于AG-Net,只有来自当前和较低阶段的特征被合并用于注意力引导滤波器。总之,我们的GRM通过现代化的卷积从所有阶段获取特征信息,而AG-Net通过传统卷积从当前和较低阶段获取特征信息。因此,我们能够以比AG-Net少一个阶段的架构实现更优的性能。
The next discussion point concerns the experimental datasets. DRIVE, STARE, and Chase_DB1 are representative datasets for retinal vessel segmentation. Models that improve the architecture of layers and attention mechanisms continue to emerge, but the number of images in such datasets is limited. Although this paper focuses on retinal vessel segmentation, it is necessary to apply the proposed model to large databases from other fields to verify its variability and s cal ability. In our future work, we can consider expanding our application areas to include crack detection, facial wrinkle detection, and general medical imaging.
接下来的讨论点涉及实验数据集。DRIVE、STARE和Chase_DB1是视网膜血管分割的代表性数据集。虽然不断涌现出改进网络层结构和注意力机制的模型,但此类数据集的图像数量有限。尽管本文聚焦于视网膜血管分割,仍需将所提模型应用于其他领域的大型数据库,以验证其变异性和可扩展性。在未来的工作中,我们可以考虑将应用领域扩展至裂纹检测、面部皱纹检测及通用医学影像分析。

Figure 7. Compared structure of feature merging in (a) FSG-Net, and (b) AG-Net.
图 7: 特征融合结构对比:(a) FSG-Net,(b) AG-Net。
5. Conclusion
5. 结论
In this study, we presented a full-scale representation guided network for retinal vessel segmentation that achieves SOTA on the DRIVE dataset. A modern convolutional block tailored for retinal vessel segmentation was designed, and the guided convolution block maximized performance using full-scale information from the feature representation network. The proposed guided convolution block is compatible with any U-Net architecture, offering s cal ability for similar tasks across various domains. We encourage future research to use the FSG-Net architecture and our experimental settings to ensure reproducibility and s cal ability in similar tasks.
本研究提出了一种用于视网膜血管分割的全尺度表征引导网络,在DRIVE数据集上达到了SOTA性能。我们设计了一个专为视网膜血管分割定制的现代卷积模块,该引导卷积块通过利用特征表征网络的全尺度信息实现了性能最大化。所提出的引导卷积块可与任何U-Net架构兼容,为跨领域相似任务提供了可扩展性。我们建议未来研究采用FSG-Net架构及本实验设置,以确保相似任务的可复现性和可扩展性。