Ch eXclusion: Fairness gaps in deep chest X-ray class if i ers
Ch eXclusion: 深度胸部X光分类器中的公平性差距
Machine learning systems have received much attention recently for their ability to achieve expert-level performance on clinical tasks, particularly in medical imaging. Here, we examine the extent to which state-of-the-art deep learning class if i ers trained to yield diagnostic labels from X-ray images are biased with respect to protected attributes. We train convolution neural networks to predict 14 diagnostic labels in 3 prominent public chest X-ray datasets: MIMIC-CXR, Chest-Xray8, CheXpert, as well as a multi-site aggregation of all those datasets. We evaluate the TPR disparity – the difference in true positive rates (TPR) – among different protected attributes such as patient sex, age, race, and insurance type as a proxy for socioeconomic status. We demonstrate that TPR disparities exist in the stateof-the-art class if i ers in all datasets, for all clinical tasks, and all subgroups. A multi-source dataset corresponds to the smallest disparities, suggesting one way to reduce bias. We find that TPR disparities are not significantly correlated with a subgroup’s proportional disease burden. As clinical models move from papers to products, we encourage clinical decision makers to carefully audit for algorithmic disparities prior to deployment. Our code can be found at, https://github.com/La leh Seyyed/Ch eXclusion.
机器学习系统因其在临床任务中实现专家级表现的能力而备受关注,尤其在医学影像领域。本文研究了最先进的深度学习分类器在从X光图像生成诊断标签时,针对受保护属性是否存在偏见。我们训练卷积神经网络来预测3个著名公共胸部X光数据集(MIMIC-CXR、Chest-Xray8、CheXpert)以及这些数据集的多站点聚合中的14个诊断标签。我们评估了不同受保护属性(如患者性别、年龄、种族和作为社会经济地位替代指标的保险类型)之间的真阳性率(TPR)差异。研究表明,在所有数据集、所有临床任务和所有子组中,最先进的分类器均存在TPR差异。多源数据集对应的差异最小,这为减少偏见提供了一种途径。我们发现TPR差异与子组的疾病负担比例无显著相关性。随着临床模型从论文走向产品,我们建议临床决策者在部署前仔细审核算法差异。代码详见 https://github.com/La leh Seyyed/Ch eXclusion。
Keywords: fairness, medical imaging, chest x-ray classifier, computer vision.
关键词:公平性、医学影像、胸部X光分类器、计算机视觉。
1. Introduction
1. 引言
Chest X-ray imaging is an important screening and diagnostic tool for several life-threatening diseases, but due to the shortage of radiologists, this screening tool cannot be used to treat all patients. $^{1,2}$ Deep-learning-based medical image class if i ers are one potential solution, with significant prior work targeting chest X-rays specifically, $^{3,4}$ leveraging large-scale publicly available datasets,3,5,6 and demonstrating radiologist-level accuracy in diagnostic classification.6–8
胸部X光成像是一种重要的筛查和诊断工具,可用于多种危及生命的疾病,但由于放射科医生短缺,该筛查工具无法用于治疗所有患者。$^{1,2}$ 基于深度学习 (deep learning) 的医学图像分类器是一种潜在的解决方案,先前已有大量研究专门针对胸部X光,$^{3,4}$ 利用大规模公开数据集,3,5,6 并在诊断分类中展示了与放射科医生相当的准确性。6–8
Despite the seemingly clear case for implementing AI-enabled diagnostic tools,9 moving such methods from paper to practice require careful thought.10 Models may exhibit disparities in performance across protected subgroups, and this could lead to different subgroups receiving different treatment.11 During evaluation, machine learning algorithms usually optimize for, and report performance on, the general population rather than balancing accuracy on different subgroups. While some variance in performance is unavoidable, mitigating any systematic bias against protected subgroups may be desired or required in a deployable model.
尽管实施AI辅助诊断工具的理由看似明确,但将这些方法从论文转化为实践需要审慎考量。模型可能在受保护亚组间表现出性能差异,这可能导致不同亚组获得不同治疗。在评估过程中,机器学习算法通常针对整体人群进行优化并报告性能,而非平衡不同亚组的准确率。虽然性能差异不可避免,但在可部署模型中,可能需要减轻针对受保护亚组的系统性偏差。
In this paper, we examine whether state-of-the-art (SOTA) deep neural class if i ers trained on large public medical imaging datasets are fair across different subgroups of protected attributes. We train class if i ers on 3 large, public chest X-ray datasets: MIMIC-CXR, $^5$ CheXpert,6 Chest-Xray8,3 as well as an additional datasets formed of the aggregation of those three datasets on their shared labels. In each case, we implement chest X-ray pathology class if i ers via a deep convolutional neural network (CNN) chest X-ray images as inputs, and optimize the multi-label probability of 14 diagnostic labels simultaneously. Because researchers have observed health disparities with respect to race,12 sex,13 age,14 and socioeconomic status,12 we extract structural data on race, sex, and age; we also use insurance type as an imperfect proxy $^{11}$ for socioeconomic status. To our knowledge, we are the first to examine whether SOTA chest X-ray pathology class if i ers display systematic bias across race, age, and insurance type.
本文研究基于大型公共医学影像数据集训练的最先进(SOTA)深度神经网络分类器在不同受保护属性亚组中是否公平。我们在3个大型公共胸部X光数据集(MIMIC-CXR、CheXpert、Chest-Xray8)及其共享标签的合并数据集上训练分类器。每种情况下,我们都采用深度卷积神经网络(CNN)构建胸部X光病理分类器,以胸部X光图像为输入,同时优化14个诊断标签的多标签概率。鉴于已有研究观察到种族、性别、年龄和社会经济地位方面的健康差异,我们提取了种族、性别和年龄的结构化数据,并使用保险类型作为社会经济地位的不完美代理指标。据我们所知,我们是首个探究SOTA胸部X光病理分类器是否存在跨种族、年龄和保险类型的系统性偏差的研究。
We analyze equality of opportunity $^{15}$ as our fairness metric based on the needs of the clinical diagnostic setting. In particular, we examine the differences in true positive rate (TPR) across different subgroups per attributes. A high TPR disparity indicates that sick members of a protected subgroup would not be given correct diagnoses—e.g., true positives—at the same rate as the general population, even in an algorithm with high overall accuracy.
我们基于临床诊断场景的需求,将机会平等$^{15}$作为公平性评估指标。具体而言,我们检测不同属性子组间真阳性率(TPR)的差异。较高的TPR差异意味着,即便在整体准确率较高的算法中,受保护子组中的患病成员获得正确诊断(即真阳性)的概率仍低于普通人群。
We find three major findings: First, that there are indeed extensive patterns of bias in SOTA class if i ers, shown in TPR disparities across datasets. Secondly, the disparity rate for most attributes/ datasets pairs is not significantly correlated with the subgroups’ proportional disease membership. These findings suggest that underrepresented subgroups could be vulnerable to mistreatment in a systematic deployment, and that such vulnerability may not be addressable simply through increasing subgroup patient count. Lastly, we find that using the multi-source dataset which combines all the other datasets yields the lowest TPR disparities, suggesting using multi-source datasets may combat bias in the data collection process. As researchers increasingly apply artificial intelligence and machine learning to precision medicine, we hope that our work demonstrates how predictive models trained on large, well-balanced datasets can still yield disparate impact.
我们发现三个主要结论:首先,最先进分类器确实存在广泛的偏见模式,这体现在不同数据集间的TPR差异上。其次,大多数属性/数据集对的差异率与亚组疾病成员比例没有显著相关性。这些发现表明,在系统化部署中,代表性不足的亚组可能容易受到不当对待,且仅通过增加亚组患者数量可能无法解决这种脆弱性。最后,我们发现使用整合所有其他数据集的多源数据集能产生最低的TPR差异,这表明采用多源数据集可能有助于对抗数据收集过程中的偏见。随着研究人员越来越多地将人工智能和机器学习应用于精准医疗,我们希望这项工作能证明:即使在大型平衡数据集上训练的预测模型,仍可能产生差异性影响。
2. Background and Related Work
2. 背景与相关工作
Fairness and Debiasing. Fairness in machine learning models is a topic of increasing attention, spanning sex bias in occupation class if i ers,16 racial bias in criminal defendant risk assessments algorithms,17 and intersection al sex-racial bias in automated facial analysis.18 Sources of bias arise in many different places along the classical machine learning pipeline. For example, input data may be biased, leaving supervised models vulnerable to labeling and cohort bias.18 Minority groups may also be under-sampled, or the features collected may not be indicative of their trends.19 There are several conflicting definitions of fairness, many of which are not simultaneously achievable.20 The appropriate choice of a disparity metric is generally task dependent, but balancing error rates between different subgroups is a common consideration,15,17 with equal accuracy across subgroups being a popular choice in medical settings. $^{21}$ In this work, we consider the equality of opportunity notion of fairness and evaluate the rate of correct diagnosis in patients across several protected attribute groups.
公平性与去偏。机器学习模型的公平性日益受到关注,涉及职业分类器中的性别偏见[16]、刑事被告风险评估算法中的种族偏见[17],以及自动化面部分析中的性别-种族交叉偏见[18]。偏见来源可能出现在经典机器学习流程的多个环节,例如输入数据本身可能存在偏差,使得监督式模型容易受到标注偏差和队列偏差的影响[18]。少数群体可能采样不足,或所收集的特征无法反映其真实趋势[19]。公平性存在多种相互冲突的定义,其中许多无法同时实现[20]。差异度量的选择通常取决于具体任务,但平衡不同子群组间的错误率是常见考量[15][17],其中医疗场景常采用子群组间准确率均等的标准[21]。本研究采用机会均等的公平性概念,评估多个受保护属性患者群体中的正确诊断率。
Ethical Algorithms in Health. Using machine learning algorithms to make decisions raises serious ethical concerns about risk of patient harm. $^{22}$ Notably, biases have already been demonstrated in several settings, including racial bias in the commercial risk score algorithms used in hospitals, $^{23}$ or an increased risk of electronic health record (EHR) miss-classification in patients with low socioeconomic status. $^{24}$ It is crucial that we actively consider fairness metrics when building models in systems that include human and structural biases.
医疗伦理算法。利用机器学习算法进行决策会引发关于患者伤害风险的严重伦理问题[22]。值得注意的是,已在多种场景中发现算法偏见,例如医院使用的商业风险评分算法存在种族偏见[23],或社会经济地位较低患者电子健康档案(EHR)误分类风险更高[24]。在构建包含人类和结构性偏见的系统模型时,必须积极考量公平性指标。
Chest X-Ray Classification. With the releases of large public datasets like ChestXray8,3 CheXpert, $^6$ and MIMIC-CXR,5 many researchers have begun to train large deep neural network models for chest X-ray diagnosis.4,6,8,25 Prior work $^8$ demonstrates a diagnostic classifier trained on Chest-Xray8 can achieve radiologist-level performance. Other work on CheXpert $^6$ reports high performance for five of their diagnostic labels. To our knowledge, however, no works have yet been published which examined whether any of these algorithms display systematic bias over age, race and insurance type (as a proxy of social economic status).
胸部X光分类。随着ChestXray8、CheXpert和MIMIC-CXR等大型公共数据集的发布,许多研究者开始训练用于胸部X光诊断的大型深度神经网络模型。先前的研究表明,基于Chest-Xray8训练的诊断分类器可以达到放射科医师的水平。另一项关于CheXpert的研究报告了其五个诊断标签的高性能表现。然而,据我们所知,目前尚未有研究探讨这些算法是否在年龄、种族和保险类型(作为社会经济地位的替代指标)上表现出系统性偏差。
3. Data
3. 数据
We use three public chest X-ray radio graph y datasets described in Table 1: MIMIC-CXR (CXR),5 CheXpert (CXP),6 Chest-Xray8 (NIH).3 Images in CXR, CXP, and NIH are associated with 14 diagnostic labels (see Table 2). We combine all non-positive labels within CXR and CXP (including “negative”, “not mentioned”, or “uncertain”) into an aggregate “negative” label for simplicity, equivalent to “U-zero” study of ‘NaN’ label in CXP. In CXR and CXP, one of the 14 labels is “No Finding”, meaning no disease has been diagnosed for the image and all the other 13 labels are 0. Of the 14 total disease labels, only 8 are shared amongst all 3 datasets. Using these 8 labels, we define a multi-site dataset (ALL) that consists of the aggregation of all images in CXR, CXP, and NIH defined over this restricted label schema.
我们使用了表1中描述的三个公开胸部X光片数据集:MIMIC-CXR (CXR)、5 CheXpert (CXP)、6 Chest-Xray8 (NIH)。3 CXR、CXP和NIH中的图像均关联14个诊断标签(见表2)。为简化处理,我们将CXR和CXP中所有非阳性标签(包括"negative"、"not mentioned"或"uncertain")合并为统一的"negative"标签,相当于CXP中'NaN'标签的"U-zero"研究。在CXR和CXP中,14个标签之一为"No Finding",表示该图像未诊断出任何疾病且其余13个标签均为0。在这14个疾病标签中,仅有8个是所有三个数据集共有的。基于这8个共享标签,我们定义了一个多站点数据集(ALL),该数据集由CXR、CXP和NIH中所有图像按照此限定标签体系聚合而成。
These datasets contain protected subgroup attributes, the full list of which includes sex (Male and Female), age (0-20, 20-40, 40-60, 60-80, and 80-), race (White, Black, Other, Asian, Hispanic, and Native) and insurance type (Medicare, Medicaid, and Other). These values are taken from the structured patient attributes. NIH, CXP, and ALL only have the patient sex and age, while CXR also has race and insurance type data (excluding around 100,000 images).
这些数据集包含受保护的子组属性,完整列表包括性别(男性和女性)、年龄(0-20岁、20-40岁、40-60岁、60-80岁和80岁以上)、种族(白人、黑人、其他、亚裔、西班牙裔和原住民)和保险类型(医疗保险、医疗补助和其他)。这些值取自结构化的患者属性。NIH、CXP和ALL仅包含患者性别和年龄,而CXR还包含种族和保险类型数据(约10万张图像除外)。
4. Methods
4. 方法
We implement CNN-based models to classify chest X-ray images into 14 diagnostic labels. We train separate models for CXR, $^5$ CXP,6 NIH $^{3}$ and ALL and explore their fairness with respect to patient sex and age for all 4 datasets as well as race and insurance type for CXR.
我们基于CNN模型实现胸部X光图像的14种诊断标签分类。针对CXR、CXP、NIH和ALL四个数据集分别训练独立模型,并针对所有数据集分析患者性别与年龄维度的公平性,同时针对CXR数据集额外分析种族与保险类型的公平性。
4.1. Models
4.1. 模型
We initialize a 121-layer DenseNet $26$ with pre-trained weights from ImageNet $^{27}$ and train multi-label models with a multi-label binary cross entropy loss. The 121-layer DenseNet was used as it produced the best results in prior studies $^{6,8}$ . We use a 80-10-10 train-validation-test split with no patient shared across splits. We resize all images to $256\times256$ and normalize via the mean and standard deviation of the ImageNet dataset.27 We apply center crop, random horizontal flip and random rotation, as some of the images maybe flipped or rotated within the dataset. The initial degree of random rotation is chosen by hyper parameter tuning. We use Adam $^{28}$ optimization with default parameters, and decrease the learning rate (LR) by a factor of 2 if the validation loss does not improve over three epochs; we stop learning if validation loss does not improve over 10 epochs. Thus the ultimate number of epochs for training each model is varied based on the early stop condition. For NIH, CXP and CXR we first tune models to get the highest average area under the receiver operating characteristic curve (AUC) over 14 labels by fine tuning the LR. For the best achieved model, we fine tune the degree of random rotation data augmentation from the set of 7, 10 and 15 and select the best model. Following this, best initial LR is 0.0005 for CXR and NIH where it is achieved as 0.0001 for CXP. Also, best initial degree for random rotation data augmentation is 10 for NIH and 15 for the CXR and CXP. For training on ALL, we use the majority vote of the best hyper parameters per individual dataset (e.g. 0.0005 initial LR and 15 degree random rotation). We then, fix the hyper parameters of the best model and train four extra models with the same hyper parameters but different random seeds between 0 to 100, per dataset. We report all the metrics based on the mean and 95% confidence intervals (CI) achieved over five studies per dataset. We choose batch size of 48 to use the maximum memory capacity of the GPU, for all datasets except NIH where we choose 32 similar to prior work.8 The output of the network is an array of 14 numbers between 0 and 1 indicating the probability of each disease label. The binary prediction threshold per disease is chosen to maximize the F1 score measure on the validation dataset. We train models using a single NVIDIA GPU with 16G of memory in approximately 9, 20, 40, and 90 hours for NIH, CXP, CXR, and ALL, respectively.
我们使用ImageNet[27]的预训练权重初始化了一个121层的DenseNet[26],并采用多标签二元交叉熵损失训练多标签模型。选择121层DenseNet是因为其在先前研究中取得了最佳结果[6,8]。我们采用80-10-10的训练-验证-测试划分,确保不同划分间无患者重叠。所有图像被调整为256×256分辨率,并通过ImageNet数据集的均值与标准差进行归一化处理。由于数据集中部分图像可能存在翻转或旋转,我们应用了中心裁剪、随机水平翻转和随机旋转增强。随机旋转的初始角度通过超参数调优确定。
使用Adam优化器[28](默认参数),若验证损失连续3个epoch未改善,学习率(LR)将减半;若连续10个epoch未改善则终止训练。因此每个模型的最终训练epoch数会根据早停条件动态变化。对于NIH、CXP和CXR数据集,我们首先通过微调学习率使14个标签的平均受试者工作特征曲线下面积(AUC)最大化。对最优模型,再从7、10和15度中选择最佳随机旋转增强角度。最终CXR和NIH的最佳初始学习率为0.0005,CXP为0.0001;NIH的最佳旋转角度为10度,CXR和CXP为15度。
在ALL数据集训练时,我们采用各数据集最优超参数的多数投票结果(如初始学习率0.0005和15度随机旋转)。随后固定最优模型的超参数,为每个数据集额外训练4个相同配置但随机种子(0-100)不同的模型。所有指标均基于每个数据集五次实验的均值及95%置信区间(CI)报告。除NIH采用批量大小32(与先前研究[8]一致)外,其他数据集均使用GPU最大内存容量对应的批量大小48。网络输出为14个0-1之间的数值,表示各疾病标签的概率。每个疾病的二元预测阈值通过验证集F1分数最大化确定。
所有实验在16G显存的NVIDIA GPU上完成,NIH、CXP、CXR和ALL的训练时间分别约为9、20、40和90小时。
Table 1. Description of chest X-ray datasets, MIMIC-CXR (CXR),5 CheXpert (CXP),6 Chest-Xray8 (NIH).3 and their aggregation on 8 shared labels (ALL). Here, the number of images, patients, view types, and the proportion of patients per subgroups of sex, age, race, and insurance type are presented. ‘Frontal’ and ‘Latral’ abbreviate frontal and lateral view, respectively. Native, Hispanic, and Black denote self-reported American Indian/Alaska Native, Hispanic/Latino, and Black/African American race respectively.
表 1: 胸部X光数据集描述:MIMIC-CXR (CXR)、5 CheXpert (CXP)、6 Chest-Xray8 (NIH)、3 及其在8个共享标签上的聚合结果(ALL)。表中展示了图像数量、患者数量、视图类型,以及按性别、年龄、种族和保险类型分组的患者比例。"Frontal"和"Lateral"分别代表正位和侧位视图。Native、Hispanic和Black分别表示自我报告的美洲印第安人/阿拉斯加原住民、西班牙裔/拉丁裔和黑人/非裔美国人种族。
| 分组 | 属性 | CXR5 | CXP6 | NIH3 | ALL |
|---|---|---|---|---|---|
| #图像 #患者 | 371,858 65,079 | 223,648 64,740 | 112,120 30,805 | 707,626 129,819 | |
| 视图 | 正位/侧位 | 正位/侧位 | 正位 | 正位/侧位 | |
| 性别 | 女性 男性 | 47.83% 52.17% | 40.64% 59.36% | 43.51% 56.49% | 44.87% 55.13% |
| 年龄 | 0-20 | 2.20% | 0.87% | 6.09% | 2.40% |
| 20-40 | 19.51% | 13.18% | 25.96% | 18.53% | |
| 40-60 | 37.20% | 31.00% | 43.83% | 36.29% | |
| 60-80 | 34.12% | 38.94% | 23.11% | 33.90% | |
| 80+ | 6.96% | 16.01% | 1.01% | 8.88% | |
| 种族 | 亚裔 | 3.24% | |||
| 黑人 | 18.59% | ||||
| 西班牙裔 | 6.41% | ||||
| 原住民 | 0.29% | ||||
| 白人 | 67.64% | ||||
| 其他 | 3.83% | ||||
| 保险类型 | Medicare | 46.07% | |||
| Medicaid | 8.98% | ||||
| 其他 | 44.95% |
4.2. Classifier Disparity Evaluation
4.2. 分类器差异评估
Our primary measurement of bias is TPR disparity. For example, given a binary subgroup attribute such as sex (which in our data we classify as either ‘male’ or ‘female’), we mimic prior work $^{16}$ and define the TPR disparity per diagnostic label $i$ as simply the TPR of label $i$ restricted to female patients minus that for male patients. More formally, letting $g$ be the binary subgroup attribute, we define $ TPR{g,i}=P[{Y_{i}}=y_{i}|G=g,Y_{i}=y_{i}]$ , and the TPR disparity as, $Gap{g,i} =TPR{g,i}-TPR{{g,i}}$ . For non-binary attributes $S_{1},\ldots,S_{N}$ , we use the difference between a subgroup’s TPR and the median of all TPRs to define TPR disparity of the $j$ th subgroup for the $i$ th label as, $\mathrm{Gap}{S_{j},i}=\mathrm{TPR}{S_{j},i}-\mathrm{Median}(\mathrm{TPR}{S_{1},i},..,\mathrm{TPR}{S_{k},i}) $ ).
我们对偏差的主要衡量指标是TPR差异。例如,给定一个二元子群属性(如性别,在我们的数据中分为"男性"或"女性"),我们借鉴先前研究[16]的方法,将每个诊断标签$i$的TPR差异简单定义为女性患者中标签$i$的TPR减去男性患者中标签$i$的TPR。更正式地,设$g$为二元子群属性,我们定义$\mathrm{TPR}{g,i}=P[\hat{Y_{i}}=y_{i}|G=g,Y_{i}=y_{i}]$,并将TPR差异定义为$\mathrm{Gap}{g,i}\mathrm{ =~}\mathrm{TPR}{g,i}-\mathrm{TPR}{\neg{g,i}}$。对于非二元属性$S_{1},\ldots,S_{N}$,我们使用子群TPR与所有TPR中位数的差值来定义第$i$个标签的第$j$个子群的TPR差异:$\mathrm{Gap}{S_{j},i}=\mathrm{TPR}{S_{j},i}-\mathrm{Median}(\mathrm{TPR}{S_{1},i},..,\mathrm{TPR}{S_{k},i})$。
5. Experiments
5. 实验
First, we demonstrate that the class if i ers we train on all datasets reach near-SOTA level performance. This motivates using them to study fairness implications, as we can be confident any problematic disparities are not simply reflective of poor overall performance. Next, we explicitly test these class if i ers for their implications on fairness. We target two investigations:
首先,我们证明在所有数据集上训练的类分类器达到了接近SOTA水平的性能。这促使我们使用它们来研究公平性影响,因为我们可以确信任何有问题的差异不仅仅反映了整体性能不佳。接下来,我们明确测试这些类分类器对公平性的影响。我们针对两项调查展开:
6. Results
6. 结果
One potential reason that a model may be biased is because of poor performance, but we demonstrate that our models achieve near-SOTA classification performance. Table 2 shows overall performance numbers across all tasks and datasets. Though results have non-trivial variability, we show similar performance to the published SOTA of NIH,8 the only dataset for which a published SOTA comparison exists for all labels. Note that the published results for CXP $^{16}$ are on a private, unreleased dataset of only 200 images and 5 labels. Our results for CXP are on a randomly sub-sampled test set of size 22,274 images, so the numbers for this dataset are not comparable to the published results there.
模型可能存在偏差的一个潜在原因是性能不佳,但我们证明我们的模型实现了接近SOTA (State-of-the-Art) 的分类性能。表2展示了所有任务和数据集上的整体性能数据。尽管结果存在显著差异,但我们在NIH数据集上展示了与已发布SOTA [8] 相似的性能(这是唯一一个所有标签都有已发布SOTA对比的数据集)。需要注意的是,CXP [16] 的已发布结果基于一个未公开的私有数据集(仅包含200张图像和5个标签)。而我们的CXP结果基于随机子采样的测试集(包含22,274张图像),因此该数据集的数据与已发布结果不具备可比性。
Table 2. The AUC for chest X-ray class if i ers trained on CXP, CXR, NIH, and ALL averaged over 5 runs $\pm95%\mathrm{CI}$ , where all runs have same hyper parameters but different random seed. (‘Airspace Opacity’5 and ‘Lung Opacity’6 denote the same label.)
表 2. 在CXP、CXR、NIH和ALL数据集上训练的胸部X光分类器的AUC值(5次运行平均值)$\pm95%\mathrm{CI}$,所有运行使用相同超参数但不同随机种子。('Airspace Opacity'5和'Lung Opacity'6表示相同标签)
| 标签(缩写) | CXR | CXP | NIH | ALL |
|---|---|---|---|---|
| Airspace Opacity (AO) | 0.782 ± 0.002 | 0.747 ± 0.001 | ||
| Atelectasis (A) | 0.837 ± 0.001 | 0.717 ± 0.002 | 0.814 ± 0.004 | 0.808 ± 0.001 |
| Cardiomegaly (Cd) | 0.828 ± 0.002 | 0.855 ± 0.003 | 0.915 ± 0.002 | 0.856 ± 0.001 |
| Consolidation (Co) | 0.844 ± 0.001 | 0.734 ± 0.004 | 0.801 ± 0.005 | 0.805 ± 0.001 |
| Edema (Ed) | 0.904 ± 0.002 | 0.849 ± 0.001 | 0.915 ± 0.003 | 0.898 ± 0.001 |
| Effusion (Ef) | 0.933 ± 0.001 | 0.885 ± 0.001 | 0.875 ± 0.002 | 0.922 ± 0.001 |
| Emphysema (Em) | 0.897 ± 0.002 | |||
| Enlarged Card (EC) | 0.757 ± 0.003 | 0.668 ± 0.005 | ||
| Fibrosis Fracture (Fr) | 0.790 ± 0.006 | 0.788 ± 0.007 | ||
| Hernia (H) | 0.718 ± 0.007 | 0.978 ± 0.004 | ||
| Infiltration (In) | 0.717 ± 0.004 | |||
| Lung Lesion (LL) | 0.772 ± 0.006 | 0.780 ± 0.005 | ||
| Mas (M) | 0.829 ± 0.006 | |||
| Nodule (N) No Finding (NF) | 0.779 ± 0.006 | |||
| Pleural Thickening (PT) | 0.868 ± 0.001 | 0.885 ± 0.001 | 0.890 ± 0.000 | |
| 0.813 ± 0.006 | ||||
| Pleural Other (PO) | 0.848 ± 0.003 | 0.795 ± 0.004 | ||
| Pneumonia (Pa) | 0.748 ± 0.005 | 0.777 ± 0.003 | 0.759 ± 0.012 | 0.784 ± 0.001 |
| Pneumothorax (Px) | 0.903 ± 0.002 | 0.893 ± 0.002 | 0.879 ± 0.005 | 0.904 ± 0.002 |
| Support Devices (SD) Average | 0.927 ± 0.001 | 0.898 ± 0.001 |
6.1. TPR Disparities
6.1. TPR差异
We calculate and identify TPR disparities and 95% CI across all labels, datasets and attributes. We see many instances of positive and negative disparities, which can denote bias for or against of a subgroup, here referred to favorable and unfavorable subgroups. As an illustrative example Fig. 1 shows the race TPR disparities distribution sorted by the the gap between least and most favorable subgroups per label. In a fair setting, all subgroups would have no appreciable TPR disparities, yielding a gap between least and most favorable subgroups within a label at ‘0’. Table 3 shows the summary of the disparities in all attributes and datasets. We note that the most frequent unfavorable subgroups are those with social disparities in the healthcare system, e.g., women and minorities, but no disease is consistently at the highest or lowest disparity. We show the average cross-label gap between and the labels of the least and most favorable subgroups per dataset and attributes. We count the number of time each subgroups experience negative disparities (unfavorable) and zero or positive disparities (favorable) across disease labels and report the most frequent unfavorable and favorable subgroups by count in Table 3. For CXP and CXR, we exclude “No Finding” label in the count (counts are out of 13) as we want to check negative bias in disease labels. Notably, the model trained on ALL has the smallest average cross- label gap between least/most favorable groups for sex and age.
我们计算并识别了所有标签、数据集和属性间的TPR差异及95%置信区间(CI)。观察到大量正负差异实例,这些差异可能表示对子群体的偏向或歧视,此处称为有利子群和不利子群。如图1所示,作为示例,我们按每个标签下最不利与最有利子群间的差距排序,展示了种族TPR差异的分布。在公平设定中,所有子群的TPR差异应不显著,使得标签内最不利与最有利子群间的差距为"0"。表3汇总了所有属性和数据集中的差异情况。值得注意的是,最常见的不利子群是医疗系统中存在社会差异的群体(如女性和少数族裔),但没有疾病始终处于最高或最低差异水平。我们展示了每个数据集和属性下最不利与最有利子群标签间的平均跨标签差距。统计了各子群在疾病标签中经历负差异(不利)及零或正差异(有利)的次数,并在表3中按计数列出最常见的不利和有利子群。对于CXP和CXR数据集,统计时排除了"No Finding"标签(计数基于13个标签),以专注于疾病标签中的负向偏差。值得注意的是,在ALL数据集上训练的模型,其性别和年龄维度下最不利/最有利子群间的平均跨标签差距最小。
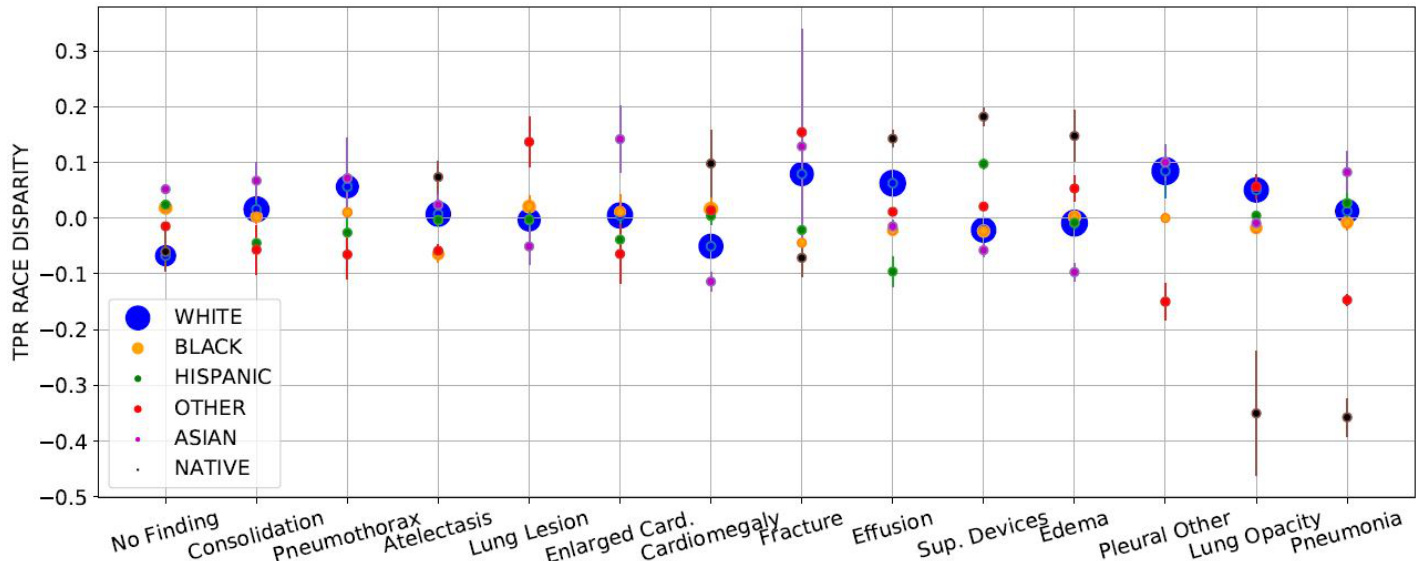
Fig. 1. The sorted distribution of TPR race disparity of CXR ( $y$ -axis) with label ( $x$ -axis). The scatter plot’s circle area is proportional to group size. TPR disparities are averaged over five runs $\pm95%\mathrm{CI}$ ( shown with arrows). Hispanic patients are most unfavorable (highest count of negative TPR disparities, 9/13) whereas White patients are most favorable subgroup (9/13 zero or positive disparities). Labels ‘No Finding’ (‘NF’) and ‘Pneumonia’ (‘Pa’) have smallest (0.119) and largest (0.440) gap between least/most favorable subgroups. The average cross 14 labels gap is 0.226.
图 1: 胸部X光片 (CXR) 的TPR种族差异排序分布 (y轴) 与标签 (x轴) 的关系。散点图的圆圈面积与组别大小成比例。TPR差异为五次运行的平均值 ±95%置信区间 (用箭头表示)。西班牙裔患者处于最不利地位 (负TPR差异数量最多,9/13),而白人患者是最有利的亚组 (9/13为零或正差异)。标签"No Finding" ("NF") 和"Pneumonia" ("Pa") 在最有利/最不利亚组间的差距最小 (0.119) 和最大 (0.440)。14个标签的平均跨组差距为0.226。
Table 3. Disparities overview over attributes and datasets. We average per label gaps between the least and most favorable subgroup’s TPR disparities per attributes/datasets to obtain the average cross-label gap. The labels (full names on Table 2) that obtained the smallest and largest gaps are shown next to the average cross-label gap column, along with their gaps. We summarize and label in columns the most frequent “Unfavorable” and “Favorable” subgroups count, which are the ones that experience TPRs disparities below or above the zero gap line. See Section 6.1 for more details.
表 3: 属性和数据集间的差异概览。我们通过计算每个属性/数据集下最不利和最有利子组间TPR差异的标签平均值,得到平均跨标签差异。平均跨标签差异列旁边显示了差异最小和最大的标签(完整名称见表2)及其差异值。我们在列中汇总并标注了最常见的"不利"和"有利"子组计数,这些子组的TPR差异分别低于或高于零差异线。详见第6.1节。
| 属性 | 数据集 | 平均跨标签差异 | 不利子组 | 有利子组 | ||
|---|---|---|---|---|---|---|
| 差异值 | 最小值 | 最大值 | ||||
| 性别 | ALL | 0.045 | Ef:0.001 | Pa:0.105 | 女性 (4/7) | 男性 (4/7) |
| CXP | 0.062 | Ed:0.000 | Co:0.139 | 女性 (7/13) | 男性 (7/13) | |
| CXR | 0.072 | Ed:0.011 | EC:0.151 | 女性 (10/13) | 男性 (10/13) | |
| NIH | 0.190 | M:0.001 | Cd:0.393 | 女性 (8/14) | 男性 (8/14) | |
| 年龄 | ALL | 0.215 | Ef:0.115 | NF:0.444 | 0-20岁 (5/7) | 40-60,60-80(5/7) |
| CXR | 0.245 | SD:0.091 | Cd:0.440 | 0-20,20-40(7/13) | 60-80 (10/13) | |
| CXP | 0.270 | SD:0.084 | NF:0.604 | 0-20,20-40,80+(7/13) | 40-60 (8/13) | |
| NIH | 0.413 | In:0.188 | Em:1.00 | 60-80 (7/14) | 20-40 (9/14) | |
| 种族 | CXR | 0.226 | NF:0.119 | Pa:0.440 | 西班牙裔(9/13) | 白人 (9/13) |
| 保险类型 | CXR | 0.100 | SD:0.021 | PO:0.190 | 医疗补助(10/13) | 其他 (10/13) |
6.2. TPR Disparity Correlation with Membership Proportion
6.2. TPR差异与成员比例的相关性
We measure the Pearson correlation coefficients ( $r$ ) between the TPR disparities and patients proportion per label across all subgroups/datasets. As we test multiple (33) hypotheses, (33 total comparisons amongst all protected attributes considered) with a desired significance level $\mathit{\check{p}}<0.05\$ , then based on Bonferroni correction,31 the statistical significance level for each hypothesis is $p<0.0015$ (0.05/33). The majority of correlation coefficients listed are positive, but the only statistically significant correlations are: race Other ( $r$ : 0.782, p: 0.0009) $&$ age subgroups, 20-40 ( $r$ : 0.766, $p$ : 0.0013), 60-80 ( $r$ : 0.787, $p$ : 0.0008) and 80- ( $r$ :0.858 , p: 0.0000) in CXR, age group 60-80 ( $r$ : 0.853, p: 0.0001) in CXP, and age group 60-80 ( $r$ : 0.936, p: 0.0006) in ALL.
我们测量了所有亚组/数据集中TPR差异与每标签患者比例之间的皮尔逊相关系数( $r$ )。由于我们测试了多个(33个)假设(在所有考虑的受保护属性中共33组比较),期望显著性水平为 $\mathit{\check{p}}<0.05\$ ,基于Bonferroni校正[31],每个假设的统计显著性水平为 $p<0.0015$ (0.05/33)。所列相关系数大多为正,但唯一具有统计学显著性的相关性为:CXR中的其他种族( $r$ : 0.782, p: 0.0009) $&$ 年龄亚组20-40( $r$ : 0.766, $p$ : 0.0013)、60-80( $r$ : 0.787, $p$ : 0.0008)和80岁以上( $r$ :0.858, p: 0.0000);CXP中的60-80岁年龄组( $r$ : 0.853, p: 0.0001);以及ALL数据集中的60-80岁年龄组( $r$ : 0.936, p: 0.0006)。
7. Summary and Discussion
7. 总结与讨论
We present a range of findings on the potential biases of deployed SOTA X-ray image class if i ers over the sex, age, race and insurance type attributes on models trained on NIH, CXP and CXR. We focus on TPR disparities similar to prior work,16 checking if the sick members of the different subgroups are given correct diagnosis at similar rates.
我们针对在NIH、CXP和CXR数据集上训练的模型,就当前最优(X-ray)图像分类器在性别、年龄、种族和保险类型属性上可能存在的偏差提出了一系列发现。与先前研究[16]类似,我们重点关注真阳性率(TPR)差异,检验不同亚组的患病成员是否以相近比例获得正确诊断。
Our results demonstrate several main takeaways. First, all datasets and tasks display nontrivial TPR disparities. These disparities could pose serious barriers to effective deployment of these models and invite additional changes in either dataset design and/or modeling techniques to ensure more equitable models. Second, using a multi-source dataset leads to smaller TPR disparities, potentially due to removing bias in the data collection process. Third, while there is occasionally a proportionality between protected subgroup membership per label and TPR disparity, this relationship is not uniformly true across datasets and subgroups.
我们的研究结果揭示了几个主要发现。首先,所有数据集和任务都显示出显著的TPR差异。这些差异可能对这些模型的有效部署构成严重障碍,并需要在数据集设计和/或建模技术方面进行额外调整,以确保模型更加公平。其次,使用多源数据集会导致较小的TPR差异,这可能是由于消除了数据收集过程中的偏差。第三,虽然受保护子群成员在每个标签中的比例与TPR差异之间偶尔存在比例关系,但这种关系在不同数据集和子群中并不一致。
7.1. Extensive Patterns of Bias
7.1. 广泛的偏见模式
We find that all datasets and tasks contain meaningful patterns of bias although no diseases are consistently at the highest or lowest disparity rates across all attributes and datasets. These disparities are present with respect to age and sex in all settings, with consistent subgroups (female, 0-20) showing consistently unfavorable outcomes. Note that in the case of the sex disparities, “female” patients are universally the least favored subgroup despite the fact that the proportion of female patients is only slightly less than male patients in all 4 datasets.
我们发现,尽管在所有属性和数据集中没有哪种疾病始终处于最高或最低的差异率,但所有数据集和任务都包含有意义的偏差模式。这些差异在所有设置中均与年龄和性别相关,其中特定亚组(女性,0-20岁)始终表现出不利结果。值得注意的是,在性别差异方面,"女性"患者普遍是最不受青睐的亚组,尽管在所有4个数据集中女性患者的比例仅略低于男性患者。
We also observe TPR disparities with respect to the patient race and insurance type in the CXR dataset. White patients, the majority, are the most favorable subgroup, where Hispanic patients are the most unfavorable. Additionally, bias exists against patients with Medicaid insurance, who are the minority population and are often from lower socioeconomic status. They are the most unfavorable subgroup with the model often providing incorrect diagnoses.
我们在CXR数据集中还观察到针对患者种族和保险类型的真阳性率(TPR)差异。白人患者作为多数群体是最有利的亚组,而西班牙裔患者处于最不利地位。此外,模型对医疗补助(Medicaid)参保者存在偏见——这类少数群体通常社会经济地位较低,成为最不利的亚组,模型常对其做出错误诊断。
7.2. Bias Reduction Through Multi-source Data
7.2. 通过多源数据减少偏差
Of the four datasets, the multi-source dataset led to the smallest disparities with respect to age and sex. Based on notions of general iz ability in healthcare,10,32 we hypothesize that this improvement stems from the combination of large datasets reducing data collection bias.
在四个数据集中,多源数据集在年龄和性别方面导致的差异最小。基于医疗领域泛化能力的概念 [10,32] ,我们假设这一改进源于大型数据集组合减少了数据收集偏差。
7.3. Correlation Between TPR Disparities and Membership Proportion
7.3. TPR差异与成员比例之间的相关性
Although prior work has raised data imbalance as a potential cause of sex bias,29 we observe TPR disparities are not often significantly correlated with disease membership. While we observe positive correlation between subgroups membership and TPR disparities, only 6 of 33 subgroups showed statistically significant correlation. By inspection, we identify diseases with the same patient proportion of a subgroup and completely different TPR disparities (e.g. ‘Consolidation’, ‘Nodule’ and ‘Pneumothorax’ in NIH have 45% Female, but the TPR disparities are in diverse range, -0.155, -0.079 and 0.047, respectively). Thus, having the same portion of images within all labels may not guarantee lack of bias.
尽管先前的研究指出数据不平衡是性别偏见的潜在原因[29],但我们观察到真阳性率(TPR)差异与疾病类别并不常显著相关。虽然我们发现亚组类别与TPR差异存在正相关性,但33个亚组中仅有6个显示出统计学显著相关性。通过观察发现,某些疾病具有相同的亚组患者比例却呈现完全不同的TPR差异(例如NIH数据集中的"实变"、"结节"和"气胸"女性占比均为45%,但TPR差异分别为-0.155、-0.079和0.047)。因此,所有标签内保持相同的图像比例并不能确保消除偏见。
7.4. Discussion
7.4. 讨论
We identify subgroups that may experience more bias through the exploration of variance in TPR and FPR. Based on the equality of opportunity notion of fairness, a fair network should exhibit the same TPR on average among all subgroups regardless of how likely a subgroup may have a disease. Such an improvement would allow two patients with the same condition, but in different subgroups, to be diagnosed correctly and receive the same level of care. While we focused on some of the more obvious protected attributes, it is important to note that there are several other factors, subgroups, and attributes that we have not considered.
我们通过探索真阳性率(TPR)和假阳性率(FPR)的差异来识别可能经历更多偏见的亚组。基于机会均等的公平性概念,一个公平的网络应该在所有亚组中平均表现出相同的TPR,无论某个亚组患病的可能性如何。这样的改进将使两名患有相同病症但属于不同亚组的患者能够得到正确诊断并获得相同水平的护理。虽然我们关注了一些较明显的受保护属性,但需要注意的是,还有许多其他因素、亚组和属性我们尚未考虑。
Identifying and eliminating disparities is particularly important as large datasets begin to be used by high-capacity neural models, but are based on highly skewed population, e.g., kidney injury prediction in a population that is $93.6%$ male.33 While chest X-ray images datasets are not sex-skewed, we note that the age, race and insurance type attributes are highly unbalanced, e.g., 67.6% of patients are White, and only 8.98% are under Medicaid insurance. Subgroups with chronic under diagnosis are those who experience more negative social determinants of health, specifically, women, minorities, and those of low socioeconomic status. Such patients may use healthcare services less than others. In some groups, such a dataset skew can increase the risk of miss-classification.24
识别和消除数据偏差尤为重要,因为大容量神经模型开始使用基于高度倾斜人群的大型数据集,例如在男性占比达93.6%的人群中进行肾损伤预测[33]。虽然胸部X光影像数据集不存在性别偏差,但我们注意到年龄、种族和保险类型属性极不均衡,例如67.6%的患者为白人,仅有8.98%享有医疗补助保险。长期存在诊断不足的亚群体往往是受负面健康社会决定因素影响更严重的人群,特别是女性、少数族裔和低社会经济地位者。这类患者可能比其他人群更少使用医疗服务。在某些群体中,此类数据集偏差会增加误分类风险[24]。
Although “de-biasing” techniques $^\mathrm{34,35}$ may reduce disparities, we should not ignore the important biases inherent in existent large public datasets. There are a number of reasons why dataset may induce disparities in algorithms, from imbalanced datasets to differences in statistical noise in each group (e.g. unmeasured predictive features) to differences in access to healthcare for patients of different groups.12,19 For instance, an algorithm that can classify skin cancer $^{36}$ with high accuracy will not be able to generalize on different skin color if similar samples have not been represented enough in the trained dataset.18 Intentionally adjusting the datasets to reduce disparities in to protect minorities and the subgroups with high disparities is one potential option in dataset creation, though our analyses suggest that dataset membership cannot always ameliorate bias.
尽管“去偏”(de-biasing)技术$^\mathrm{34,35}$可以减少差异,但我们不应忽视现有大型公共数据集中固有的重要偏差。数据集可能导致算法差异的原因有很多,从数据不平衡到各组统计噪声的差异(例如未测量的预测特征),再到不同群体患者获得医疗服务的差异[12,19]。例如,一个能够高准确率分类皮肤癌$^{36}$的算法,如果在训练数据集中没有充分代表类似样本,将无法泛化到不同肤色的人群[18]。在数据集创建过程中,有意调整数据集以减少差异以保护少数群体和高差异亚群是一个潜在选项,尽管我们的分析表明数据集成员资格并不总能改善偏差。
With the great promise of advanced models for clinical care, we caution that advanced SOTA models must be carefully checked for such biases as those we have identified. Disparities in small or vulnerable subgroups could be propagated $^{30}$ within the development of machine learning models. This raises serious ethical concerns $^{22}$ about the equal accessibility to the required medical treatment. Usually the SOTA class if i ers are trained to provides high AUC or accuracy on the general population. However we suggest additionally applying rigorous fairness analyses before deployment. Clear disclaimers about the dataset collection process and potential resulting algorithmic bias could improve model assessment for clinical use.
随着先进模型在临床护理中的巨大潜力,我们提醒必须仔细检查这些最先进(SOTA)模型是否存在我们所发现的此类偏差。机器学习模型开发过程中可能会放大小型或弱势亚群中的差异$^{30}$,这引发了关于平等获取所需医疗服务的严重伦理担忧$^{22}$。通常SOTA分类器经过训练能在普通人群上提供较高的AUC或准确率,但我们建议在部署前额外应用严格的公平性分析。明确说明数据集收集过程及可能导致的算法偏差,可提升临床使用中的模型评估质量。
8. Limitations and Future Work
8. 局限性与未来工作
As SOTA deep learning diagnosis algorithms become more promising for medical screening, model bias investigation is essential. This work is a first step in quantifying these biases so that approaches for amelioration can be developed. However, important future work remains.
随着最先进 (SOTA) 深度学习诊断算法在医疗筛查领域展现出更大潜力,模型偏差研究变得至关重要。本研究迈出了量化这些偏差的第一步,以便开发相应的缓解方法。然而,未来仍有许多重要工作有待完成。
First, we note that across these models, our source of diagnostic labels for these images must be considered at best “silver” labels, as all currently existing public chest X-ray datasets use automatically deter e mined labels based on natural language processing (NLP) techniques to extract labels from the radiology reports. These silver labels may be incorrect, in ways that could compound with observe biases or model errors, a risk that warrants further investigation. Additionally, we must consider the quality of the imaging devices themselves, the region of data collection, and the patient demographics at each hospital collection site. For instance, NIH was gathered from a hospital that covers more complicated cases, CXP contains more tertiary cases, and CXR was gathered from an emergency department, and prior literature has already shown that models are fully capable of taking advantage of such con founders.32 These challenges may affect both the label quality,37 and any patterns of bias in the labels, thereby affecting the resulting fairness metrics. Finally, exploration of existing de-biasing techniques, however limited, should also be undertaken over this modality to see if any of the problems we identified here can be resolved.
首先,我们注意到这些模型的诊断标签来源最多只能算"银级"标签,因为目前所有公开的胸部X光数据集都采用基于自然语言处理(NLP)技术自动生成的标签,这些标签从放射报告中提取而来。这些银级标签可能存在错误,可能加剧观察偏差或模型误差,这一风险值得进一步研究。此外,我们必须考虑成像设备本身的质量、数据收集区域以及各医院采集点的患者人口统计数据。例如,NIH数据集来自收治复杂病例的医院,CXP包含更多三级病例,而CXR采集自急诊科,已有文献[32]表明模型完全能够利用这些混杂因素。这些挑战可能同时影响标签质量[37]和标签中的偏差模式,从而影响最终的公平性指标。最后,尽管现有去偏技术有限,仍应在此模态上进行探索,以验证我们发现的这些问题能否得到解决。
9. Conclusion
9. 结论
While the development and deployment of machine learning models in a clinical setting poses exciting opportunities, great care must be taken to understand how existing biases may be exacerbated and propagated. We show the TPR disparity of SOTA chest X-ray pathology class if i ers trained on 4 datasets, (MIMIC-CXR, ChestX-ray8, CheXpert, and aggregation of those three on shared labels) across 14 diagnostic labels. We quantify the TPR disparity across datasets along sex, age, race and insurance type. Our results indicate that high-capacity models trained on large datasets do not provide equality of opportunity naturally, leading instead to potential disparities in care if deployed without modification.
在临床环境中开发和部署机器学习模型虽然带来了令人兴奋的机遇,但必须谨慎理解现有偏见可能被加剧和传播的方式。我们展示了在4个数据集(MIMIC-CXR、ChestX-ray8、CheXpert及这三者在共享标签上的聚合)上训练的SOTA胸部X光病理分类器在14个诊断标签上的TPR差异。我们量化了不同数据集间在性别、年龄、种族和保险类型维度上的TPR差异。结果表明,基于大规模数据训练的高容量模型不会自然实现机会均等,若未经调整直接部署,反而可能导致诊疗中的潜在差异。
Acknowledgment
致谢
We acknowledge the support of the Natural Sciences and Engineering Research Council of Canada (NSERC, funding number PDF-516984), Microsoft Research, CIFAR, NSERC Discovery Grant, and high performance computing platforms of Vector Institute. We also thank Dr. Alistair Johnson, Dr. Errol Colak and Grey Kuling for productive discussions.
我们感谢加拿大自然科学与工程研究委员会(NSERC, 资助编号 PDF-516984)、Microsoft Research、CIFAR、NSERC Discovery Grant以及Vector Institute的高性能计算平台的支持。同时感谢Dr. Alistair Johnson、Dr. Errol Colak和Grey Kuling富有成效的讨论。
References
参考文献
ppendix A. Distribution of TPR Disparity per Attributes, Subgroups and Labels
附录 A. 各属性、子组及标签的 TPR 差异分布
Here we present the distribution of TPR disparities per subgroups/disease labels for all attributes. In a fair setting all subgroups TPRs per disease are the same and disparity is $\nabla$ . Conversely, negative and positive disparities denotes bias against and in favor of a subgroup, respectively. The subgroup with largest (positive) and smallest (negative) TPR disparities per disease label are the most favorable and unfavorable subgroups, respectively. In Fig. A1 to Fig. A9, we sort disease labels based on the gap between the least and most favorable subgroups per disease, so that ones with smaller variance in disparity appear on the left side. We quantify TPR disparity across different subgroups similar to prior work $\mathrm{16}$ for sex attributes, as the TPR of the subgroup of interest minus the TPR of the other subgroup (e.g. Disparity Female,Edema = TPRFemale,Edema − TPRMale,Edema). For age, race, and insurance type we quantify disparities using the difference between a subgroup’s TPR and the TPRs median. We present the count of negative disparities per subgroup across all labels, excluding the ‘No Finding’ (‘NF’) label in order to consider disease labels only. The counts are based on the TPR disparities mean over five run. For Fig. A1 to Fig. A9 the label with the smallest and largest gap (distance) between the least/most favorable subgroups, the average cross labels gaps (between the the least/most favorable subgroups), and the count of the most frequent ‘Unfavorable’ and ‘Favorable’ subgroups, are summarized in Table. 3 and presented in the figure captions.
在此,我们展示了所有属性下各亚组/疾病标签的真阳性率(TPR)差异分布。在公平情况下,每个疾病的所有亚组TPR应相同,差异为$\nabla$。相反,负差异和正差异分别表示对某亚组存在不利偏见和有利偏见。每个疾病标签中TPR差异最大(正值)和最小(负值)的亚组分别是最有利和最不利亚组。在图A1至图A9中,我们根据每个疾病最不利与最有利亚组间的差距对疾病标签进行排序,使差异波动较小的标签显示在左侧。我们采用与文献[16]相似的性别属性TPR差异量化方法:目标亚组TPR减去另一亚组TPR(如女性-水肿差异=TPR女性,水肿−TPR男性,水肿)。对于年龄、种族和保险类型,我们使用各亚组TPR与TPR中位数的差值来量化差异。我们统计了所有标签(排除"无异常"(NF)标签以仅考虑疾病标签)中各亚组的负差异计数,该计数基于五次运行的TPR差异均值。图A1至图A9中最不利/最有利亚组间差距最小和最大的标签、跨标签平均差距(最不利与最有利亚组间)以及最常出现的"不利"和"有利"亚组计数均汇总于表3,并在图注中予以呈现。

Fig. A1. The sorted distribution of the TPR sex disparity in ALL dataset per disease. The $x$ -axis labels are the disease names. The scatter plot’s circle area is proportional to the patients percentages per subgroup. The TPR disparities are averaged over five run $\pm95%$ CI. The $95%$ CI are shown with arrows around the TPR disparities mean scatter plot. The average cross labels gaps between the the least/most favorable subgroups is 0.045. Female are the most unfavorable subgroups with $4/7$ count of negative disparities in disease labels where ‘Male’ are the most favorable subgroups. Here, ‘Effusion’ is the label with the smallest gap (0.001) between the least/most favorable subgroups, where ‘Pneumonia’ has the largest gap (0.105).
图 A1: ALL数据集中按疾病分类的TPR性别差异排序分布。x轴标签为疾病名称。散点图的圆圈面积与各亚组患者比例成正比。TPR差异为五次运行的平均值±95%置信区间(CI)。95%置信区间以箭头形式显示在TPR差异均值散点图周围。最不利/最有利亚组间的平均交叉标签差距为0.045。女性是最不利亚组,在疾病标签中有4/7的负差异计数,而"男性"是最有利亚组。其中,"积液"是最不利/最有利亚组间差距最小的标签(0.001),而"肺炎"是差距最大的标签(0.105)。

Fig. A2. The sorted distribution of the TPR sex disparity in MIMIC-CXR dataset per disease. The $x$ -axis labels are the abbreviation of the disease names. Here Lung Opacity and Airspace Opacity label in Table 2 refer to the same disease. The scatter plot’s circle area is proportional to the patients percentages per subgroup. The TPR disparities are averaged over five run $\pm95%$ CI. The $95%$ CI are shown with arrows around the TPR disparities mean scatter plot. Count of ‘Female’ and ‘Male’ patients with negative disparities in disease labels (excluding ‘No Finding’) are 10/13 and 3/13. Thus Female are the most unfavorable subgroup. Here, ‘Edema’ is the label with the smallest gap (0.011) between the least/most favorable subgroups, where ‘Enlarged Car dio media st in um’ has the largest gap (0.151). The average cross labels gap between the the least/most favorable subgroups are 0.072.
图 A2: MIMIC-CXR数据集中每种疾病的TPR性别差异排序分布。x轴标签为疾病名称缩写。表2中的Lung Opacity和Airspace Opacity标签指向同一疾病。散点图的圆圈面积与各亚组患者占比成正比。TPR差异为五次运行的平均值±95%置信区间(CI),通过箭头标示在TPR差异均值散点图周围。在疾病标签(排除"No Finding")中呈现负差异的"女性"和"男性"患者计数分别为10/13和3/13,因此女性为最不利亚组。其中"Edema"是最有利/最不利亚组间差距最小(0.011)的标签,而"Enlarged Cardiomediastinum"差距最大(0.151)。所有标签中最有利/最不利亚组间的平均跨标签差距为0.072。

Fig. A3. The sorted distribution of the TPR sex disparity in CheXpert dataset per disease. The $x$ -axis labels are the disease labels. Here, the label Lung Opacity and Airspace Opacity label in Table 2 refer to the same disease. The scatter plot’s circle area is proportional to the patients percentages per subgroup. The TPR disparities are averaged over five run $\pm95%$ CI. The $95%$ CI are shown with arrows around the TPR disparities mean scatter plot. Count of ‘Female’ and ‘Male’ patients with negative disparities in disease labels are 7/13 and 6/13. Here, ‘Edema’ (‘Ed’) is the label with the smallest gap (0.000) between the least/most favorable subgroups, where ‘Consolidation’ (‘Co’) has the largest gap (0.139). The average cross labels gap between the the least/most favorable subgroups are 0.062.
图 A3: CheXpert数据集中每种疾病的TPR性别差异排序分布。x轴标签为疾病名称。表2中的Lung Opacity和Airspace Opacity标签指向同一种疾病。散点图的圆圈面积与各亚组患者占比成正比。TPR差异为五次运行的平均值±95%置信区间(CI),通过箭头标示在均值散点图周围。疾病标签中TPR差异为负值的"女性"和"男性"患者数量分别为7/13和6/13。其中"Edema"(Ed)是最有利/最不利亚组间差距最小(0.000)的标签,而"Consolidation"(Co)差距最大(0.139)。各标签最有利/最不利亚组间的平均跨标签差距为0.062。

Fig. A4. The sorted distribution of the TPR sex disparity in ChestXray8 dataset per disease. The $x$ -axis labels are the disease names. The scatter plot’s circle area is proportional to the patients percentages per subgroup. The TPR disparities are averaged over five run $\pm95%$ CI. The $95%$ CI are shown with arrows around the TPR disparities mean scatter plot. Count of ‘Female’ and ‘Male’ patients with negative disparities in disease labels are 8/14 and 6/14. Here, ‘Mass’ (‘M’) is the label with the smallest gap (0.001) between the least/most favorable subgroups, where ‘Card iomega ly’ (‘Cd’) has the largest gap (0.393). The average cross labels gap between the the least/most favorable subgroups are 0.190.
图 A4: ChestXray8数据集中每种疾病的TPR性别差异排序分布。x轴标签为疾病名称。散点图中圆圈面积与各亚组患者占比成正比。TPR差异为五次运行的平均值±95%置信区间(CI),箭头表示95% CI范围。疾病标签呈负差异的"女性"与"男性"患者数量分别为8/14和6/14。其中"肿块"(M)是最优/最劣亚组间差距最小的标签(0.001),而"心脏扩大"(Cd)差距最大(0.393)。所有标签的最优/最劣亚组间平均差距为0.190。

Fig. A5. The sorted distribution of the TPR age disparity in ALL dataset per disease. The $x$ -axis labels are the disease names. The scatter plot’s circle area is proportional to the percentage of patients in each subgroup. The TPR disparities are averaged over five run $\pm95%$ CI. The $95%$ CI are shown with arrows around the mean of TPRs scatter plot. The count of patients in age subgroups ‘40-60’, ‘60-80’, ‘20-40’,‘80-’ and $\mathrm{\hbar}0{-}20^{\circ}$ with negative gap in disease labels are 2/7, 2/7, 4/7, 4/7 and 5/7. Thus ypung patients 0-20 are the most unfavorable subgroups where patients 40-60 and 60-80 are the most favorable subgroups with $5/7$ count of positive gaps over disease labels. The average cross labels gaps between the the least/most favorable subgroups is 0.215. Here, ‘Effusion’ is the label with the smallest gap (0.115) between the least/most favorable subgroups, where ‘No Finding’ has the largest gap (0.444).
图 A5: ALL数据集中按疾病分类的TPR年龄差异排序分布。x轴标签为疾病名称。散点图中圆圈面积与各亚组患者占比成正比。TPR差异为五次运行的平均值±95%置信区间(CI),通过箭头标示在TPR散点均值周围。年龄亚组"40-60"、"60-80"、"20-40"、"80-"及"ℏ0-20°"在疾病标签中呈现负差异的患者比例分别为2/7、2/7、4/7、4/7和5/7。因此0-20岁年轻患者是最不利亚组,而40-60岁与60-80岁患者以5/7的正差异比例成为最有利亚组。最不利/最有利亚组间的跨标签平均差异为0.215,其中"Effusion"的组间差异最小(0.115),"No Finding"的组间差异最大(0.444)。

Fig. A6. The sorted distribution of the TPR age disparity in MIMIC-CXR dataset per disease. The $x$ -axis labels are the disease labels. Here, the label Lung Opacity and Airspace Opacity label in Table 2 refer to the same disease. The scatter plot’s circle area is proportional to the percentage of patients in each subgroup. The TPR disparities are averaged over five run $\pm95%$ CI. The $95%$ CI are shown with arrows around the mean of TPRs scatter plot. Count of patients in age subgroups ‘40-60’, ‘60-80’, ‘20-40’,‘80-’ and ‘0-20’ with negative gap in disease labels are 4/13, 3/13, 7/13, 4/13 and 7/13. Thus, patients 0-20 and 20-40 are the most favorable subgroups where patient 60-80 with 10/13 positive disparities are the most favorable subgroup. Here, ‘Support Devices’ is the label with the smallest gap (0.091) between the least/most favorable subgroups, where ‘Card iomega ly’ has the largest gap (0.440). The average cross labels gap between the the least/most favorable subgroups are 0.245.
图 A6: MIMIC-CXR数据集中每种疾病的TPR年龄差异排序分布。x轴标签为疾病名称。表2中的Lung Opacity和Airspace Opacity标签指向同一种疾病。散点图的圆圈面积与各亚组患者占比成正比。TPR差异为五次运行的平均值±95%置信区间(CI),通过箭头标示在TPR散点图均值周围。年龄亚组"40-60"、"60-80"、"20-40"、"80-"和"0-20"在疾病标签中呈现负差异的患者比例分别为4/13、3/13、7/13、4/13和7/13。因此,0-20岁和20-40岁患者是最有利亚组,而60-80岁患者在10/13阳性差异中表现最优。"Support Devices"是最优/最劣亚组间差距最小的标签(0.091),"Cardiomegaly"则是差距最大的标签(0.440)。所有标签中最优/最劣亚组间平均差异为0.245。

Fig. A7. The sorted distribution of the TPR age disparity in CheXpert dataset per disease. The $x$ -axis labels are the disease labels. Here, the label Lung Opacity and Airspace Opacity label in Table 2 refer to the same disease. The scatter plot’s circle area is proportional to the percentage of patients in each subgroup. The TPR disparities are averaged over five run $\pm95%$ CI (CI are shown with arrows around the mean). Count of patients in age subgroups ‘40-60’, ‘60-80’, ‘20-40’,‘80-’ and ‘0-20’ with negative gap in disease labels are 5/13, 6/13, 7/13, 7/13 and 7/13. Here, ‘Support Devices’ (‘SD’) is the label with the smallest gap (0.082) between the least/most favorable subgroups, where ‘No Finding’ (‘NF’) has the largest gap (0.604). The average cross labels gap between the the least/most favorable subgroups are 0.270.
图 A7: CheXpert数据集中各疾病TPR年龄差异的排序分布。x轴标签为疾病名称。表2中的Lung Opacity和Airspace Opacity标签指向同一种疾病。散点图的圆圈面积与各亚组患者占比成正比。TPR差异为五次运行的平均值±95%置信区间(置信区间以箭头形式显示在均值周围)。在疾病标签呈现负差异的年龄亚组"40-60"、"60-80"、"20-40"、"80-"和"0-20"中患者数量占比分别为5/13、6/13、7/13、7/13和7/13。其中"Support Devices"(SD)是最有利/最不利亚组间差异最小的标签(0.082),而"No Finding"(NF)差异最大(0.604)。各标签最有利/最不利亚组间的平均差异为0.270。

Fig. A8. The sorted distribution of the TPR age disparity in ChestXray8 dataset per disease. The $x$ -axis labels are the disease labels. The scatter plot’s circle area is proportional to the patients membership. The TPR disparities are averaged over five run $\pm95%\mathrm{CI}$ (the CI are shown with arrows around the mean). Count of patients in age subgroups ‘40-60’, $\mathrm{{^66}0{-80}^{,}}$ , ‘20-40’,‘80-’ and $\mathrm{\hbar0-20^{\circ}}$ with negative gap in disease labels are 6/14, 7/14, 4/14, 6/14 and 6/14. Here, ‘Infiltration’ (‘In’) is the label with the smallest gap (0.188) between the least/most favorable subgroups, where ‘Emphysema’ (‘Em’) has the largest gap (1.00). The average cross labels gap between the the least/most favorable subgroups are 0.413.
图 A8: ChestXray8数据集中每种疾病的TPR年龄差异排序分布。x轴标签为疾病名称。散点图中圆圈面积与患者数量成正比。TPR差异为五次运行的平均值±95%置信区间(置信区间通过箭头显示在均值周围)。在疾病标签呈现负差异的年龄亚组"40-60"、"60-80"、"20-40"、"80-"和"0-20"中,患者数量占比分别为6/14、7/14、4/14、6/14和6/14。其中,"浸润"(In)是最有利/最不利亚组间差异最小的标签(0.188),而"肺气肿"(Em)差异最大(1.00)。所有标签中最有利/最不利亚组间的平均差异为0.413。

Fig. A9. The sorted distribution of the TPR insurance type disparity in MIMIC-CXR dataset per disease.The $x$ -axis labels are the disease names. Here, the label Lung Opacity and Airspace Opacity label in Table 2 refer to the same disease. The scatter plot’s circle area is proportional to the patients membership. The TPR disparities are averaged over five run ±95%CI (the CI are shown with arrows around the mean). Count of patients in insurance subgroups ‘Other’, ‘Medicare’, and ‘Medicaid’ with negative gap in disease labels are 3/13, 6/13, and 10/13. The patients with ‘Medicaid’ insurance are the most unfavorable subgroup where ‘Other’ are the most favorable subgroup with 10/13 positive disparity count. Here, ‘Support Devices’ is the label with the smallest gap (0.021) between the least/most favorable subgroups, where ‘Pleural Other’ has the largest gap (0.190). The average cross labels gap between the the least/most favorable subgroups are 0.100.
图 A9: MIMIC-CXR数据集中各疾病TPR保险类型差异的排序分布。x轴标签为疾病名称。此处表格2中的Lung Opacity和Airspace Opacity标签指代同一疾病。散点图的圆圈面积与患者数量成正比。TPR差异为五次运行的平均值±95%置信区间(置信区间通过箭头显示在均值周围)。保险子组'Other'、'Medicare'和'Medicaid'中疾病标签负差距的患者计数分别为3/13、6/13和10/13。'Medicaid'保险患者是最不利子组(10/13正差异计数),而'Other'是最有利子组。'Support Devices'是最小差距标签(0.021),'Pleural Other'是最大差距标签(0.190)。最有利/最不利子组间跨标签平均差距为0.100。