UniTraj: A Unified Framework for Scalable Vehicle Trajectory Prediction
UniTraj: 可扩展车辆轨迹预测的统一框架
Abstract. Vehicle trajectory prediction has increasingly relied on datadriven solutions, but their ability to scale to different data domains and the impact of larger dataset sizes on their generalization remain underexplored. While these questions can be studied by employing multiple datasets, it is challenging due to several discrepancies, e.g., in data formats, map resolution, and semantic annotation types. To address these challenges, we introduce UniTraj, a comprehensive framework that unifies various datasets, models, and evaluation criteria, presenting new opport unities for the vehicle trajectory prediction field. In particular, using UniTraj, we conduct extensive experiments and find that model performance significantly drops when transferred to other datasets. However, enlarging data size and diversity can substantially improve performance, leading to a new state-of-the-art result for the nuScenes dataset. We provide insights into dataset characteristics to explain these findings. The code can be found here: https://github.com/vita-epfl/UniTraj.
摘要:车辆轨迹预测日益依赖数据驱动的解决方案,但其跨数据领域的扩展能力以及更大规模数据集对泛化性能的影响仍缺乏深入研究。虽然这些问题可通过使用多个数据集来探究,但由于数据格式、地图分辨率和语义标注类型等差异,研究面临挑战。为此,我们提出UniTraj框架,该框架统一了多种数据集、模型和评估标准,为车辆轨迹预测领域带来新机遇。基于UniTraj的实验表明:模型迁移至其他数据集时性能显著下降,但扩大数据规模和多样性可大幅提升性能,并在nuScenes数据集上取得新的最优结果。我们通过分析数据集特征阐释了这些发现。代码见:https://github.com/vita-epfl/UniTraj。
Keywords: Vehicle trajectory prediction · Multi-dataset framework · Domain generalization
关键词:车辆轨迹预测 · 多数据集框架 · 领域泛化
1 Introduction
1 引言
Predicting the trajectories of surrounding vehicles is essential for ensuring the safety and collision avoidance of autonomous driving systems. With the advent of deep learning, researchers have turned to data-driven solutions to tackle this prediction task. However, while these models can achieve high accuracy, they are heavily reliant on the specific data domain used for training.
预测周围车辆的轨迹对于确保自动驾驶系统的安全性和防撞至关重要。随着深度学习的兴起,研究人员转向数据驱动的解决方案来解决这一预测任务。然而,尽管这些模型可以实现高精度,但它们严重依赖于训练所用的特定数据领域。
An autonomous driving system may encounter various situations such as diverse geographical locations. These various situations introduce data domain shifts, which can significantly impact the performance of the prediction models. Consequently, it is essential to study the performance of the models across diverse domains, such as datasets and cities. However, despite the importance of the question, the generalization of models to different domains has not been adequately studied yet. Therefore, our first Research Question (RQ1) is to investigate the performance drop of trajectory prediction models when transferred to new domains.
自动驾驶系统可能遇到多样化的地理位置等复杂场景。这些多样化场景会引发数据域偏移 (domain shift) ,显著影响预测模型的性能。因此,研究模型在不同域(如数据集和城市)中的表现至关重要。然而,尽管该问题意义重大,模型跨域泛化能力尚未得到充分研究。因此,我们的第一个研究问题 (RQ1) 是探究轨迹预测模型迁移到新域时的性能下降情况。
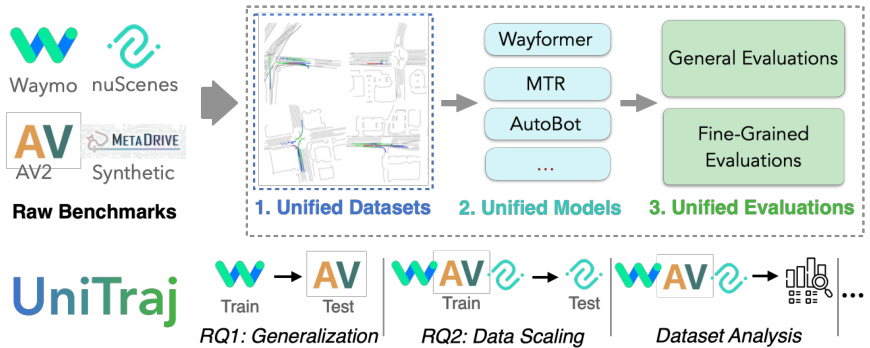
Fig. 1: UniTraj framework. The framework unifies various datasets, forming the largest vehicle trajectory prediction dataset available. It also includes multiple stateof-the-art prediction models and various evaluation strategies, making it suitable for trajectory prediction experimentation. The framework enables the study of diverse Research Questions, including (RQ1) the generalization of trajectory prediction models across different domains and (RQ2) the impact of data size on prediction performance.
图 1: UniTraj框架。该框架整合了多种数据集,构成了当前最大的车辆轨迹预测数据集。同时包含多个最先进的预测模型及多样化评估策略,适用于轨迹预测实验研究。该框架支持探索多种研究问题,包括 (RQ1) 轨迹预测模型在不同领域的泛化能力,以及 (RQ2) 数据规模对预测性能的影响。
A potential solution to improve the generalization ability of prediction models is to scale up the sizes of the datasets to cover a broader spectrum of driving scenarios. While there is a trend in extending datasets’ sizes [8,10,14,52], the impact of dataset size on the performance of trajectory prediction models remains largely unexplored. Our second research question (RQ2) is then to study the impact of increasing dataset sizes on the performance of the prediction models.
提升预测模型泛化能力的一个潜在解决方案是扩大数据集规模,以覆盖更广泛的驾驶场景。虽然当前存在扩展数据集规模的趋势[8,10,14,52],但数据集大小对轨迹预测模型性能的影响在很大程度上仍未得到探索。因此,我们的第二个研究问题(RQ2)是研究增加数据集规模对预测模型性能的影响。
Exploring these two research questions involves leveraging multiple trajectory prediction datasets. Firstly, these datasets provide diverse domains, allowing for a thorough examination of model generalization across different domains (RQ1). Secondly, combining these datasets creates a much larger dataset, enabling an exploration of the asymptotic limits of data scaling (RQ2). However, significant challenges exist when attempting to leverage multiple datasets. (1) Each of these datasets has a unique data format, posing practical difficulties for researchers utilizing multiple datasets. (2) Each of the datasets undergoes collection and annotation through distinct strategies, with semi-automatic pre-annotations and manual curations [7,8,14]. This leads to multiple discrepancies such as variations in resolution, sampling rates, and types of semantic annotations. (3) Comparing model performance across datasets is not straightforward due to varying dataset settings (e.g., prediction horizons) and evaluation metrics (e.g., mAP metric is used in WOMD [14] and brier-FDE metric in Argoverse 2 [52]). In short, while each of the datasets contributes to the progress in the field, they have been developed independently, without considering harmonization with existing ones.
探索这两个研究问题需要利用多个轨迹预测数据集。首先,这些数据集提供了多样化的领域,能够全面检验模型在不同领域的泛化能力 (RQ1)。其次,合并这些数据集可以形成更大的数据集,从而探索数据扩展的渐近极限 (RQ2)。然而,在尝试利用多个数据集时存在重大挑战。(1) 每个数据集都有独特的数据格式,给研究人员使用多个数据集带来了实际困难。(2) 每个数据集通过不同的策略进行收集和标注,包括半自动预标注和人工校验 [7,8,14],这导致了分辨率、采样率和语义标注类型等多方面的差异。(3) 由于数据集设置 (如预测时间范围) 和评估指标 (如 WOMD [14] 使用 mAP 指标,Argoverse 2 [52] 使用 brier-FDE 指标) 的不同,跨数据集比较模型性能并不简单。简而言之,虽然每个数据集都推动了该领域的进步,但它们都是独立开发的,没有考虑与现有数据集的协调性。
As a result, many trajectory prediction studies train and evaluate their models using a single dataset $[2,3,5,9,13,20,22,30,34,37,48].$
因此,许多轨迹预测研究使用单一数据集训练和评估模型 [2,3,5,9,13,20,22,30,34,37,48]。
To tackle these challenges, we introduce ‘UniTraj’, a comprehensive vehicle trajectory prediction framework. UniTraj seamlessly integrates and unifies multiple data sources (including nuScenes [7], Argoverse 2 [52] and Waymo Open Motion Dataset - WOMD [14]), models (including AutoBot [17], MTR [48], and Wayformer [35]), and evaluations. UniTraj not only serves as a solution to tackle our research questions but also provides a comprehensive and flexible platform for the community. First, it is designed for the effortless inclusion of new datasets by proposing a unified data structure compatible with various datasets. Second, Unitraj supports and simplifies the integration of new methods by providing numerous essential data processing and loss functions relevant to the trajectory prediction task. Lastly, UniTraj offers unified evaluation metrics, as well as diverse and insightful evaluation approaches, such as analyzing performance on the long-tail data instances as well as different clusters of data samples to allow a more in-depth understanding of model behavior. Figure 1 shows the overview of the framework.
为应对这些挑战,我们推出了"UniTraj"——一个综合的车辆轨迹预测框架。UniTraj无缝整合并统一了多数据源(包括nuScenes [7]、Argoverse 2 [52]和Waymo开放运动数据集-WOMD [14])、多模型(包括AutoBot [17]、MTR [48]和Wayformer [35])以及评估体系。该框架不仅为研究问题提供了解决方案,更为学界提供了全面灵活的平台。首先,通过提出兼容多种数据集的统一数据结构,实现新数据集的便捷接入;其次,通过提供轨迹预测任务所需的关键数据处理和损失函数,支持并简化新方法的集成;最后,提供统一的评估指标及多维深度评估方法(如分析长尾数据实例表现和数据样本聚类表现),以深入理解模型行为。图1展示了框架概览。
We conduct extensive experiments using the UniTraj framework to shed light on our two research questions. Our findings reveal a large performance drop when transitioning between data sources, alongside variations in the generalization abilities induced by different datasets (RQ1). We also show that scaling up dataset size and diversity can enhance model performance significantly without any architectural modifications, leading us to rank $1^{\mathrm{st}}$ in the nuScenes public leader board. This is accomplished by training models on all existing datasets in the framework. This unified dataset forms the largest public data one can use to train a vehicle trajectory prediction model, with more than 2M samples, 1337 hours of data, and 15 different cities. Finally, by providing an in-depth analysis of the datasets, we offer a more comprehensive understanding of their characteristics. Our analysis reveals that the datasets’ generalization capabilities are not only attributed to their size, but also their intrinsic diversity. We believe that the framework opens up new opportunities in the trajectory prediction field, and we will release the framework to foster further advancements. In summary, our contributions are as follows:
我们利用UniTraj框架进行了大量实验,以解答两个研究问题。研究发现,在数据源切换时会出现显著的性能下降,同时不同数据集引发的泛化能力也存在差异(RQ1)。实验还表明,在不改变模型架构的情况下,扩大数据集规模和多样性可显著提升模型性能,这使我们在nuScenes公开排行榜中取得了第一名的成绩。这一成果是通过在框架内所有现有数据集上训练模型实现的。该统一数据集构成了当前最大的公开车辆轨迹预测训练资源,包含超过200万样本、1337小时数据量,覆盖15个不同城市。最后,通过对数据集的深度分析,我们对其特性形成了更全面的认知。分析表明,数据集的泛化能力不仅取决于规模,更源于其内在多样性。我们相信该框架为轨迹预测领域开辟了新机遇,并将公开框架以促进后续研究。本文的主要贡献包括:
2 Previous work
2 相关工作
Trajectory prediction datasets. Many academic and industrial laboratories have paved the way for research development by open-sourcing real-world driving datasets [6–8, 10, 14, 19, 33, 38, 52, 57]. Notably, Argoverse [10] was among the pioneers in releasing the lane graph information, nuScenes [7] expanded the variety of scenes, Waymo [14] enriched their dataset with fine-grained information, and recently, Argoverse 2 [52] released the largest data in terms of unique roadways. While these datasets contribute to field developments, they have been developed in isolation without considering harmonization with former datasets. Thus, there exist multiple challenges in combining them due to various incompati bil i ties. This work addresses the challenges through a unified framework.
轨迹预测数据集。众多学术和工业实验室通过开源真实世界驾驶数据集[6–8, 10, 14, 19, 33, 38, 52, 57]为研究发展铺平了道路。其中,Argoverse [10]率先发布了车道图信息,nuScenes [7]扩展了场景多样性,Waymo [14]通过细粒度信息丰富了数据集,而近期Argoverse 2 [52]发布了在独特道路数量方面规模最大的数据。尽管这些数据集推动了领域发展,但它们各自独立开发,未考虑与先前数据集的协调性。因此,由于多种不兼容性,在整合这些数据集时存在诸多挑战。本研究通过统一框架应对这些挑战。
Trajectory prediction benchmarks. Multi-dataset benchmarks have already been explored in various domains such as object detection [59], semantic segmentation [24, 47], and pose prediction [41]. In the field of trajectory prediction, such benchmarks have primarily been developed for human trajectory prediction [1, 39, 42]. Notably, Trajnet++ [26] provides an interaction-centric benchmark by categorizing trajectories based on the presence of an interaction. trajdata [21] is a unified interface to multiple human trajectory datasets incorporating scene context into the inputs. A related work for the task of vehicle trajectory planning is Scenario Net [28], a simulator aggregating multiple realworld datasets into a unified format and providing a planning development and evaluation framework. To the best of our knowledge, we are the first to propose an open-source framework for vehicle trajectory prediction. Our framework is not limited to including multiple datasets; it also integrates a variety of trajectory prediction models and evaluation methodologies, thereby providing a comprehensive resource for advancing research and development in the vehicle trajectory prediction task.
轨迹预测基准。多数据集基准已在多个领域得到探索,如目标检测 [59]、语义分割 [24, 47] 和姿态预测 [41]。在轨迹预测领域,此类基准主要针对人类轨迹预测开发 [1, 39, 42]。值得注意的是,Trajnet++ [26] 通过基于交互存在性对轨迹进行分类,提供了一个以交互为中心的基准。trajdata [21] 是一个统一的多人类轨迹数据集接口,将场景上下文纳入输入。车辆轨迹规划任务的相关工作是 Scenario Net [28],这是一个将多个真实世界数据集聚合为统一格式并提供规划开发与评估框架的模拟器。据我们所知,我们是首个提出车辆轨迹预测开源框架的团队。该框架不仅限于包含多数据集,还整合了多种轨迹预测模型与评估方法,从而为推进车辆轨迹预测任务的研究与开发提供了全面资源。
Generalization of trajectory prediction models. The discrepancies in data formats in vehicle trajectory prediction datasets hinder research on cross-dataset generalization, leading to limited studies in this area. In [55], one dataset is divided into different domains to explore model generalization. Authors in [46] propose an epistemic uncertainty estimation approach and perform cross-dataset evaluation. In [16], the authors studied cross-dataset generalization of models and showed a performance gap between datasets. However, they provide limited insights into the sources of the generalization gap. Moreover, their code is not publicly available. Previous works also investigated some generalization aspects of trajectory prediction models when they deal with new scenes and cities [11, 27, 31], new agent types [27], using perception outputs instead of curated annotations [51, 53, 58], and facing adversarial situations [3, 40, 43]. In this work, we conduct more extensive and in-depth cross-dataset, and cross-city analyses as well as multi-dataset training. Moreover, we provide insights into the dataset characteristics, explaining the findings. We also release an open-source framework to facilitate this line of research.
轨迹预测模型的泛化能力。车辆轨迹预测数据集中数据格式的差异阻碍了跨数据集泛化研究,导致该领域研究有限。在[55]中,作者将数据集划分为不同域来探索模型泛化性。[46]提出认知不确定性估计方法并进行跨数据集评估。[16]研究了模型的跨数据集泛化性能,揭示了数据集间的性能差距,但未深入分析泛化差距的根源,且未公开代码。先前研究还探讨了轨迹预测模型在新场景城市[11,27,31]、新智能体类型[27]、使用感知输出替代人工标注[51,53,58]及对抗场景[3,40,43]下的泛化表现。本研究进行了更广泛深入的跨数据集、跨城市分析及多数据集训练,从数据集特征角度解释研究发现,并开源研究框架以推动该领域发展。
Table 1: Summary of the discrepancies in data features. The table shows the features for each dataset and the unified version of the features. Most of the unified features are flexible and can be chosen by the user.
表 1: 数据特征差异汇总。该表展示了各数据集的特征及其统一版本。大部分统一特征具有灵活性,可由用户自行选择。
| Argoverse2 | WOMD | nuScenes | UniTraj | ||
|---|---|---|---|---|---|
| 坐标系 | 场景中心 | 场景中心 | 场景中心 | 智能体中心 | |
| 时间长度 | 过去 | 5秒 | 1秒 | 2秒 | [0-8]秒 |
| 未来 | 6秒 | 8秒 | 6秒 | [1-8]秒 | |
| 智能体特征 | 标注 | 速度,航向 | 速度,航向 | 速度,航向 | 速度,航向 |
| 其他信息 | 2D | 3D包围盒尺寸 | 2D | 加速度 2D | |
| 坐标 | 2D | 3D | 2D | 2D | |
| 地图特征 | 范围 | ~200米 | ~200米 | ~500米 | [0-500]米 |
| 分辨率 | 0.2米~2米 | ~0.5米 | ~1米 | [0.2-2]米 | |
| 坐标 | 2D | 3D | 2D | 2D |
3 UniTraj framework
3 UniTraj框架
The UniTraj framework, illustrated in Figure 1, consists of three main components. The first component unifies the format and features of various datasets (see Section 3.1). The second component adapts trajectory prediction models to the unified data format, facilitating their training (see Section 3.2). The final component consists of a comprehensive and shared evaluation process for the models (see Section 3.3). The integration of the components allows for diverse experimentation, such as cross-dataset training, evaluation, and dataset analysis.
图 1 所示的 UniTraj 框架包含三个主要组件。第一个组件统一了各类数据集的格式和特征 (见第 3.1 节)。第二个组件使轨迹预测模型适配统一数据格式,便于模型训练 (见第 3.2 节)。最后一个组件包含一套全面共享的模型评估流程 (见第 3.3 节)。这些组件的集成支持多样化实验,例如跨数据集训练、评估和数据集分析。
3.1 Unified data
3.1 统一数据
Two types of discrepancies are found across trajectory forecasting datasets: data formats and data features. The former amounts to differences in the way data is structured and organized, while the latter stems from differences in the characteristics of the data itself, such as spatio-temporal resolution, range, and agent and map annotation taxonomy. In this section, we present solutions to tackle both types of discrepancies.
轨迹预测数据集中存在两类差异:数据格式和数据特征。前者指数据结构和组织方式的差异,后者源于数据本身特性的不同,例如时空分辨率、范围、智能体与地图标注分类体系等。本节将针对这两种差异提出解决方案。
Unified data format: To address the issue of different data formats used in trajectory prediction datasets, such as TFRecord in WOMD [14] and Apache Parquet in Argoverse 2 [52], we utilize Scenario Net [28]. Scenario Net was initially designed for traffic scenario simulation and modeling, but we repurposed it for the vehicle trajectory prediction task. It provides a unified scenario description format containing HD maps and detailed object annotations, which simplifies the process of decoding the dataset with different formats. Scenario Net currently supports converting WOMD, nuScenes, and nuPlan, and we extend its support to Argoverse 2 for our research. This reduces the need for multiple versions of preprocessing code to extract information from raw datasets and create batched data for the training of prediction models.
统一数据格式:为解决轨迹预测数据集中使用不同格式(如WOMD [14]中的TFRecord和Argoverse 2 [52]中的Apache Parquet)的问题,我们采用了Scenario Net [28]。该工具最初设计用于交通场景仿真与建模,现被我们改造应用于车辆轨迹预测任务。它提供包含高精地图和详细物体标注的统一场景描述格式,简化了不同格式数据集解码流程。Scenario Net当前支持转换WOMD、nuScenes和nuPlan数据集,我们为其扩展了对Argoverse 2的支持。这减少了从原始数据集提取信息并生成预测模型训练批量数据时所需的多版本预处理代码。
Unified data features: Despite the data being converted into a unified format, significant discrepancies persist across the datasets, affecting model performance. For example, the scenarios are 11 seconds long in Argoverse 2, while they are 9 seconds in WOMD; or the precision of map annotations are 1 meters in nuScenes while they are 0.5 meters in WOMD. Therefore, we aim to harmonize these discrepancies and minimize their impact on the model’s performance. Table 1 summarizes the discrepancies and the unified features. Our data processing approach involves specific harmonization s, including the following:
统一数据特征:尽管数据已转换为统一格式,但不同数据集间仍存在显著差异,影响模型性能。例如Argoverse 2的场景时长为11秒,而WOMD中为9秒;nuScenes的地图标注精度为1米,WOMD则为0.5米。为此我们致力于协调这些差异,最小化其对模型性能的影响。表1总结了差异项与统一特征。我们的数据处理方法包含以下特定协调措施:
Coordinate Frame. Recent trajectory prediction models predominantly utilize vectorized, agent-centric data as input [17, 35, 48, 49, 60]. Our data processing pipeline is designed to transform scene-level raw data into this format. It processes traffic scenarios, which consist of multiple trajectories, and selects trajectories designated as training samples within the datasets. The pipeline then converts the entire scenario into the coordinate frames of these selected agents, and normalizes the input accordingly.
坐标系。当前轨迹预测模型主要采用以智能体为中心的矢量化数据作为输入 [17, 35, 48, 49, 60]。我们的数据处理流程旨在将场景级原始数据转换为这种格式。该流程处理包含多条轨迹的交通场景,并选择数据集中指定为训练样本的轨迹,随后将整个场景转换到这些选定智能体的坐标系中,并对输入进行相应归一化处理。
– Time Length. The trajectories in different datasets are with the same frequency of $10\mathrm{Hz}$ but with a duration ranging from 8 to 20 seconds. To standardize this aspect, we truncate all trajectories to a uniform length of 8 seconds. Within this duration, UniTraj provides the option to flexibly determine a unified length of past and future trajectories for all datasets.
- 时长。不同数据集中的轨迹频率均为 $10\mathrm{Hz}$,但持续时间从8秒到20秒不等。为统一标准,我们将所有轨迹截断为统一的8秒时长。在此时间段内,UniTraj提供了灵活确定所有数据集过去和未来轨迹统一长度的选项。
– Agent Features. Among the datasets, WOMD provides the most detailed agent information, including 3D coordinates, velocity, heading, and bounding box size, whereas nuScenes lacks certain data, like bounding box size. We standardize inputs across datasets by using 2D coordinates, velocity, and heading. Our data processing also introduces supplementary features, such as one-hot encoding of agent type and time steps of trajectories, and acceleration. These elements are combined to create a rich, unified input for the model.
– Agent Features. 在数据集中,WOMD提供了最详细的智能体信息,包括3D坐标、速度、航向和边界框尺寸,而nuScenes缺少某些数据,如边界框尺寸。我们通过使用2D坐标、速度和航向来标准化各数据集输入。数据处理中还引入了补充特征,例如智能体类型的独热编码、轨迹时间步长以及加速度。这些元素组合起来为模型创建了丰富统一的输入。
– Map Features. Datasets differ in HD map resolution. We normalize this by using linear interpolation to standardize the distance between consecutive points to 0.5 meters, with an option for further down sampling to adjust map resolution. Additionally, we enrich the data with each lane point’s direction and one-hot encode lane types. Our experiments utilize semantic map classes such as center lanes, road lines, crosswalks, speed bumps, and stop signs.
- 地图特征。数据集在高精地图分辨率上存在差异。我们通过线性插值将连续点之间的距离标准化为0.5米来统一处理,并可选择进一步降采样以调整地图分辨率。此外,我们为每个车道点添加方向信息,并对车道类型进行独热编码。实验使用了中心车道、道路标线、人行横道、减速带和停车标志等语义地图类别。
Our framework allows for customization of specific features through predefined parameters for focused single-dataset research, while still providing a standardized data format across all datasets. The data processing module supports various parameters, such as the length of historical and future trajectories, number of points per lane, map resolution, types of surrounding agents and lines, and masked attributes. Thanks to its modular structure, our data processing pipeline enables easy integration of new processing methodologies and models. The framework is equipped with multi-processing and caching mechanisms for efficient processing. Our framework currently includes four large-scale, real-world datasets with over 1337 hours of driving data from 15 cities.
我们的框架允许通过预定义参数定制特定功能,以专注于单一数据集研究,同时仍提供跨所有数据集的标准化数据格式。数据处理模块支持多种参数,例如历史和未来轨迹长度、每条车道的点数、地图分辨率、周围智能体 (agent) 和车道线类型,以及掩码属性。得益于模块化结构,我们的数据处理流程可轻松集成新的处理方法和模型。该框架配备了多进程和缓存机制以实现高效处理。目前我们的框架包含四个大规模真实世界数据集,涵盖15个城市超过1337小时的驾驶数据。
3.2 Unified models
3.2 统一模型
Trajectory prediction models are often implemented in different pipelines, making direct comparisons challenging and fairness hard to ensure. We integrate three recent trajectory prediction models within the UniTraj framework. These models were chosen based on their state-of-the-art results on various benchmarks, indicating the research value of their designs. We include:
轨迹预测模型通常采用不同的实现流程,这使得直接比较具有挑战性且难以确保公平性。我们在UniTraj框架中整合了三种近期提出的轨迹预测模型。这些模型的筛选依据是它们在各类基准测试中的前沿性能表现,这体现了其设计理念的研究价值。具体包括:
The models’ capacities cover a large range (1.5M parameters for AutoBot, 60.1M for MTR, and 16.5M for Wayformer), enabling research on model size and scaling.
模型参数量覆盖范围广泛(AutoBot为150万参数,MTR为6010万参数,Wayformer为1650万参数),便于开展模型规模与扩展性研究。
Integrating new models: The flexibility of UniTraj’s data processing pipeline greatly simplifies the integration of new models. Furthermore, we provide a standardized output format, enabling seamless use of UniTraj’s evaluation and logging tools.
集成新模型:UniTraj数据处理流程的灵活性极大简化了新模型的集成。此外,我们提供了标准化输出格式,使得UniTraj的评估与日志工具能够无缝衔接使用。
3.3 Unified evaluation
3.3 统一评估
In trajectory prediction, various metrics have been proposed to evaluate the models, yet there is no consensus about them. As a result, each dataset provides a different set of evaluation metrics, making it challenging to compare performances across datasets. For example, WOMD employs mean average precision (mAP) metric [14] while Argoverse 2 uses brier minimum Final Displacement Error (brier-minFDE) [52]. Our framework provides a unified set of metrics to allow comprehensive and consistent evaluation across different datasets. To this end, we employ two sets of metrics: general and fine-grained evaluation metrics.
在轨迹预测领域,虽然已提出多种评估模型的指标,但尚未形成统一标准。这导致不同数据集采用各异的评估体系,难以跨数据集比较性能。例如,WOMD采用平均精度均值(mAP)指标[14],而Argoverse 2使用布赖尔最小最终位移误差(brier-minFDE)[52]。我们的框架提供统一指标集,支持跨数据集的全面一致评估。为此,我们采用两套指标:通用评估指标和细粒度评估指标。
General evaluations: The most common metrics in the literature are the ones that provide an overall score based on accuracy measures by comparing the output with the ground truth in different aspects. We include the following three general metrics in the framework: 1) Minimum Average / Final Displacement Error (minADE/minFDE): It represents the minimum average/final displacement error between the predictions and the ground truth. The minimum is computed over the 6 modes of the output.
通用评估指标:文献中最常见的指标是基于准确度测量,通过将输出与不同方面的真实值进行比较来提供总体评分。我们在框架中包含以下三种通用指标:1) 最小平均/最终位移误差 (minADE/minFDE):表示预测值与真实值之间的最小平均/最终位移误差。最小值是在输出的6种模态上计算的。
- Miss Rate (MR): It is defined as the ratio of the samples with minFDE exceeding 2 meters, and is useful where up to 2 meters deviation is acceptable. 3) Brier Minimum Final Displacement Error (brier-minFDE): While the previous metrics focus on covering the ground truth, they do not account for the probability assigned to each predicted trajectory. The brier-minFDE metric addresses this by adding a penalty term, $(1-p)^{2}$ , to the minFDE where $p$ corresponds to the probability of the trajectory that best matches the ground truth.
- 漏检率 (MR): 定义为 minFDE 超过 2 米的样本比例,适用于可接受最多 2 米偏差的场景。
- 布里尔最小最终位移误差 (brier-minFDE): 虽然前述指标关注覆盖真实轨迹,但未考虑每条预测轨迹的分配概率。该指标通过为 minFDE 添加惩罚项 $(1-p)^{2}$ 来解决这一问题,其中 $p$ 表示最匹配真实轨迹的预测轨迹概率。
Fine-grained evaluations: We also provide two fine-grained evaluations.
细粒度评估:我们还提供了两项细粒度评估。
(1) Trajectory types. Datasets usually exhibit a significant prevalence of ‘straight’ trajectories, resulting in heavily imbalanced datasets. Besides, we argue that rare trajectory types can sometimes be the more safety-critical ones. Therefore, it is critical to specifically access prediction performances on rare situations and trajectory types. To address this, the UniTraj framework enables the stratification of evaluation metrics based on trajectory types. In practice, we adopt the trajectory taxonomy defined in the WOMD challenge [14], to categorize trajectories into the following groups: ‘stationary’, ‘straight’, ‘straight left’, ‘straight right’, ‘left-turn’, ‘right-turn’, ‘left u-turn’, ‘right u-turn’. While the use of this taxonomy provides valuable insights, its scope has limitations as it does not account for variations in motion dynamics. For instance, it does not differentiate between straight accelerating and decelerating trajectories, both of which are categorized as ‘straight’. Consequently, we additionally use the notion of ‘Kalman difficulty’ introduced below.
(1) 轨迹类型。数据集通常显著偏向"直线"轨迹,导致数据分布严重不平衡。此外,我们认为罕见的轨迹类型有时反而更具安全关键性。因此,特别评估模型在罕见场景和轨迹类型上的预测性能至关重要。为解决这一问题,UniTraj框架支持根据轨迹类型对评估指标进行分层计算。实践中,我们采用WOMD挑战赛[14]定义的轨迹分类法,将轨迹划分为以下类别:"静止"、"直线"、"左偏直线"、"右偏直线"、"左转"、"右转"、"左掉头"、"右掉头"。虽然该分类法能提供有价值的分析视角,但其局限性在于未考虑运动动力学变化。例如,它无法区分直线加速与减速轨迹,二者均被归类为"直线"。为此,我们额外引入了下文所述的"卡尔曼难度"概念。
(2) Kalman difficulty. Some situations are more challenging to forecast than others, typically when the future is not a simple extrapolation of the past and when contextual factors play a significant role. The context encloses various elements such as map data, social interactions, or input signals coming from perception. Moreover, previous works [4, 32, 50] observe that these complex scenarios, while critical, are much less frequent than scenarios that are easier to forecast. To specifically evaluate the performance over critical cases, and reduce evaluation noise coming from the large number of simple scenarios, the authors in [32] propose to filter them as the ones with a high mismatch between their ground truth and predictions from a Kalman filter [23]. We follow this idea as it offers a simple method to evaluate how challenging a situation is. Accordingly, UniTraj stratifies evaluation metrics based on Kalman difficulty that we define as the FDE between the ground-truth trajectory and the prediction of a linear Kalman filter.
(2) Kalman难度。某些场景比其他情况更难预测,尤其是当未来无法简单通过过去数据外推,且环境因素起重要作用时。这类环境因素包括地图数据、社交互动或感知输入的信号等多元要素。此外,已有研究[4,32,50]指出,这些复杂场景虽然关键,但出现频率远低于易预测场景。为针对性评估关键场景下的性能,并减少大量简单场景带来的评估噪声,文献[32]作者提出通过筛选真实轨迹与卡尔曼滤波器[23]预测结果间高失配度的场景作为评估对象。我们沿用该方法,因其提供了一种简单评估场景挑战性的途径。据此,UniTraj基于Kalman难度(定义为真实轨迹与线性卡尔曼滤波器预测间的最终位移误差(FDE))对评估指标进行分层。
4 Experiments
4 实验
The UniTraj framework opens up new opportunities for research and experimentation. This section presents experiments highlighting these opportunities, focusing on cross-domain (i.e., cross-dataset and cross-city) generalization (RQ1) in Section 4.1, and data scaling impact (RQ2) for trajectory prediction models in Section 4.2. We provide fine-grained dataset analyses and discussions in Section 4.3. Additional experiments in the appendix, such as continual learning and synthetic-to-real transfer, further demonstrate the framework’s research utility. Experimental settings: We replicate the model configurations and hyperparameters from their original implementations. Throughout the experiments, we have limited the training and validation samples to vehicle trajectories. The map range extends to a 100m radius with a spatial resolution of 0.5m. The temporal parameters are set to 2 seconds of historical trajectories and 6 second future trajectories. For our multi-dataset training experiments, we utilize WOMD [14], Argoverse 2 [52], and nuScenes [7] datasets. Since the nuPlan [8] dataset is oriented towards planning tasks and lacks an official training/validation set for prediction tasks, we exclusively use it for the cross-city generalization studies due to its large number of samples for different cities. We only report the results with the brier-minFDE metric and leave other metrics for the appendix.
UniTraj框架为研究和实验开辟了新机遇。本节重点展示以下实验发现:4.1节探讨跨领域(即跨数据集和跨城市)泛化能力(RQ1),4.2节分析轨迹预测模型的数据规模影响(RQ2)。4.3节提供细粒度的数据集分析与讨论。附录中的持续学习和合成数据到真实场景迁移等补充实验,进一步验证了该框架的研究价值。
实验设置:我们复现了原始实现的模型配置与超参数。所有实验均限定使用车辆轨迹作为训练和验证样本。地图范围设置为半径100米,空间分辨率0.5米。时间参数采用2秒历史轨迹和6秒未来轨迹。多数据集训练实验使用WOMD[14]、Argoverse 2[52]和nuScenes[7]数据集。由于nuPlan[8]数据集面向规划任务且未提供预测任务的官方训练/验证集,我们仅利用其多城市样本进行跨城市泛化研究。实验结果统一采用brier-minFDE指标,其他指标见附录。
4.1 Generalization evaluation
4.1 泛化性评估
Generalization to new domains is a crucial challenge for data-driven models, necessitating diverse data for comprehensive evaluation. The UniTraj framework enables the exploration of model generalization across various datasets and cities.
泛化到新领域是数据驱动模型面临的关键挑战,需要多样化数据进行全面评估。UniTraj框架支持跨不同数据集和城市探索模型泛化能力。
Cross-dataset evaluation: To assess the generalization capabilities of models, we train models on each individual dataset and evaluate their performance on all other available datasets. The findings are presented in Table 2. Analyzing the data in different columns of the table, the first observation is that all models’ performances decline significantly when models are tested on other datasets. This is a consistent trend across all of the three model architectures, and all of the considered datasets. For instance, the second column under MTR reports the performance evaluated on the validation set of Argoverse 2. It indicates that MTR achieves its peak performance when it is trained on the training set of Argoverse 2 itself, while models trained on nuScenes and WOMD exhibit significantly lower performances.
跨数据集评估:为评估模型的泛化能力,我们在各数据集上分别训练模型,并在其他可用数据集上测试其性能。结果如表2所示。通过分析表中不同列的数据,首先可观察到所有模型在其他数据集上测试时性能均显著下降。这一趋势在三种模型架构和所有涉及的数据集中均保持一致。例如,MTR列下第二栏显示其在Argoverse 2验证集上的性能表现:当使用Argoverse 2自身训练集时达到峰值性能,而使用nuScenes和WOMD训练集训练的模型则表现明显较差。
With a more detailed investigation, we can also compare the generalization capabilities of different datasets. For instance, considering the same column, the model trained on WOMD outperforms the one trained on nuScenes when evaluated on the Argoverse2 dataset. By making similar comparisons across other columns, we establish a generalization order: models trained on WOMD data exhibit the highest generalization ability, followed by those trained on Argoverse2, and then nuScenes. This order remains consistent across all models. The superior generalization of models trained on WOMD can be attributed to both the larger number of data samples and the greater variety present in the WOMD dataset. We provide a more detailed explanation in Section 4.3, where we discuss the specific characteristics of each dataset and their influence on model performance and generalization.
通过更深入的分析,我们还可以比较不同数据集的泛化能力。例如,在同一列中,当在Argoverse2数据集上评估时,基于WOMD训练的模型表现优于基于nuScenes训练的模型。通过其他列的类似对比,我们得出了泛化能力排序:基于WOMD数据训练的模型展现最高泛化能力,其次是Argoverse2,最后是nuScenes。这一排序在所有模型中保持一致。WOMD训练模型的优异泛化能力可归因于其更大的数据样本量和更高的数据多样性。我们将在4.3节详细讨论各数据集的特性及其对模型性能和泛化的影响。
Cross-city evaluation: Despite our care to standardize data formats and align features among datasets, certain fundamental discrepancies may persist caused
跨城市评估:尽管我们努力标准化数据格式并协调数据集间的特征,某些根本性差异可能仍然存在
Table 2: Cross-dataset generalization and multi-dataset training experiments. Training and validation are across multiple datasets. Rows indicate the training data of the model, columns indicate the evaluation data . ‘All’ designates the combination of the three considered datasets. The study is conducted for three models (AutoBot [17], MTR [48], and Wayformer [35]). ‘∗’ indicates our internal imple ment ation of the model. We report the brier-minFDE (↓) metric.
表 2: 跨数据集泛化与多数据集训练实验。训练和验证均在多个数据集上进行。行表示模型的训练数据,列表示评估数据。"All"表示三个数据集的组合。研究针对三个模型开展 (AutoBot [17], MTR [48] 和 Wayformer [35])。"∗"表示我们内部的模型实现。报告指标为 brier-minFDE (↓)。
| MTR [48] | Wayformer [35] | AutoBot [17] | |||||||||
|---|---|---|---|---|---|---|---|---|---|---|---|
| 训练集 | 轨迹数 | nuScenes | Argoverse2 | WOMD | nuScenes | Argoverse2 | WOMD | nuScenes | Argoverse2 | WOMD | |
| nuScenes | 32k | 2.86 | 4.50 | 7.38 | 3.06 | 4.68 | 7.16 | 3.36 | 4.48 | 6.89 | |
| Argoverse 2 | 180k | 3.72 | 2.08 | 4.68 | 3.69 | 2.38 | 4.80 | 4.35 | 2.51 | 4.43 | |
| WOMD | 1800k | 3.10 | 3.63 | 2.13 | 3.12 | 3.60 | 2.10 | 3.73 | 3.23 | 2.47 | |
| 全部 | 2012k | 2.27 | 1.99 | 2.13 | 2.32 | 2.12 | 2.09 | 3.07 | 2.54 | 2.47 |
by the data collection and annotation processes. For instance, annotation noises could still exist across datasets. To control for this potential residual discrepancy, we explore the generalization of AutoBot when the city is changed inside a single dataset. Similar to the previous experiment, we train AutoBot on each city and evaluate it on the rest of cities. We employed nuPlan [8] data for this experiment due to the large number of samples existing in diverse cities and selected 10K samples from each city. The results are shown in Table 3. It shows that the performance of AutoBot drops once evaluated on other cities. For instance, the first row shows that the model trained on Pittsburgh has the best performance on Pittsburgh (brier-minFDE 2.4) and worse performances on Boston (2.7) and Singapore (3.5). This indicates a clear generalization gap between cities, emphasizing the discrepancies between different environments. Moreover, it can also be observed that the model trained on Singapore performs the worst on average. This is an expected outcome, given that Singapore is a left-hand traffic city, unlike the other ones.
受数据收集和标注过程影响,例如标注噪声可能仍存在于不同数据集中。为控制这种潜在的残留差异,我们探索了AutoBot在单数据集内城市变更时的泛化能力。与先前实验类似,我们在每个城市训练AutoBot并在其他城市进行评估。由于nuPlan[8]数据在多个城市拥有大量样本,我们选用该数据集并从中选取每个城市1万组样本。结果如表3所示:当评估城市变更时,AutoBot性能出现下降。例如首行显示,匹兹堡训练的模型在当地表现最佳(brier-minFDE 2.4),而在波士顿(2.7)和新加坡(3.5)表现较差。这表明城市间存在明显的泛化差距,凸显了不同环境间的差异性。此外可观察到,新加坡训练的模型平均表现最差——这符合预期,因为新加坡是唯一的左侧通行城市。
Takeaways: The findings in this section reveal that state-of-the-art models trained on recent large-scale datasets struggle to generalize to new domains. As a concrete recommendation, it highlights the importance of geographical diversity in the data collection process for both training and evaluation.
要点:本节的研究结果表明,基于最新大规模数据集训练的最先进模型难以泛化到新领域。具体建议强调了数据收集中地理多样性对训练和评估的重要性。
Table 3: Cross-city genera liz ation experiment. We train and validate AutoBot across multiple cities in the nuPlan dataset and report the brier-minFDE (↓) metric.
表 3: 跨城市泛化实验。我们在 nuPlan 数据集的多个城市上训练和验证 AutoBot,并报告 brier-minFDE (↓) 指标。
| 评估城市 | ||||
|---|---|---|---|---|
| Pittsburgh | Boston | Singapore | Average | |
| 训练城市 | ||||
| Pittsburgh | 2.4 | 2.7 | 3.5 | 2.8 |
| Boston | 4.1 | 2.2 | 3.4 | 3.2 |
| Singapore | 4.9 | 3.5 | 2.1 | 3.5 |
4.2 Scaling data to 2M trajectories.
4.2 将数据扩展至200万条轨迹
The unified data available in UniTraj forms the largest public data one can use to train a trajectory prediction model. In this section, we explore if we can improve the models’ performance by simply scaling the size of the training dataset. Therefore, we combine all the existing real datasets in UniTraj into a single large training set on which we train the considered models. The results of this experiment are presented at the bottom of Table 2 (row ‘All’), demonstrating improvements over the model trained solely on a single dataset. While the improvements are not identical for different datasets, they are particularly significant in the case of the nuScenes dataset, making the MTR model trained on combined data rank $1^{\mathrm{st}}$ in the nuScenes leader board (shown in Table 4). For instance, training the MTR model on "All" datasets enables it to outperform the model trained on nuScenes and Argoverse2 by a large margin. Moreover, while the performance on WOMD has not been improved, the resulting model performs much better than the model trained on WOMD on other datasets. These improvements are attributed to the relatively larger size and diversity of the combined dataset compared to each individual one. We elaborate on this more in Section 4.3.
UniTraj中提供的统一数据构成了可用于训练轨迹预测模型的最大规模公开数据集。本节我们探究是否仅通过扩大训练数据规模就能提升模型性能。为此,我们将UniTraj中所有现有真实数据集合并为单一大型训练集,并在此训练集上训练目标模型。实验结果展示在表2底部("All"行),显示相比单数据集训练的模型均有所提升。虽然不同数据集的提升幅度不尽相同,但在nuScenes数据集上表现尤为显著——基于合并数据训练的MTR模型在nuScenes排行榜上位列$1^{\mathrm{st}}$(如表4所示)。例如,在"All"数据集上训练的MTR模型性能大幅超越仅用nuScenes和Argoverse2训练的模型。尽管在WOMD数据集上性能未见提升,但该模型在其他数据集上的表现显著优于仅用WOMD训练的模型。这些提升归因于合并数据集相比单个数据集具有更大的规模和多样性。我们将在4.3节进一步阐述这一现象。
The table also shows that certain models benefit more from larger data sizes compared to others. Specifically, when looking at the performance on Argoverse 2 and nuScenes datasets, which benefit from the increased dataset size, models like MTR and Wayformer show more significant improvements than AutoBot. This difference in performance enhancement is attributed to the models’ capacity. For instance, MTR has 60.1 M parameters, providing it with a higher capacity to learn from larger datasets, whereas AutoBot, with only 1.5 M parameters, may not be as able to utilize the additional data.
该表还显示,某些模型相比其他模型更能从更大的数据规模中获益。具体而言,在考察Argoverse 2和nuScenes数据集上的表现时(这些数据集受益于数据量的增加),MTR和Wayformer等模型比AutoBot展现出更显著的性能提升。这种性能增强的差异归因于模型容量:例如MTR拥有6010万参数,使其具备从更大数据集中学习的高容量,而仅有150万参数的AutoBot可能无法充分利用额外数据。
In order to illustrate the impact of data size on the performance of a trajectory predcition model, we gradually increase the number of training samples from $20%$ to $100%$ of the combined dataset. We then report the AutoBot model’s performance using the average brier-minFDE metric among all three datasets. Figure 2 shows the curve revealing a consistent reduction in the prediction error once the dataset size increases. This highlights the substantial benefits of larger datasets on the model’s performance and offers prospects for improved performances with larger data sizes.
为了说明数据规模对轨迹预测模型性能的影响,我们逐步将训练样本数量从组合数据集的 $20%$ 增加到 $100%$,并使用三个数据集的平均 brier-minFDE 指标报告 AutoBot 模型的性能。图 2 显示,随着数据集规模增大,预测误差持续降低的曲线。这凸显了更大数据集对模型性能的显著益处,并为数据规模扩大后的性能提升提供了前景。
Takeaways: The experimental results underscore the potential and need for larger, more diverse datasets in the trajectory prediction field. Such datasets will also push the boundaries of the current performances of the models.
要点:实验结果凸显了轨迹预测领域对更大规模、更多样化数据集的潜在需求和必要性。此类数据集也将推动模型当前性能的边界。
4.3 Analyzing the results
4.3 结果分析
In this section, we aim to explain the findings about generalization gaps and the data scaling impact in Sections 4.1 and 4.2. Thus, we first delve into a comparative analysis of datasets integrated within the UniTraj framework with our fine-grained evaluations. We then employ these insights to explain the findings.
在本节中,我们将解释第4.1和4.2节中关于泛化差距和数据规模影响的发现。为此,我们首先深入分析UniTraj框架中集成的数据集与我们的细粒度评估之间的对比。随后,利用这些分析结果来解释相关发现。
Table 4: nuScenes Leader board. We train AutoBot and MTR with all datasets, and evaluate on nuScenes (ranking at the time of submission among public methods)
表 4: nuScenes 排行榜。我们使用全部数据集训练 AutoBot 和 MTR,并在 nuScenes 上评估(提交时在公开方法中的排名)
| 方法 | 排名 (↓) | minADE5 |
|---|---|---|
| MTR-UniTraj | 1 | 0.96 |
| Goal-LBP [54] | 2 | 1.02 |
| CASPNet++ [44] | 3 | 1.16 |
| Socialea [12] | 4 | 1.18 |
| Autobot-Unitraj | 11 | 1.26 |
| Autobot | 19 | 1.37 |

Fig. 2: Relationship between dataset size and model performance. The prediction error of AutoBot as the combined dataset size increases, varying from $20%$ to $100%$ of the total data.
图 2: 数据集规模与模型性能的关系。AutoBot 的预测误差随组合数据集规模从总数据量的 $20%$ 增至 $100%$ 的变化情况。
Dataset analysis. We provide an in-depth comparison between datasets to help the understanding of the results presented in previous subsections. Moreover, the insights aid in making informed decisions about selecting the most appropriate datasets and settings for specific research or application needs.
数据集分析。我们深入比较了不同数据集,以帮助理解前文小节中呈现的结果。此外,这些洞见有助于为特定研究或应用需求选择最合适的数据集和设置做出明智决策。
Trajectory type based comparison: The analysis of trajectory types in the WOMD, Argoverse 2, and nuScenes datasets in Figure 3a reveals trajectory type imbalances, primarily featuring a prevalence of straight trajectories, constituting $54%$ to $68%$ of all trajectories, with minimal instances of u-turns. WOMD exhibits a notably diverse trajectory mix, with a significant number of left and right turn trajectories, approximately two times more than what is observed in Argoverse 2 and nuScenes. This stands in contrast to Argoverse 2 and nuScenes, which primarily contain straight trajectories over varied turning maneuvers.
基于轨迹类型的比较:图 3a 对 WOMD、Argoverse 2 和 nuScenes 数据集中轨迹类型的分析显示,轨迹类型存在不平衡现象,主要表现为直线轨迹占主导地位,占所有轨迹的 $54%$ 到 $68%$,而 U 型转弯的实例极少。WOMD 展现出明显多样化的轨迹组合,其中左转和右转轨迹的数量显著多于 Argoverse 2 和 nuScenes,大约是后两者的两倍。这与 Argoverse 2 和 nuScenes 形成鲜明对比,后两者主要包含直线轨迹,而非多样的转弯动作。
Kalman difficulty based comparison: The distribution of sample difficulties within the WOMD, Argoverse 2, and nuScenes datasets, shown in Figure 3b, exhibits a consistent trend where easier scenarios significantly outnumber more challenging ones. WOMD demonstrates a relatively balanced distribution across lower to moderate difficulty levels, with around ${\sim}24%$ of trajectories falling within the easiest category (Kalman difficulties up to 10), with a consistent presence observed up to a Kalman difficulty of 50.0. In contrast, both nuScenes and Argoverse 2 exhibit a substantial bias towards easier difficulties, comprising approximately ${\sim}42%$ and ${\sim}46%$ of samples, respectively, in the lowest difficulty range (Kalman difficulties lower than 10), and show a sharp decrease in proportion with increasing difficulty levels, indicating datasets primarily composed of simpler scenarios which may potentially limit their efficacy in training models for more complex situations.
基于卡尔曼难度的对比:WOMD、Argoverse 2和nuScenes数据集中样本难度分布情况如图3b所示,呈现出简单场景显著多于复杂场景的一致趋势。WOMD在低至中等难度区间分布相对均衡,约${\sim}24%$的轨迹属于最简单类别(卡尔曼难度≤10),且在难度值50.0之前保持稳定分布。相比之下,nuScenes和Argoverse 2均呈现明显偏向简单样本的分布特征:最低难度区间(卡尔曼难度<10)样本占比分别达${\sim}42%$和${\sim}46%$,且随难度上升比例急剧下降,表明这两个数据集主要由简单场景构成,可能限制模型在复杂场景下的训练效果。
Explaining the findings in cross-dataset generalization and multi-dataset training experiments: Our cross-dataset generalization experiment in Section 4.1 shows that models do not generalize equally across different datasets.
解释跨数据集泛化和多数据集训练实验的发现:我们在4.1节的跨数据集泛化实验表明,模型在不同数据集上的泛化能力并不均衡。

(a) Distribution of trajectory types across datasets.
图 1:
(a) 各数据集中轨迹类型的分布。

(b) Histogram of the Kalman Difficulty of trajectories. Fig. 3: Figure (a) shows the distribution of trajectory types. It reveals an imbalance across different types with straight being the most common trajectory type in the datasets. Figure (b) shows the histogram of the Kalman Difficulty of trajectories. To give a sense of the Kalman difficulty, we overlay three random examples. The past trajectory, the ground truth, and the Kalman filter prediction are shown in red, blue, and magenta, respectively. The plot displays a clear trend with a notably higher count of simpler scenarios compared to challenging ones. WOMD, in particular, shows a relatively balanced distribution across scenarios.
图 3: (a) 展示了轨迹类型的分布情况。数据显示不同类型之间存在不平衡,直线型轨迹在数据集中最为常见。(b) 显示了轨迹卡尔曼难度(Kalman Difficulty)的直方图。为直观展示难度差异,我们叠加了三个随机示例:红色表示历史轨迹,蓝色表示真实轨迹,品红色表示卡尔曼滤波预测结果。图表显示简单场景数量明显多于复杂场景,其中WOMD数据集呈现出相对均衡的难度分布。
Table 5: Stratified evaluations per trajectory type. We report brier-minFDE on nuScenes validation data. We compare the performance of two MTR [48] models trained on nuScenes data (nuScenes) and the combined dataset in UniTraj (All).
表 5: 按轨迹类型分层评估结果。我们在nuScenes验证数据上报告brier-minFDE指标,对比了基于nuScenes数据训练的MTR [48]模型(nuScenes)与UniTraj联合数据集训练模型(All)的性能。
| Traj.Type | Stationary | Straight | Straight right | Straight left | Right u-turn | Right-turn | Left u-turn | Left-turn | All |
|---|---|---|---|---|---|---|---|---|---|
| MTR(nuScenes) | 2.15 | 2.58 | 4.85 | 4.26 | 8.13 | 4.82 | 5.17 | 4.85 | 2.86 |
| MTR (All) | 2.23 | 2.31 | 3.13 | 3.06 | 2.98 | 3.53 | 2.10 | 2.82 | 2.27 |
Notably, models trained on WOMD generalize better to other datasets. Furthermore, models trained on combined datasets exhibit considerable improvements. To understand these phenomena, it’s important to delve into the differences between datasets, focusing on two main aspects: size and diversity.
值得注意的是,在WOMD上训练的模型对其他数据集展现出更好的泛化能力。此外,在组合数据集上训练的模型表现出显著提升。为理解这些现象,需要深入探究数据集间的差异,重点关注规模和多样性两个主要方面。
To investigate the impact of dataset size, we replicate the cross-dataset generalization experiments (Table 2), but with control on the dataset size, as we select 30k random samples for each dataset’s training set. Table 6 shows the results. The last column shows the generalization hierarchy where again the WOMD generalizes best, followed by Argoverse 2 and then nuScenes. This shows that better cross-dataset generalization is not solely attributed to the size of the datasets. The last row illustrates that for multi-dataset training, there is a considerable improvement for all the datasets, highlighting the pronounced benefit of adding more data in small-scale dataset scenarios.
为探究数据集规模的影响,我们在控制数据集规模的情况下复现了跨数据集泛化实验(表2),即从每个数据集的训练集中随机选取3万样本。表6展示了实验结果。末列显示的泛化层级再次表明WOMD表现最优,其次是Argoverse 2,最后是nuScenes。这说明更好的跨数据集泛化性能并非仅由数据集规模决定。末行数据显示,多数据集训练能使所有数据集获得显著提升,突显了小规模数据集场景中增加数据量的显著优势。
Table 6: Cross-dataset generalization experiments with identical sample size. We select 30K random samples from every dataset, then train and validate AutoBot across them and report the brierminFDE metric.
表 6: 相同样本量下的跨数据集泛化实验。我们从每个数据集中随机选取30K样本,训练并验证AutoBot模型,报告brierminFDE指标。
| 训练数据集 | ←评估数据集→ | 平均 |
|---|---|---|
| nuScenes | Argoverse 2 WOMD | |
| nuScenes | 3.38 | 4.48 |
| Argoverse 2 WOMD | 4.67 | 2.90 |
| 4.42 | 4.04 | |
| All | 3.25 | 2.80 |
Table 7: Fine-grained evaluation Kalman difficulty. We report the brierminFDE ( ) metric across three chunks of Kalman difficulties on nuScenes validation data. We compare the performance of two MTR [48] models trained on nuScenes data (nuScenes) and the combined dataset in UniTraj (All).
表 7: 细粒度评估卡尔曼难度。我们在 nuScenes 验证数据上报告了三个卡尔曼难度区间的 brierminFDE ( ) 指标,对比了仅在 nuScenes 数据 (nuScenes) 和 UniTraj 组合数据集 (All) 上训练的两个 MTR [48] 模型性能。
| 卡尔曼难度 | 简单 中等 [0,30[ ∈ [30,50[ ∈ [50,100[ | 困难 |
|---|---|---|
| MTR (nuScenes) | 2.73 | 4.52 |
| MTR (All) | 2.23 | 2.97 4.20 |
Section 4.3 reveals that the datasets are dissimilar in terms of diversity. Notably, WOMD encompasses the most diverse range of scenarios in comparison to other datasets. This explains the superior generalization of WOMD to other datasets, as the diversity enables models to learn the full spectrum of data distributions more comprehensively. Similarly, the combined dataset provides a more diverse collection of trajectories, leading to enhanced performance for the models. To demonstrate this, we compare the fine-grained evaluations of MTR model trained on nuScenes and the combined dataset. Table 5 shows the per trajectory type performance of the two models where the model trained on full data outperforms in every trajectory type since the full data includes significantly more samples from each trajectory type. We also compare the performances using the Kalman difficulty measure in Table 7. The combined data has considerably more medium-difficulty samples (shown in Figure 3b) leading to significant performance improvements in the medium-range samples. These results highlight the importance of diversity in the data.
第4.3节揭示了数据集在多样性方面的差异。值得注意的是,与其他数据集相比,WOMD涵盖了最多样化的场景。这解释了WOMD对其他数据集具有更优泛化能力的原因,因为多样性使模型能够更全面地学习数据分布的全貌。同样,组合数据集提供了更多样化的轨迹集合,从而提升了模型性能。为证明这一点,我们比较了在nuScenes和组合数据集上训练的MTR模型的细粒度评估结果。表5展示了两种模型按轨迹类型的性能表现,由于完整数据包含更多来自每种轨迹类型的样本,基于完整数据训练的模型在所有轨迹类型上都表现更优。我们还通过表7中的卡尔曼难度指标进行比较。组合数据拥有更多中等难度样本(如图3b所示),这使得模型在中等难度样本上的性能显著提升。这些结果凸显了数据多样性的重要性。
5 Conclusions
5 结论
In conclusion, our study examines two critical research questions essential for advancing the field of vehicle trajectory prediction. We have uncovered that models face significant challenges in generalizing across different domains (RQ1), exhibiting considerable performance drops when encountering new datasets or cities. Additionally, our findings affirm that larger, more diverse datasets significantly boost model performance and generalization capabilities (RQ2), underscoring the importance of data richness. Besides, we release the UniTraj framework as a versatile tool that opens up new opportunities for exploration in trajectory predictions. We believe that this framework will help significantly in advancing research in the field of trajectory prediction.
总之,我们的研究探讨了推动车辆轨迹预测领域发展的两个关键研究问题。我们发现模型在不同领域间的泛化能力面临重大挑战(RQ1),当遇到新数据集或城市时性能会显著下降。此外,研究结果证实更大规模、更多样化的数据集能显著提升模型性能和泛化能力(RQ2),这凸显了数据丰富性的重要性。同时,我们发布了UniTraj框架作为多功能工具,为轨迹预测研究开辟了新探索方向。我们相信该框架将极大助力轨迹预测领域的科研进展。