Detecting Multi-Oriented Text with Corner-based Region Proposals
基于角点的区域提议检测多方向文本
Abstract
摘要
Previous approaches for scene text detection usually rely on manually defined sliding windows. This work presents an intuitive two-stage region-based method to detect multi-oriented text without any prior knowledge regarding the textual shape. In the first stage, we estimate the possible locations of text instances by detecting and linking corners instead of shifting a set of default anchors. The quadrilateral proposals are geometry adaptive, which allows our method to cope with various text aspect ratios and orientations. In the second stage, we design a new pooling layer named Dual-RoI Pooling which embeds data augmentation inside the region-wise subnetwork for more robust classification and regression over these proposals. Experimental results on public benchmarks confirm that the proposed method is capable of achieving comparable performance with state-of-the-art methods. The code is publicly available at https://github.com/xhzdeng/crpn.
以往的场景文本检测方法通常依赖于手动定义的滑动窗口。本研究提出了一种直观的两阶段基于区域的方法,无需任何关于文本形状的先验知识即可检测多方向文本。在第一阶段,我们通过检测并连接角点而非滑动一组预设锚框来估计文本实例的可能位置。四边形候选框具有几何自适应性,使本方法能够应对各种文本长宽比和方向。在第二阶段,我们设计了一种名为双RoI池化 (Dual-RoI Pooling) 的新型池化层,该层将数据增强嵌入区域子网络中,从而对这些候选框进行更鲁棒的分类和回归。公开基准测试的实验结果证实,所提方法能够达到与最先进方法相当的性能。代码公开于 https://github.com/xhzdeng/crpn。
Keywords: Multi-Oriented Text Detection, Dual-RoI Pooling, Corner-based Region Proposal Network
关键词:多方向文本检测、双RoI池化、基于角点的区域提议网络
1. Introduction
1. 引言
Automatically reading text in the wild is a fundamental problem of computer vision since text in scene images commonly conveys valuable information. It has been widely used in various applications such as multilingual translation, automotive assistance and image retrieval. Normally, a reading system consists of two sub-tasks: detection and recognition. This work focuses on text detection, which is the essential prerequisite of the subsequent processes in the whole workflow.
自动识别自然场景中的文本是计算机视觉的基础问题,因为场景图像中的文字通常承载着重要信息。该技术已广泛应用于多语言翻译、驾驶辅助和图像检索等诸多领域。通常,一个完整的文本阅读系统包含两个子任务:检测与识别。本文专注于文本检测研究,这是整个工作流程中后续处理步骤的重要前提。
Though extensively studied [1, 2, 3, 4] in recent years, scene text detection is still enormously challenging due to the diversity of text instances and undesirable image quality. Before the era of deep learning [5], most related works utilized the sliding window [4, 6] or connected component [1, 2, 3] with hand-crafted features. The methods based on the sliding window detect texts by shifting several windows onto all positions in multiple scales. Although these methods are able to achieve a high recall rate, the large number of candidates may result in low precision and heavy computations. The approaches based on the connected component focus on the detection of individual characters and the relationships between them. Although these methods are faster than previous ones, errors will occur and accumulate throughout each of the sequential steps [7], which may degenerate the performance of detection.
尽管近年来已有大量研究[1, 2, 3, 4],但由于文本实例的多样性和图像质量不佳,场景文本检测仍然极具挑战性。在深度学习[5]时代之前,大多数相关工作采用滑动窗口[4, 6]或基于手工特征的连通域分析[1, 2, 3]。基于滑动窗口的方法通过在不同尺度上移动多个窗口来检测文本。虽然这些方法能实现较高的召回率,但大量候选框会导致精度下降和计算量激增。基于连通域的方法专注于检测单个字符及其相互关系。尽管这类方法速度更快,但误差会在各个处理步骤中累积[7],从而降低检测性能。
Recently, benefited from the significant achievements of generic object detection based on deep neural network [8], methods with high performance [9, 10, 11] have been modified to detect horizontal scene text [12, 13, 14] and the results have amply demonstrated their effectiveness. In addition, in order to achieve multi-oriented text detection, some methods [15, 16] designed several rotated anchors to find the best matched proposals to inclined text instances. Although these methods have shown their promising performances, as [16] refers, the strategy of man-made shapes of anchors may not be the optimal designs.
近年来,得益于基于深度神经网络的通用物体检测取得的显著成果 [8],一些高性能方法 [9, 10, 11] 被改进用于检测水平场景文本 [12, 13, 14],结果充分证明了其有效性。此外,为了实现多方向文本检测,部分方法 [15, 16] 设计了多个旋转锚框以寻找与倾斜文本实例最匹配的候选框。尽管这些方法展现出良好性能,但如 [16] 所述,人工设计锚框形状的策略可能并非最优方案。
In this paper, we tackle scene text detection with a new perspective which is mostly learned from the process of object annotation. As shown in Fig.1, the most common way [17, 18] to make an annotation is to click on a corner of an imaginary rectangle enclosing the object, and then drag the mouse to the diagonally opposite corner to get a rectangular box. To annotate the inclined text instance, we need another diagonal to obtain a quadrilateral bounding-box. If the box is not particularly accurate, users can make further amendments by adjusting the coordinates of the corners. Following the above procedure, our motivation is to harness the corners to infer the locations of text bounding-boxes. Basically, the proposed method is a two-stage region-based [19] detection framework. In region proposal stage, we abandon the anchor fashion and utilize corners to generate quadrilateral proposals for estimating the possible locations of text instances. In region classification stage, a region-wise network is trained for text/non-text classification and corner regression over these proposals. Based on corners, the quadrilateral outputs are flexible to capture various text aspect ratios and orientations. The resulting model is trained end-to-end and obtains an F-measure 0.876 on ICDAR 2013, 0.845 on ICDAR 2015 and 0.591 on COCO-Text. Besides, compared with recent published works [20, 21], it is competitively faster in running speed.
本文从目标标注过程中获得启发,提出了一种全新的场景文本检测视角。如图1所示,常规标注方法[17,18]是通过点击物体外接矩形的某个角点,然后向对角方向拖拽鼠标生成矩形框。对于倾斜文本实例,则需要通过另一条对角线获取四边形标注框。若标注框不够精确,用户可通过调整角点坐标进行修正。受此启发,我们提出利用角点推理文本边界框位置的方法。该方案本质上是一个两阶段区域检测框架[19]:在区域提议阶段,摒弃锚框机制,转而通过角点生成四边形提议框来预测文本实例的可能位置;在区域分类阶段,训练区域分类网络对这些提议框进行文本/非文本分类及角点回归。基于角点的四边形输出能灵活适应不同长宽比和方向的文本。该端到端训练模型在ICDAR 2013、ICDAR 2015和COCO-Text数据集上分别取得0.876、0.845和0.591的F值。与近期研究成果[20,21]相比,本方法在运行速度上更具竞争力。
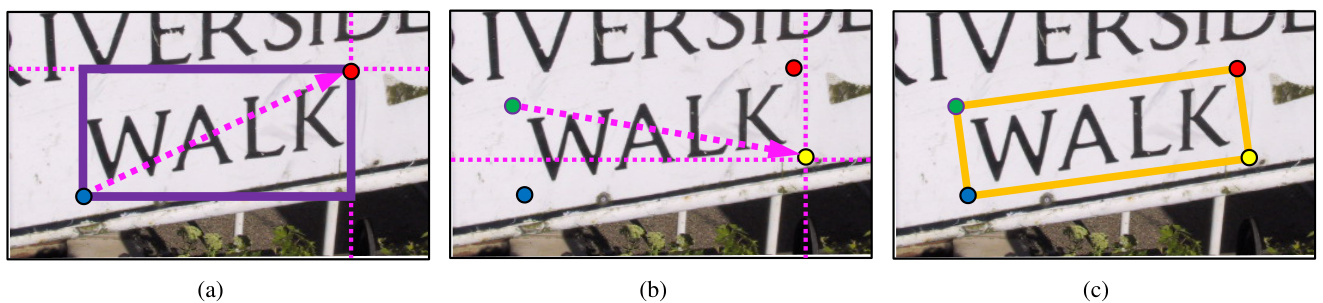
Figure 1: Annotating an instance of text: $:$ (a) The conventional way of drawing a rectangular bounding-box. Clicking on a corner (blue point) and dragging the mouse to the diagonally opposite corner (red point) to receive a rectangle (solid purple box). But the rectangular bounding-box is not very accurate for rotated text region. (b) (c) Drawing another diagonal (dashed arrow in (b)) to finish the annotation (solid orange box in (c)) for inclined text instance. Best viewed in color.
图 1: 文本实例标注: $:$ (a) 传统的矩形边界框绘制方式。点击一个角点(蓝色点)并拖动鼠标到对角点(红色点)生成矩形(紫色实线框)。但矩形边界框对旋转文本区域不够精确。(b)(c) 通过绘制另一条对角线(图b虚线箭头)完成倾斜文本实例的标注(图c橙色实线框)。建议彩色查看。
We summarize our primary contributions as follows:
我们将主要贡献总结如下:
2. Methodology
2. 方法论
In this section, we will describe the proposed method. Technically, our method is based on Faster R-CNN [9] and DeNet [22] detection frameworks. We make some innovations to combine and extend them for detecting multioriented text. Details will be delineated in the following.
在本节中,我们将描述所提出的方法。从技术上讲,我们的方法基于Faster R-CNN [9]和DeNet [22]检测框架。我们进行了一些创新,将它们结合并扩展用于检测多方向文本。具体细节将在下文中阐述。
2.1. Corner-based Region Proposal Network
2.1. 基于角点的区域提议网络
Here we introduce our new region proposal algorithm named Corner-based Region Proposal Network (CRPN). It draws primarily on DeNet [22], which is a novel generic object detection framework. We extend the Corner-based RoI Detector which can only output rectangular proposals in DeNet to generate quadrilateral ones for matching arbitraryoriented text instances. In general, two intersected diagonals can determine a quadrangle. The main purpose of CRPN is to search corners on the whole image and find the intersected diagonals which link them. It mainly consists of two steps: corner detection and proposal sampling.
在此我们介绍名为基于角点的区域提议网络(CRPN)的新算法。该算法主要借鉴了DeNet [22]这一创新通用目标检测框架。我们将DeNet中仅能输出矩形提议的基于角点的兴趣区域检测器扩展为可生成四边形提议,以匹配任意方向的文本实例。通常来说,两条相交对角线可以确定一个四边形。CRPN的主要目的是在全图像上搜索角点,并找到连接这些角点的相交对角线。它主要包含两个步骤:角点检测和提议采样。
2.1.1. Corner Detection
2.1.1. 角点检测
Similar to semantic segmentation, the task of corner detection is performed by predicting the probability of each position $(x,y)$ that belongs to one of the predefined corner types. Owing that texts are usually very close to each other in natural scenes, it is hard to separate corners which are from adjacent text instances. Thus, we use the one-versus-rest strategy and apply four-branches ConvNet to predict the independent probability denoted as $P_{i}(x,y)$ for each corner type, where i ∈ {top le f t, top right, bot right, bot le f t}. Obviously, only the top le f t and bot right or top right and bot le f t can be connected diagonally. However, most of the linkage is negative because there is only one positive partner for each corner candidate. For the purpose of suppressing the negative linkages, we define a new variable named Link Direction. Let $\theta(p,q)$ be the orientation of any diagonal $\overrightarrow{p q}$ to the horizontal, $p$ and $q$ are two corner candidates from two types which can be linked into a diagonal. Then $\theta(p,q)$ is disc ret i zed into one of $K$ values, as HOG [23] did. The Link Direction of corner $p$ to $q$ is calculated as follow:
与语义分割类似,角点检测任务通过预测每个位置$(x,y)$属于预定义角点类型的概率来完成。由于自然场景中的文本通常非常接近,很难分离来自相邻文本实例的角点。因此,我们采用一对多策略,并应用四分支卷积网络预测每个角点类型的独立概率,记为$P_{i}(x,y)$,其中i ∈ {左上, 右上, 右下, 左下}。显然,只有左上和右下或右上和左下可以沿对角线连接。然而,大多数连接是负面的,因为每个角点候选只有一个正面配对。为了抑制负面连接,我们定义了一个名为连接方向的新变量。设$\theta(p,q)$为任意对角线$\overrightarrow{p q}$与水平方向的夹角,$p$和$q$是来自两种可连接成对角线的角点候选。然后$\theta(p,q)$被离散化为$K$个值之一,如HOG [23]所做。角点$p$到$q$的连接方向计算如下:
$$
D_{\overrightarrow{p q}}=c e i l\left(\frac{K*\theta(p,q)}{2\pi}\right)
$$
$$
D_{\overrightarrow{p q}}=c e i l\left(\frac{K*\theta(p,q)}{2\pi}\right)
$$
Then we convert the binary classification problem (corner/non-corner) to a multi-class one, where each class corresponds to a value of Link Direction. To this end, each corner detector outputs a prediction map with channel dimension $K+1$ (plus one for background and other corner types). The independent probability of each position which belongs to corner type $i$ is given by:
然后将二分类问题(角点/非角点)转换为多分类问题,其中每个类别对应一个链接方向(Link Direction)值。为此,每个角点检测器输出一个通道维度为$K+1$的预测图(额外一个通道用于背景和其他角点类型)。每个位置属于角点类型$i$的独立概率由下式给出:
$$
P_{i}(x,y)=\sum_{k=1}^{K}P_{i}^{'}(k|x,y),k\in{0,1,...,K}
$$
$$
P_{i}(x,y)=\sum_{k=1}^{K}P_{i}^{'}(k|x,y),k\in{0,1,...,K}
$$
$P_{i}^{'}(k|x,y)$ is computed by a softmax over the $K+1$ output maps of corner class $i$ . As [1] applying the gradient direction $d_{p}$ of each edge pixel $p$ to find another edge pixel $q$ where the gradient direction $d_{q}$ is roughly opposite to $d_{p}$ , we filter out the linkages which:
$P_{i}^{'}(k|x,y)$ 是通过对角落类别 $i$ 的 $K+1$ 个输出映射进行 softmax 计算得到的。如 [1] 所述,通过应用每个边缘像素 $p$ 的梯度方向 $d_{p}$ 来寻找另一个梯度方向 $d_{q}$ 与 $d_{p}$ 大致相反的边缘像素 $q$,我们过滤掉以下连接:
$$
|D_{\overrightarrow{p q}}-D_{p}|>1
$$
$$
|D_{\overrightarrow{p q}}-D_{p}|>1
$$
where $D_{p}$ is the predicted Link Direction of corner p, $D_{\overrightarrow{p q}}$ is the practical Link Direction of corner $p$ to $q$ which can be easily calculated via Eq.1. As depicted in Fig.2, the Link Direction can indicate where to find the partner for each corner, and meanwhile is helpful for separating two adjacent texts.
其中 $D_{p}$ 是角点 p 的预测链接方向 (Link Direction),$D_{\overrightarrow{p q}}$ 是角点 $p$ 到 $q$ 的实际链接方向,可通过公式 1 轻松计算得出。如图 2 所示,链接方向能指示每个角点的配对位置,同时有助于分离相邻文本。
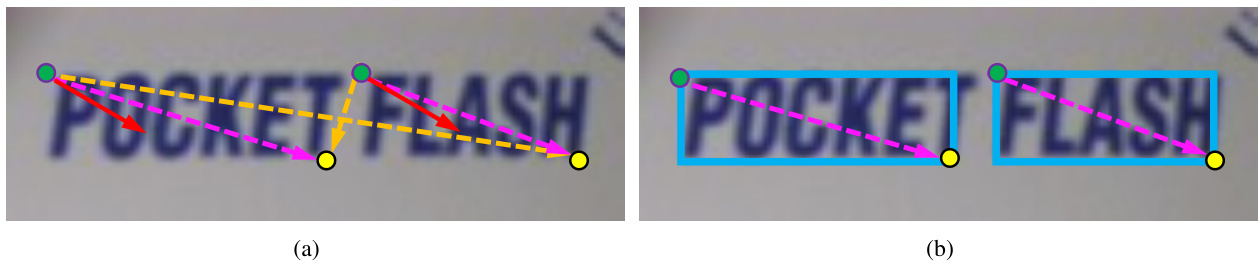
Figure 2: Suppressing the negative linkages via Link Direction: The green and yellow points are two types of detected corners which can be connected diagonally. (a) The solid (red) and dashed (orange and purple) arrows represent the practical and predicted Link Direction respectively. The dashed orange arrows will be filter out via Eq.3. (b) The output region proposals (solid blue box) are generated by dashed purple arrows. Best viewed in color.
图 2: 通过链接方向抑制负向关联:绿色和黄色点是两种可对角连接的特征角点。(a) 实线(红色)与虚线(橙色和紫色)箭头分别表示实际与预测的链接方向,其中虚线橙色箭头将通过公式3被过滤。(b) 由虚线紫色箭头生成的最终区域提案(蓝色实线框)。建议彩色查看。
2.1.2. Proposal Sampling
2.1.2. 提案采样
We develop a simple algorithm for searching corner candidates from probability maps and assembling them into quadrilateral proposals. Specially, in order to improve the recall rate, we only use three different types of corners to generate a proposal. The working steps of algorithm are described as follows:
我们开发了一种简单算法,用于从概率图中搜索角点候选并将其组装为四边形提案。具体而言,为提高召回率,我们仅使用三种不同类型的角点生成提案。该算法的工作步骤如下:
Algorithm 1 Generating Proposals by Searching and Linking Corners
算法 1: 通过搜索和连接角点生成提案
With the probability of corner, we can easily estimate the score that a proposal $B$ contains a text instance by applying a Naive Bayesian Classifier to each corner of $B$ :
通过角落概率,我们可以轻松估计提案$B$包含文本实例的分数,方法是对$B$的每个角落应用朴素贝叶斯分类器:
$$
P(B)=\prod_{i}P_{i}(x_{i},y_{i})
$$
$$
P(B)=\prod_{i}P_{i}(x_{i},y_{i})
$$
where $(x_{i},y_{i})$ indicates the coordinates of the corner type $i$ associate with proposal $B$ . We also adopt non-maximum suppression (NMS) on proposals based on their score to reduce redundancy because most of the proposals highly overlap with each other. Considering the computational accuracy of the standard NMS based on the IoU of rectangles is unsatisfactory for quadrilateral proposals, we use the algorithm introduced by [15], which can compute the IoU of quadrangles, to solve this problem. Then the vast majority of proposals will be discarded after this operation.
其中 $(x_{i},y_{i})$ 表示与候选框 $B$ 相关联的角点类型 $i$ 的坐标。我们还会基于候选框的分数采用非极大值抑制 (NMS) 来减少冗余,因为大多数候选框彼此高度重叠。考虑到基于矩形交并比 (IoU) 的标准 NMS 计算精度对于四边形候选框不够理想,我们采用 [15] 提出的可计算四边形交并比的算法来解决这一问题。经过此操作后,绝大多数候选框将被丢弃。
2.2. Dual-RoI Pooling
2.2. 双区域兴趣池化 (Dual-RoI Pooling)
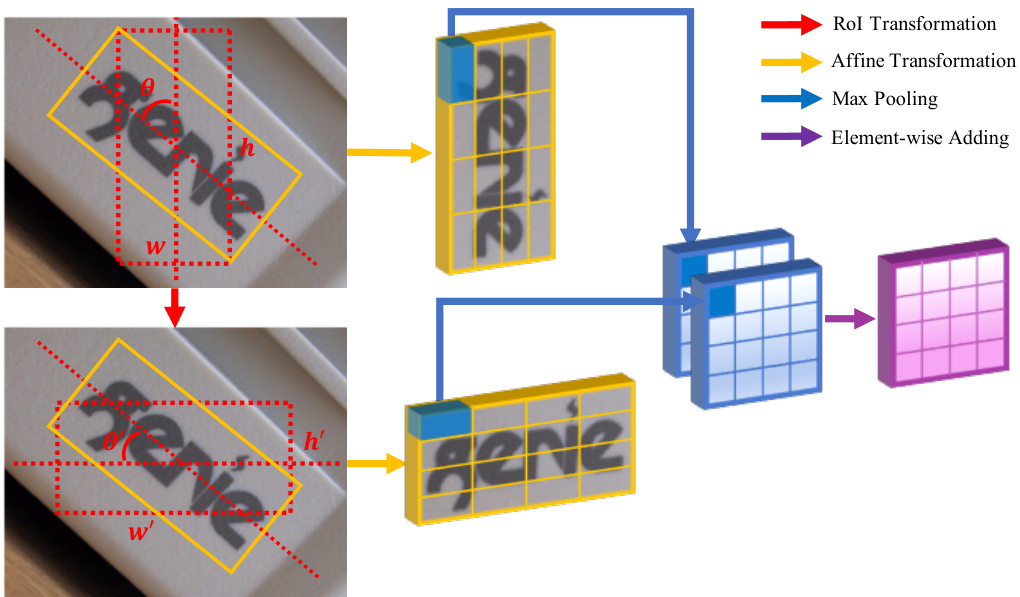
Figure 3: Dual-RoI Pooling: Actually, the Dual-RoI Pooling is performed on the feature map. We draw it on source image for better viewing. Different colored arrows represent different operations. Best viewed in color.
图 3: Dual-RoI Pooling: 实际上,Dual-RoI Pooling是在特征图上进行的。为了更直观展示,我们在原图上绘制了该过程。不同颜色的箭头代表不同操作。建议彩色查看。
As presented in [24], the RoI pooling layer extracts a fixed-length feature vector from the feature map for each region of interest (RoI), and then each vector is fed into a sequence of fully connected layers for further classification and bounding-box regression. In our task, the traditional RoI pooling which can only handle axis-aligned RoIs is also not accurate for quadrilateral ones. Thus, the Rotation RoI (RRoI) pooling presented by [15] is adopted to address this issue. Each RRoI is represented by a five-tuple $(r,c,h,w,\theta)$ where $r,c$ are coordinates of bounding-box center, $h,w$ are height and width of bounding-box, and $\theta$ is the rotation angle to the horizontal. This operation works by mapping the rotated RoI into an axis-aligned one via affine transformation, and then dividing the $h\times w$ window into an $H\times W$ grid of sub-windows and max-pooling the values in each sub-window into the corresponding output grid cell, as shown in Fig.3. Since the input format of RRoI pooling is rotated rectangle, we convert the quadrilateral proposals into rotated rectangular ones through method min Area Rect in OpenCV and $\theta$ is within the interval $[0^{\circ},90^{\circ})$ .
如[24]所述,RoI (Region of Interest)池化层从特征图中为每个感兴趣区域提取固定长度的特征向量,随后每个向量被送入一系列全连接层以进行进一步分类和边界框回归。在我们的任务中,传统的RoI池化仅能处理轴对齐的RoI,对于四边形区域并不准确。因此,我们采用[15]提出的旋转RoI (RRoI)池化来解决这一问题。每个RRoI由一个五元组$(r,c,h,w,\theta)$表示,其中$r,c$为边界框中心坐标,$h,w$为边界框高度和宽度,$\theta$为与水平方向的旋转角度。该操作通过仿射变换将旋转的RoI映射为轴对齐区域,随后将$h\times w$窗口划分为$H\times W$个子窗口网格,并对每个子窗口内的值进行最大池化,结果填入对应的输出网格单元,如图3所示。由于RRoI池化的输入格式为旋转矩形,我们通过OpenCV中的minAreaRect方法将四边形提案转换为旋转矩形,且$\theta$的取值范围为$[0^{\circ},90^{\circ})$。
Usually, for improving the robustness of the model when encountering various orientations of texts, existing methods [20, 25, 26] make use of data augmentation that rotates source images to different angles to harvest sufficient data for training. Despite the effectiveness of data augmentation, the main drawback lies in learning all the possible transformations of augmented data require more network parameters, and it also may result in significant increase of training cost and over-fitting risk [27]. With the aim to alleviate these drawbacks, we present a built-in data augmentation named Dual-RoI Pooling. For each RRoI $o$ which represented by $(r,c,h,w,\theta)$ , we transform it into another RRoI $o^{\prime}$ represented by $(r^{'},c^{'},\bar{h}^{'},w^{'},\theta^{'})$ where:
通常,为了提高模型在面对不同方向文本时的鲁棒性,现有方法[20,25,26]会利用数据增强技术,将源图像旋转至不同角度以获取充足的训练数据。尽管数据增强行之有效,但其主要缺陷在于:学习所有可能的增强数据变换需要更多网络参数,同时可能导致训练成本显著增加和过拟合风险上升[27]。为了缓解这些问题,我们提出了一种内置数据增强方法——Dual-RoI Pooling。对于每个由$(r,c,h,w,\theta)$表示的RRoI $o$,我们将其转换为另一个由$(r^{'},c^{'},\bar{h}^{'},w^{'},\theta^{'})$表示的RRoI $o^{\prime}$,其中:
$$
\begin{array}{r}{\boldsymbol{r^{\prime}}=\boldsymbol{r},\quad\boldsymbol{c^{\prime}}=\boldsymbol{c},\quad\boldsymbol{h^{\prime}}=\boldsymbol{w},\quad\boldsymbol{w^{\prime}}=\boldsymbol{h},\quad\boldsymbol{\theta^{\prime}}=90^{\circ}-\boldsymbol{\theta}}\end{array}
$$
$$
\begin{array}{r}{\boldsymbol{r^{\prime}}=\boldsymbol{r},\quad\boldsymbol{c^{\prime}}=\boldsymbol{c},\quad\boldsymbol{h^{\prime}}=\boldsymbol{w},\quad\boldsymbol{w^{\prime}}=\boldsymbol{h},\quad\boldsymbol{\theta^{\prime}}=90^{\circ}-\boldsymbol{\theta}}\end{array}
$$
As described in Fig.3, inputting the RoI $O^{'}$ to RRoI pooling layer will obtain a totally different grid of sub-windows. We combine these two RoIs as a Dual-RoI and fuse their feature vectors to get the final output via element-wise adding operation. The essence of Dual-RoI pooling embeds multi-instance learning [28] inside the region-wise subnetwork and that will be helpful for finding the most representative features for training, similar to TI-POOLING [29]. As a result of directly conducting the transformation on feature map instead of on the source image, our module is more efficient than [29]. Considering the diversity of text arrangement, we argue that the element-wise adding is more appropriate than element-wise maximum in our task.
如图 3 所示,将感兴趣区域 (RoI) $O^{'}$ 输入到 RRoI 池化层会得到完全不同的子窗口网格。我们将这两个 RoI 组合为 Dual-RoI (双感兴趣区域),并通过逐元素相加操作融合它们的特征向量来获得最终输出。Dual-RoI 池化的本质是在区域级子网络中嵌入多实例学习 [28],这有助于找到最具代表性的特征进行训练,类似于 TI-POOLING [29]。由于直接在特征图上进行变换而非源图像上操作,我们的模块比 [29] 更高效。考虑到文本排列的多样性,我们认为在本任务中逐元素相加比逐元素取最大值更合适。
2.3. Network Architecture
2.3. 网络架构
The network architecture of the proposed method is diagrammed in Fig.4. All of our experiments are implemented on VGG-16 [30], though other networks are also applicable. To obtain more accurate corners prediction, we choose the output of $C o n\nu4$ as the final feature map, whose size is 1/8 of the input image. Which has been proven in many works [31, 32], combining the fine-grained details from low level layers with coarse semantic information from high level layers will be helpful for the detector. Our structure of feature fusion mainly inherits from PVANet [32] but is slightly different to it. We add a de convolutional layer to carry out upsampling, and a $3\times3\times64$ convolutional layer with stride $=2$ to conduct sub sampling. The concatenated features are combined by a $1\times1\times512$ convolutional layer.
所提方法的网络架构如图4所示。所有实验均在VGG-16[30]上实现,但其他网络同样适用。为获得更精确的角点预测,我们选择$Conv4$层的输出作为最终特征图,其尺寸为输入图像的1/8。多项研究[31,32]表明,将低层细粒度细节与高层粗粒度语义信息结合有助于检测器性能。我们的特征融合结构主要继承自PVANet[32],但略有不同:新增反卷积层进行上采样,采用步长$=2$的$3\times3\times64$卷积层进行下采样,最终通过$1\times1\times512$卷积层融合拼接特征。
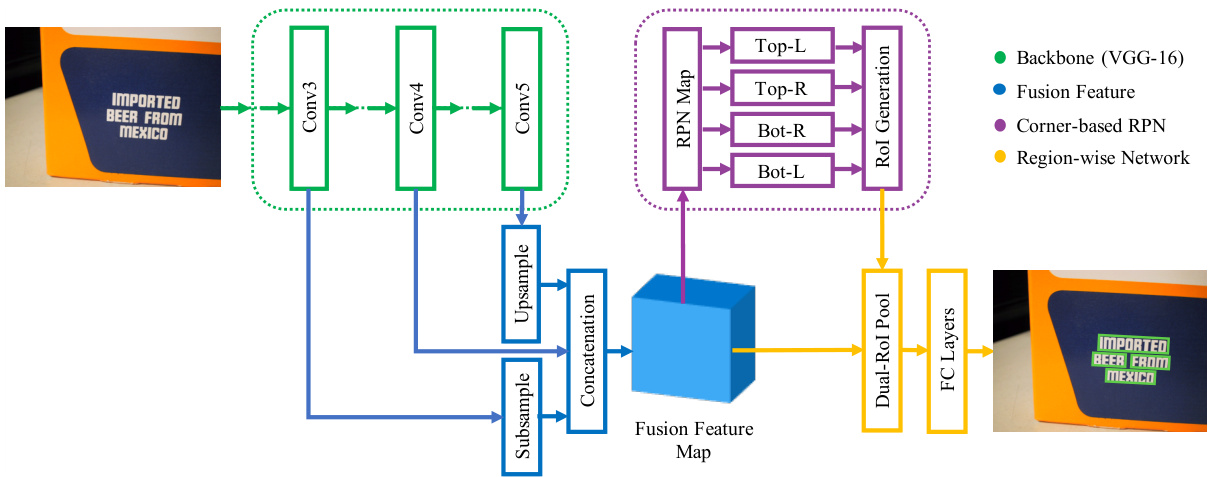
Figure 4: The architecture of the proposed detection network. Best viewed in color.
图 4: 提出的检测网络架构。建议彩色查看。
2.4. Loss Function
2.4. 损失函数
Based on the above definitions, we give the multi-task loss $L$ of proposed network. The model is trained to simultaneously minimize the losses on corner segmentation, proposal classification and corner regression. Overall, the loss function is a weighted sum of these losses:
基于上述定义,我们给出所提出网络的多任务损失 $L$。该模型通过同时最小化角点分割、候选框分类和角点回归的损失进行训练。总体而言,损失函数是这些损失的加权和:
$$
L=\lambda_{s e g}L_{s e g}+\lambda_{c l s}L_{c l s}+\lambda_{l o c}L_{l o c}
$$
$$
L=\lambda_{s e g}L_{s e g}+\lambda_{c l s}L_{c l s}+\lambda_{l o c}L_{l o c}
$$
where $\lambda_{s e g},\lambda_{c l s},\lambda_{l o c}$ are user defined constants indicating the relative strength of each component. In our experiment, all weight constants $\lambda$ are set to 1.
其中 $\lambda_{seg}$、$\lambda_{cls}$、$\lambda_{loc}$ 是用户定义的常量,表示各分量的相对权重。在我们的实验中,所有权重常量 $\lambda$ 均设为1。
2.4.1. Loss for Segmentation
2.4.1. 分割损失函数
In training stage, the loss function for segmentation task is computed over all pixels in the output map with the ground-truth which is identified by mapping the corners to a single position in the label map, corners out of boundary are simply discarded. For a typical natural image, the distribution of corner/non-corner pixels is heavily biased. It is possible to optimize for the loss functions of all pixels, but this will bias towards negative samples as they are dominant. Instead, we randomly sample 32 pixels as a mini-batch which the samples positive and negative pixels have a ratio of up to 1:1. If the number of positive pixels is not enough, we pad the mini-batch with negative ones. Furthermore, we adopt a weighted softmax loss function introduced in [33] to balance the loss between the corner/non-corner classes, given by:
在训练阶段,分割任务的损失函数通过输出图中所有像素与真实标签(通过将角点映射到标签图中的单一位置确定)计算得出,超出边界的角点会被直接丢弃。对于典型的自然图像,角点与非角点像素的分布存在严重偏差。虽然可以对所有像素的损失函数进行优化,但这会导致负样本(占主导地位)的偏差。为此,我们随机采样32个像素作为一个小批量,其中正负样本比例最高为1:1。若正样本数量不足,则用负样本填充小批量。此外,我们采用[33]提出的加权softmax损失函数来平衡角点与非角点类别间的损失,其表达式为:
$$
L_{s e g}=\sum_{i}-\frac{1}{|S_{i}|}\sum_{m=1}^{|S_{i}|}\sum_{k=0}^{K}\omega_{i}^{k}I(z_{i}^{m}=k)l o g P_{i}^{'}(k|s_{i}^{m})
$$
$$
L_{s e g}=\sum_{i}-\frac{1}{|S_{i}|}\sum_{m=1}^{|S_{i}|}\sum_{k=0}^{K}\omega_{i}^{k}I(z_{i}^{m}=k)l o g P_{i}^{'}(k|s_{i}^{m})
$$
2.4.2. Loss for Region-wise Network
2.4.2. 区域网络损失函数
As in [24], the region-wise network has two sibling outputs: one for proposal classification and another for corner regression. The first objective aims for distinguish texts from non-texts with softmax loss, as follows:
如[24]所述,区域级网络有两个并行输出分支:一个用于候选区域分类,另一个用于角点回归。第一个目标通过softmax损失函数区分文本与非文本区域,公式如下:
$$
L_{c l s}=y l o g(p)+(1-y)l o g(1-p)
$$
$$
L_{c l s}=y l o g(p)+(1-y)l o g(1-p)
$$
where $y$ equals 1 if input sample is text, otherwise is 0. The $p$ is text confidence score. The second objective attempts to regress the fine bounding-box, as follows:
其中,若输入样本为文本,则 $y$ 等于1,否则为0。$p$ 为文本置信度分数。第二个目标旨在回归精细边界框,如下所示:
$$
L_{l o c}=s m o o t h_{L_{1}}(t-t^{*})
$$
$$
L_{l o c}=s m o o t h_{L_{1}}(t-t^{*})
$$
$t$ and $t^{}$ represents the predicted and target regression tuples respectively, and $s m o o t h_{L_{1}}$ is a robust $L_{1}$ loss defined in R-CNN [5]. The regression target $t^{*}$ consists of eight terms:
$t$ 和 $t^{}$ 分别表示预测和目标回归元组,$smooth_{L_{1}}$ 是 R-CNN [5] 中定义的鲁棒 $L_{1}$ 损失。回归目标 $t^{*}$ 包含八个项:
$$
t_{x_{i}}^{}=(x_{i}-x_{i}^{})/w,\quad t_{y_{i}}^{}=(y_{i}-y_{i}^{*})/h
$$
$$
t_{x_{i}}^{}=(x_{i}-x_{i}^{})/w,\quad t_{y_{i}}^{}=(y_{i}-y_{i}^{*})/h
$$
$(x_{i},y_{i})$ and $(x_{i}^{},y_{i}^{*})$ denote the coordinates of the corner type $i$ for proposal and target bounding-box respectively. $w$ and $h$ are the width and height of minimal bounding rectangle of input proposal. The target bounding-box for each proposal is identified by selecting the ground-truth with the largest overlap.
$(x_{i},y_{i})$ 和 $(x_{i}^{},y_{i}^{*})$ 分别表示提案和目标边界框的角点类型 $i$ 的坐标。$w$ 和 $h$ 是输入提案的最小边界矩形的宽度和高度。每个提案的目标边界框通过选择重叠面积最大的真实标注框来确定。
3. Experiments
3. 实验
In the following part, we will describe the implementation details of our method. We also run a number of ablations to analyze the effectiveness of the proposed component. Finally, we will present the evaluation results on three public benchmarks: ICDAR 2013 [34], ICDAR 2015 [35] and COCO-Text [36].
在以下部分,我们将描述方法的实现细节。我们还进行了多项消融实验以分析所提出组件的有效性。最后,我们将在三个公开基准测试上展示评估结果:ICDAR 2013 [34]、ICDAR 2015 [35] 和 COCO-Text [36]。
3.1. Implementation Details
3.1. 实现细节
The backbone of network is initialized by pre training a model for ImageNet [37] classification, and all other new layers are initialized by ”Xavier” [38]. The training images are collected from SynthText [13], ICDAR 2013 and ICDAR 2015. We randomly pick up 100,000 images from SynthText for pre training, and then the real data from the training sets of ICDAR 2013 and 2015 is used to finetune a unified model. The model is trained end-to-end by using the standard SGD algorithm. Momentum and weight decay are set to 0.9 and $5\times10^{-4}$ respectively. Following the multi-scale training in [32], we resize the images in each training iteration such that the short side of input is randomly chose between 480 and 800. In pre training stage, the learning rate is set to $10^{-3}$ for the first $60\mathrm{k\Omega}$ iterations, and then decayed to $10^{-4}$ for the other 40k iterations. In finetuning stage, the learning rate is fixed to $10^{-4}$ for $20\mathrm{k\Omega}$ iterations throughout. No extra data augmentation is used.
网络主干通过预训练ImageNet [37]分类模型进行初始化,其余新层均采用"Xavier" [38]方法初始化。训练图像来自SynthText [13]、ICDAR 2013和ICDAR 2015数据集:先从SynthText随机选取10万张图像进行预训练,再使用ICDAR 2013和2015训练集的真实数据微调统一模型。模型采用标准SGD算法端到端训练,动量参数和权重衰减分别设为0.9和$5\times10^{-4}$。参照[32]的多尺度训练策略,每个训练迭代中会将输入图像的短边随机缩放至480到800像素之间。预训练阶段前$60\mathrm{k\Omega}$次迭代学习率为$10^{-3}$,后续40k次降至$10^{-4}$;微调阶段全程固定学习率为$10^{-4}$,共进行$20\mathrm{k\Omega}$次迭代。未使用额外数据增强手段。
For the trade-off between efficiency and accuracy, we set $K=24$ and $M=32$ in out implement. Moreover, threshold $T$ is set to 0.1 in training for high recall and 0.5 in testing for high precision. Thanks to location by corners, the proposals are very accurate and only 200 proposals are used for further detection at test-time. The proposed method is implemented using Caffe [39]. All experiments are carried out on a standard PC with Intel i7-6800k CPU and a single NVIDIA 1080Ti GPU. All of our results are reported on single-scale testing images with a single model.
在效率与准确性的权衡中,我们在实现中设置 $K=24$ 和 $M=32$。此外,训练阶段将阈值 $T$ 设为0.1以提高召回率,测试阶段设为0.5以保证高精度。得益于基于角点的定位方法,生成的候选框非常精准,测试时仅需使用200个候选框进行后续检测。该方法基于Caffe [39] 实现,所有实验均在配备Intel i7-6800k CPU和单块NVIDIA 1080Ti GPU的标准PC上完成。所有结果均采用单尺度测试图像和单一模型报告。
3.2. Ablation Study
3.2. 消融实验
To investigate the effectiveness of the proposed components, we conduct several ablation studies. We adopt Faster R-CNN [9] as our baseline model and convert the format of outputs to match the evaluation of ICDAR 2015. Results are shown in Table. 1 and discussed in detail next.
为了验证所提出组件的有效性,我们进行了多项消融实验。采用 Faster R-CNN [9] 作为基线模型,并将输出格式转换为符合 ICDAR 2015 评估标准。结果如表 1 所示,下文将详细讨论。
Table 1: Ablations on ICDAR 2015.
表 1: ICDAR 2015消融实验
| 方法 | 特征图 | 召回率 | 精确率 | F值 |
|---|---|---|---|---|
| Baseline | conv5,stride=16 | 0.606 | 0.553 | 0.579 |
| CRPN+RoI Pooling | conv5,stride=16 | 0.707 | 0.611 | 0.656 |
| CRPN + RoI Pooling | fusion, stride=8 | 0.767 | 0.781 | 0.774 |
| CRPN+ RRoI Pooling | fusion, stride=8 | 0.788 | 0.870 | 0.827 |
| CRPN + Dual-RoI Pooling | fusion,stride=8 | 0.807 | 0.887 | 0.845 |
First, using Corner-based RPN instead of conventional RPN, the F-measure improves from 0.579 to 0.656. It is worth noting that the regression task in baseline is designed for refining the rectangular bounding-box. Next, with the aim to generate more accurate proposals, we predict on conv4 with fusion structure which is introduced in section 2.3, and the resulting model obtains a huge improvement in F-measure (0.656 vs 0.774). Replacing RoI Pooling with RRoI Pooling leads to an F-measure of 0.827, which also outperforms recent Rotation RPN (0.800 F-measure shown in Table. 3). From this we can conclude the Corner-based RPN is more effective to match the multi-oriented text in scene image. Finally, by incorporating with Dual-RoI Pooling, our method further obtains a gain of $1.8%$ in F-measure and also achieves the highest recall and precision in the list. This suggest that the Dual-RoI Pooling is indeed helpful for the scene text detector.
首先,使用基于角点的RPN (Corner-based RPN)替代传统RPN后,F值从0.579提升至0.656。值得注意的是,基线模型中的回归任务是为优化矩形边界框而设计的。接着,为了生成更精确的候选框,我们在conv4层采用第2.3节介绍的融合结构进行预测,该模型使F值获得显著提升(0.656 vs 0.774)。将RoI池化替换为RRoI池化后,F值达到0.827,这一表现也优于近期提出的旋转RPN(表3中显示的0.800 F值)。由此可得出结论:基于角点的RPN能更有效地匹配场景图像中的多方向文本。最终,通过引入双RoI池化(Dual-RoI Pooling),我们的方法在F值上进一步获得1.8%的提升,并实现了当前最高的召回率与精确率。这表明双RoI池化确实对场景文本检测器具有增益效果。
3.3. Experimental Results
3.3. 实验结果
We evaluate our method on public benchmarks, following the standard evaluation protocols in each field. Fig.5 shows some detection results from these datasets.
我们在公开基准上评估了我们的方法,遵循各领域的标准评估协议。图 5: 展示了来自这些数据集的一些检测结果。

Figure 5: Selected results from the public benchmarks. Viewing digitally with zoom is recommended.
图 5: 公开基准测试中的部分结果。建议通过数字缩放查看。
3.3.1. ICDAR 2013 Focused Scene Text
3.3.1. ICDAR 2013 聚焦场景文本
The ICDAR 2013 [34] dataset consists of 229 training and 233 testing images which were captured by user explicitly detecting the focus of the camera on the text content of interest. It is the standard benchmark for evaluating horizontal or nearly horizontal text detection. In this benchmark, all of the testing images are resized with a fixed short side of 640 and we obtain an F-measure of 0.876 by using the ICDAR 2013 standard. As depicted in Table. 2, the result of proposed method is a comparable performance with a state-of-the-art method [40], which utilizes a Connection is t Text Proposal Network to detect texts by predicting the sequence of fine-scale text components. Our method also outperforms other compared methods including DeepText [12], FCRN [13] and TextBoxes [14], which are mainly designed for nearly horizontal text detection. The proposed method runs at 9.1 fps, which is slightly faster than recent public work [21]. However, it is still too slow for real-time (25 fps) or nearly real-time application.
ICDAR 2013 [34] 数据集包含229张训练图像和233张测试图像,这些图像通过用户显式调整相机焦点以捕捉目标文本内容获得。该数据集是评估水平或近水平文本检测的标准基准。在此基准测试中,所有测试图像均被调整为固定短边640像素,使用ICDAR 2013标准评估时,我们的F-measure达到0.876。如表2所示,本方法性能与当前最优方法[40]相当,后者通过连接文本提议网络(Connectionist Text Proposal Network)预测细粒度文本组件序列进行检测。相比其他主要针对近水平文本设计的对比方法(包括DeepText [12]、FCRN [13]和TextBoxes [14]),本方法表现更优。该方法运行速度为9.1 fps,略快于近期公开成果[21],但仍未达到实时(25 fps)或近实时应用要求。
Table 2: Results on ICDAR 2013 Focused Scene Text. The results are reported in terms of Recall (R), Precision (P) and F-measure (F). (–) means no report in their papers.
表 2: ICDAR 2013 Focused Scene Text 数据集上的结果。结果以召回率 (R)、精确率 (P) 和 F值 (F) 的形式报告。(-) 表示原论文未报告。
| 方法 | ICDARStandard | DetEval | FPS | ||||
|---|---|---|---|---|---|---|---|
| R | P | F | R | P | F | ||
| FASText [3] | 0.693 | 0.840 | 0.768 | - | - | - | 6.7 |
| TextFlow [7] | 0.759 | 0.852 | 0.803 | - | - | - | 1.1 |
| TextBoxes[14] | 0.740 | 0.860 | 0.800 | 0.740 | 0.880 | 0.810 | 11.1 |
| FCRN [13] | 0.764 | 0.938 | 0.842 | 0.755 | 0.920 | 0.830 | 0.8 |
| DeepText [12] | 0.830 | 0.870 | 0.850 | - | - | - | 0.6 |
| SegLink [41] | - | - | - | 0.830 | 0.877 | 0.853 | 20.6 |
| CTPN [40] | 0.730 | 0.930 | 0.820 | 0.820 | 0.930 | 0.880 | 7.1 |
| SSTD [21] | 0.860 | 0.880 | 0.870 | 0.860 | 0.890 | 0.880 | 7.7 |
| Ours | 0.839 | 0.919 | 0.876 | 0.840 | 0.921 | 0.879 | 9.1 |
3.3.2. ICDAR 2015 Incidental Scene Text
3.3.2. ICDAR 2015 自然场景文本检测
The ICDAR 2015 [35] benchmark was released during the ICDAR 2015 Robust Reading Competition. It provides 1000 training and 500 test images which was collected without taking any specific prior attention. Therefore, it is more difficult than previous ICDAR challenges. In this benchmark, we rescale all of the testing images such that their short side is 900 pixels for detecting small text regions. As shown in Table.3, our method achieves an F-measure of 0.845, surpassing all of the anchor fashion methods, including RRPN [15] and $R^{2}{\mathrm{CNN}}$ [26], which are also extended from Faster R-CNN [9] framework and employ VGG-16 [30] as the backbone of network. The FTSN [25] based on detecting and segmenting text instance is very close to us in performance, but it is built on a more powerful network (ResNet-101 [42]). However, compared with EAST [43] which utilizes a deep regression network that directly predicts text region with arbitrary orientations in full images, there is still a big gap in terms of recall.
ICDAR 2015 [35] 基准数据集发布于ICDAR 2015鲁棒阅读竞赛期间。该数据集提供了1000张训练图像和500张测试图像,这些图像在采集时未经过特定预处理,因此比往届ICDAR挑战赛更具难度。在本基准测试中,我们将所有测试图像的短边缩放至900像素以检测小文本区域。如表3所示,我们的方法取得了0.845的F值,超越了所有主流方法(包括基于Faster R-CNN [9]框架并采用VGG-16 [30]作为骨干网络的RRPN [15]和$R^{2}{\mathrm{CNN}}$ [26])。基于文本实例检测与分割的FTSN [25]在性能上与我们非常接近,但其建立在更强大的网络架构(ResNet-101 [42])之上。然而,与采用深度回归网络直接预测全图像中任意方向文本区域的EAST [43]相比,在召回率方面仍存在较大差距。
Table 3: Results on ICDAR 2015 Incidental Scene Text.
表 3: ICDAR 2015 自然场景文本检测结果
| 方法 | 召回率 | 准确率 | F值 |
|---|---|---|---|
| MCLAB_FCN [44] | 0.430 | 0.710 | 0.540 |
| CTPN [40] | 0.520 | 0.740 | 0.610 |
| DMPNet [16] | 0.680 | 0.730 | 0.710 |
| SegLink [41] | 0.768 | 0.731 | 0.750 |
| SSTD [21] | 0.730 | 0.800 | 0.770 |
| RRPN [15] | 0.770 | 0.840 | 0.800 |
| EAST [43] | 0.833 | 0.783 | 0.807 |
| NLPR_CASIA [20] | 0.800 | 0.820 | 0.810 |
| R?CNN [26] | 0.797 | 0.856 | 0.825 |
| FTSN [25] | 0.800 | 0.886 | 0.841 |
| Ours | 0.807 | 0.887 | 0.845 |
3.3.3. COCO-Text
3.3.3. COCO-Text
The original images of COCO-Text [36] are harvested from Microsoft COCO [45] dataset, and it contains 43686 training images and 20000 images for validation and testing. It is the largest dataset for text detection and recognition in scene images to date. The testing images are resized with a fixed short side of 900, and our method achieves 0.633, 0.555 and 0.591 in recall, precision and F-measure by using the online evaluation system provided officially, as shown in Table.4. It is worth noting that no images from COCO-Text are involved in training phase. The presented results demonstrate that our method is capable of applying practically in the unseen contexts.
COCO-Text [36] 的原始图像采集自 Microsoft COCO [45] 数据集,包含 43686 张训练图像以及 20000 张验证和测试图像。这是目前场景图像中用于文本检测和识别的最大数据集。测试图像的短边统一调整为 900 像素,通过官方提供的在线评估系统,我们的方法在召回率、精确率和 F 值上分别达到 0.633、0.555 和 0.591,如表 4 所示。值得注意的是,训练阶段未使用任何来自 COCO-Text 的图像。结果表明,我们的方法能够有效应用于未见过的场景。
Table 4: Results on COCO-Text. The results of compared methods are grasped from the public COCO-Text leader board.
表 4: COCO-Text数据集上的结果。对比方法的实验结果来自公开的COCO-Text排行榜。
| 方法 | 召回率 (Recall) | 精确率 (Precision) | F值 (F-measure) |
|---|---|---|---|
| SCUT_DLVClab | 0.625 | 0.316 | 0.420 |
| SARIFDURRPN | 0.632 | 0.333 | 0.436 |
| UM | 0.654 | 0.475 | 0.551 |
| TDN_SJTU_v2 | 0.543 | 0.624 | 0.580 |
| Text_Detection_DL | 0.618 | 0.609 | 0.613 |
| Ours | 0.633 | 0.555 | 0.591 |
3.4. Limitations
3.4. 局限性
We further analyze the limitations of our method. In essence, the proposed framework utilizes a bottom-up strategy from corners to quadrilateral bounding-box. Hence the problem of accumulation of errors still exists. As shown in Fig.6.a, our method may fail to detect text with single character because we drop it in training stage for high precision. Moreover, our method still struggles with some extreme scenarios, such as the examples in Fig.6.b, c. Finally, we have to magnify the image size in order to detect small text region, which also limits the efficiency of our method.
我们进一步分析了本方法的局限性。本质上,该框架采用从角点到四边形边界框的自底向上策略,因此误差累积问题依然存在。如图6.a所示,由于在训练阶段为追求高精度而舍弃单字符文本,我们的方法可能无法检测这类文本。此外,该方法仍难以处理某些极端场景,例如图6.b和c中的案例。最后,为检测小文本区域不得不放大图像尺寸,这也制约了方法的效率。

Figure 6: Failure cases on ICDAR 2013 and 2015. Red boxes are false positives or true negatives. Best viewed zoomed in color.
图 6: ICDAR 2013 和 2015 上的失败案例。红色框表示误报或漏报。建议放大彩色查看。
4. Conclusion and Future Work
4. 结论与未来工作
This paper presents an intuitive region-based method towards multi-oriented text detection by learning the idea from the process of object annotation. We discard the anchor strategy and employ corners to estimate the possible locations of text instances. Based on corners, our method is flexible to generate quadrilateral proposals for capturing various kinds of texts. Moreover, we design a built-in data augmentation module inside the region-wise subnetwork, which not only utilizes training data more efficiently, but also improves the robustness of the resulting model. In the future, the performance of our method can be further improved by using much stronger networks, such as ResNet [42] or DenseNet [46]. Additionally, we are also interested in extending this method to an end-to-end text reading system.
本文提出了一种直观的基于区域的多方向文本检测方法,其灵感来源于目标标注过程。我们摒弃了锚框策略,转而采用角点来估计文本实例的可能位置。基于角点的方法能灵活生成四边形提案框,从而捕捉各类文本形态。此外,我们在区域子网中设计了内置数据增强模块,不仅更高效地利用训练数据,还提升了最终模型的鲁棒性。未来可通过采用更强大的网络(如ResNet [42]或DenseNet [46])进一步提升本方法性能。我们也有兴趣将该方法扩展为端到端文本阅读系统。