Enhancing Wrist Fracture Detection with YOLO: Analysis of State-of-the-art Single-stage Detection Models
基于YOLO的腕部骨折检测增强:先进单阶段检测模型分析
A R T I C L E I N F O
文章信息
A B S T R A C T
摘要
Diagnosing and treating abnormalities in the wrist, specifically distal radius, and ulna fractures, is a crucial concern among children, adolescents, and young adults, with a higher incidence rate during puberty. However, the scarcity of radiologists and the lack of specialized training among medical professionals pose a significant risk to patient care. This problem is further exacerbated by the rising number of imaging studies and limited access to specialist reporting in certain regions. This highlights the need for innovative solutions to improve the diagnosis and treatment of wrist abnormalities. Automated wrist fracture detection using object detection has shown potential, but current studies mainly use two-stage detection methods with limited evidence for single-stage effectiveness. This study employs state-of-the-art single-stage deep neural network-based detection models YOLOv5, YOLOv6, YOLOv7, and YOLOv8 to detect wrist abnormalities. Through extensive experimentation, we found that these YOLO models outperform the commonly used two-stage detection algorithm, Faster R-CNN, in fracture detection. Additionally, compound-scaled variants of each YOLO model were compared, with YOLOv8m demonstrating a highest fracture detection sensitivity of 0.92 and mean average precision (mAP) of 0.95. On the other hand, YOLOv6m achieved the highest sensitivity across all classes at 0.83. Meanwhile, YOLOv8x recorded the highest mAP of 0.77 for all classes on the GRAZPEDWRI-DX pediatric wrist dataset, highlighting the potential of single-stage models for enhancing pediatric wrist imaging.
诊断和治疗腕部异常(尤其是桡骨远端和尺骨骨折)是儿童、青少年和年轻成人群体中的关键问题,在青春期发病率较高。然而,放射科医师的稀缺以及医疗专业人员缺乏专业培训,对患者护理构成了重大风险。随着影像检查数量的增加和某些地区专科报告的获取受限,这一问题进一步加剧。这凸显了需要创新解决方案来改善腕部异常的诊断和治疗。
基于目标检测的自动腕部骨折识别已展现出潜力,但目前研究主要采用两阶段检测方法,关于单阶段方法有效性的证据有限。本研究采用最先进的基于单阶段深度神经网络的检测模型 YOLOv5、YOLOv6、YOLOv7 和 YOLOv8 来检测腕部异常。通过大量实验,我们发现这些 YOLO 模型在骨折检测中优于常用的两阶段检测算法 Faster R-CNN。此外,比较了各 YOLO 模型的复合缩放变体,其中 YOLOv8m 表现出最高的骨折检测灵敏度(0.92)和平均精度均值(mAP,0.95)。另一方面,YOLOv6m 在所有类别中实现了最高的灵敏度(0.83)。同时,YOLOv8x 在 GRAZPEDWRI-DX 儿科腕部数据集上记录了所有类别的最高 mAP(0.77),凸显了单阶段模型在提升儿科腕部影像诊断中的潜力。
1. Introduction
1. 引言
Wrist abnormalities are a common occurrence in children, adolescents, and young adults. Among them, wrist fractures such as distal radius and ulna fractures are the most common with incidence peaks during puberty Hedstrom, Svensson, Bergstrom and Michno (2010); Randsborg et al. (2013); Landin (1997); Cheng and Shen (1993). Timely evaluation and treatment of these fractures are essential to prevent life-long implications. Digital radio graph y is a widely used imaging modality to obtain wrist radio graphs. While X-ray is often the first and most common imaging modality used for wrist problems, the choice of test depends on the suspected abnormality, clinical presentation, and available resources. If an X-ray doesn’t provide a clear diagnosis, other imaging modalities like MRI, CT, or ultrasound may be recommended. The obtained radio graphs are then interpreted by surgeons or physicians in training to diagnose wrist abnormalities. However, medical professionals may lack the specialized training to assess these injuries accurately and may rely on radiograph interpretation without the support of an expert radiologist or qualified colleagues Hallas and Ellingsen (2006). Studies have shown that diagnostic errors in reading emergency X-rays can reach up to $26%$ Guly (2001); Mounts, C lingen peel, McGuire, Byers and Kireeva (2011); Er, Kara, Oyar and Unluer (2013); Juhl, Moller-Madsen and Jensen (1990). This is compounded by the shortage of radiologists even in developed countries
手腕异常在儿童、青少年和年轻成人中较为常见。其中,桡骨远端和尺骨骨折等手腕骨折最为普遍,其发病率在青春期达到峰值 (Hedstrom, Svensson, Bergstrom and Michno 2010; Randsborg et al. 2013; Landin 1997; Cheng and Shen 1993)。及时评估和治疗这些骨折对于避免终身影响至关重要。数字X线摄影是获取手腕X线片的常用成像方式。虽然X线通常是手腕问题的首选和最常用成像方法,但检查选择取决于疑似异常、临床表现和可用资源。若X线无法明确诊断,则可能建议采用MRI、CT或超声等其他成像方式。随后,由外科医生或实习医师解读所获得的X线片以诊断手腕异常。然而,医疗专业人员可能缺乏准确评估这些损伤的专业培训,且可能在缺乏放射科专家或合格同事支持的情况下依赖X线片解读 (Hallas and Ellingsen 2006)。研究表明,急诊X线读片的诊断错误率可高达$26%$ (Guly 2001; Mounts, C lingen peel, McGuire, Byers and Kireeva 2011; Er, Kara, Oyar and Unluer 2013; Juhl, Moller-Madsen and Jensen 1990)。即使在发达国家,放射科医师的短缺也加剧了这一问题。
Burki (2018); Rimmer (2017); Makary and Takacs (2022) and limited access to specialist reporting in other parts of the world Rosman (2015) posing a high risk to patient care. The shortage is expected to escalate in the upcoming years due to a growing disparity between the increasing demand for imaging studies and the limited supply of radiology residency positions. The number of imaging studies rises by an average of five percent annually, while the number of radiology residency positions only grows by two percent. Smith-Bindman, Kwan, Marlow and et al. (2019). While imaging modalities such as MRI, CT, and ultrasound can further assist in the diagnosis of wrist abnormalities, some fractures may still be occult Fotiadou, Patel, Morgan and Karantanas (2011); Neubauer et al. (2016).
Burki (2018); Rimmer (2017); Makary和Takacs (2022) 以及世界其他地区专业报告获取受限 Rosman (2015) 对患者护理构成高风险。由于影像检查需求增长与放射科住院医师职位供应有限之间的差距日益扩大,预计未来几年短缺问题将加剧。影像检查数量每年平均增长5%,而放射科住院医师职位仅增长2%。Smith-Bindman、Kwan、Marlow等 (2019)。虽然MRI、CT和超声等影像模态可进一步协助诊断腕部异常,但某些骨折仍可能隐匿 Fotiadou、Patel、Morgan和Karantanas (2011); Neubauer等 (2016)。
Recent advances in computer vision, more specifically, object detection have shown promising results in medical settings. Some of the positive results of detecting pathologies in trauma X-rays were recently published Adams, Henderson, Yi and Babyn (2020); Tanzi et al. (2020); Choi et al. (2020). In recent years, significant progress has been made in the development of object detection algorithms, leading to their widespread adoption in the medical community. An earlier approach called the sliding window approach Lampert, Blaschko and Hofmann (2008) for object detection involved dividing an image into a grid of overlapping regions and then classifying each region as containing the object of interest or not. Key implementations of this method include cascade class if i ers that employ LBP (Local Binary Patterns)
计算机视觉领域,尤其是目标检测技术的最新进展,在医疗场景中展现出令人瞩目的成果。近期多项研究 [Adams, Henderson, Yi and Babyn (2020); Tanzi et al. (2020); Choi et al. (2020)] 证实了该技术在创伤X光片病理检测中的有效性。近年来,目标检测算法的显著进步使其在医疗界得到广泛应用。早期采用滑动窗口法 [Lampert, Blaschko and Hofmann (2008)] 进行目标检测时,需将图像划分为重叠区域网格,再逐区域判断是否包含目标对象。该方法的关键实现包括采用LBP (Local Binary Patterns) 特征的级联分类器。
or Haar-like features. These class if i ers are trained using positive examples of a specific object set against random negative images of the same size. Once optimized, the classifier can accurately identify the target object within a specific section of an image. To detect the object throughout the whole image, the classifier systematically examines each segment. It’s essential to differentiate between LBP and Haar-like features. LBP characterizes the local texture of an image by comparing a pixel to its neighboring ones, while Haarlike features measure differences in pixel intensities within neighboring rectangular areas. There are several disadvantages of the sliding window approach, one of them being that it is computationally expensive as a large number of regions need to be classified. To address these issues, region-based methods were invented. The main idea behind these methods was to generate candidate object regions and classify only those regions as containing the object of interest or not.
或类 Haar 特征。这些分类器使用特定对象的正例样本与相同尺寸的随机负例图像进行训练。优化后,分类器能准确识别图像特定区域中的目标对象。为了在整个图像中检测对象,分类器会系统性地检查每个片段。区分 LBP 和类 Haar 特征至关重要:LBP 通过比较像素与其邻域像素来描述图像的局部纹理,而类 Haar 特征则测量相邻矩形区域内像素强度的差异。滑动窗口方法存在若干缺点,其中之一是计算成本高,因为需要对大量区域进行分类。为解决这些问题,人们发明了基于区域的方法,其核心思想是生成候选对象区域,仅对这些区域进行分类以判断是否包含目标对象。
Another method developed as an improvement over the sliding window approach was the single-stage detection method which has gained popularity in recent years due to its efficiency and good performance. This approach uses a single forward propagation through the network to predict bounding boxes and class probabilities, eliminating the need to generate candidate object regions, and making it faster than region-based approaches. While two-stage detection generates candidate regions in the first stage and refines them in the second stage at the cost of speed and computational efficiency, single-stage detection provides a balance between speed and accuracy by predicting final results in a single pass through the network.
作为对滑动窗口方法的改进,另一种近年因高效和良好性能而流行的技术是单阶段检测法。该方法通过单次网络前向传播同时预测边界框和类别概率,无需生成候选目标区域,因而比基于区域的方法更快速。双阶段检测首先生成候选区域,第二阶段进行细化,但牺牲了速度和计算效率;相比之下,单阶段检测通过单次网络推理直接输出最终结果,在速度与精度间实现了平衡。
Two-stage detection has been the most widely used approach for detecting wrist abnormalities in recent years. However, there has been limited research on the effectiveness of single-stage detectors in detecting various abnormalities in the wrist, including fractures. In this study, we focus on the effectiveness of SOTA single-stage detectors in detecting wrist abnormalities. Additionally, this study is unique in its use of a large, comprehensively annotated dataset called GRAZPEDWRI-DX presented in a recent publication Nagy, Janisch, Hržić, Sorantin and Tschauner (2022). The characteristics and complexity of the dataset are discussed in section 4.
近年来,两阶段检测一直是检测手腕异常最广泛使用的方法。然而,关于单阶段检测器在检测手腕各类异常(包括骨折)方面的有效性研究却十分有限。本研究重点关注SOTA(State-of-the-Art)单阶段检测器在手腕异常检测中的有效性。此外,本研究的独特之处在于使用了近期发表的GRAZPEDWRI-DX大型综合标注数据集(Nagy, Janisch, Hržić, Sorantin和Tschauner,2022)。第4节将讨论该数据集的特征和复杂性。
Wrist fractures represent just one of several typical wrist abnormalities, other prevalent conditions include Carpal Tunnel Syndrome (CTS), Ganglion Cysts, Osteoarthritis, Tendinitis, as well as Sprains and Strains. Within the dataset that we use, the distinct objects are categorized as fracture, per io steal reaction, metal, pron at or sign, softtissue, boneanomaly, bonelesion, and foreign body. It’s crucial to understand that our primary goal is to detect these specific objects rather than diagnose the over arching abnormalities. In our context, the presence of these objects (including fractures) in the wrist can be considered as ’abnormal’. Moreover, the presence of objects other than fractures may suggest another associated wrist abnormality. For instance, soft tissue presence might be indicative of CTS or a ganglion cyst. In CTS, swelling of the synovial tissue that lines the tendons in the carpal tunnel may be observable. Conversely, a ganglion cyst manifests as a soft tissue structure. The term ’bone lesion’ denotes an anomalous area within the bone, severe sprains can involve avulsion fractures where a fragment of bone is pulled away by the ligament.
腕部骨折只是几种典型腕部异常情况之一,其他常见病症还包括腕管综合征 (CTS) 、腱鞘囊肿、骨关节炎、肌腱炎以及扭伤和拉伤。在我们使用的数据集中,不同对象被分类为骨折、骨膜反应、金属物、旋前肌征、软组织、骨异常、骨病变和异物。需要明确的是,我们的主要目标是检测这些特定对象而非诊断 overarching 异常。在本研究中,腕部出现这些对象(包括骨折)可被视为"异常"。此外,非骨折对象的存在可能提示其他相关腕部异常。例如,软组织存在可能暗示腕管综合征或腱鞘囊肿——腕管综合征中可观察到肌腱滑膜组织肿胀,而腱鞘囊肿则表现为软组织结构。"骨病变"指骨骼内的异常区域,严重扭伤可能涉及韧带撕脱性骨折(骨碎片被韧带扯离)[20]。
1.1. Study Objective & Research Questions
1.1. 研究目标与问题
The primary objective of this study is to test the effec ti ve ness of the state-of-the-art YOLO detection models, YOLOv5, YOLOv6, YOLOv7, and YOLOv8 on a comprehensively annotated dataset "GRAZPEDWRI-DX" recently released to the public. We compare the performances of all variants within each YOLO model employed to see whether the use of a compound-scaled version of the same architecture improves its performance. Moreover, this study also investigates how effective these single-stage detection methods are in detecting fractures compared to a two-stage detection method widely used in the past. In addition to conducting object detection across multiple classes, we also evaluate the performance of a conventional CNN in binary classification, specifically in distinguishing between fractures and non-fractures. We hypothesize that fractures in the near vicinity of the wrist in pediatric X-ray images can be detected efficiently using YOLO models proposed by ultra ly tics (2022), Li, Li, Jiang, Weng, Geng, Li, Ke, Li, Cheng, Nie, Li, Zhang, Liang, Zhou, Xu, Chu and Wei (2022), Wang, Boc hk ovsk iy and Liao (2022), and ultra ly tics (2023) respectively.
本研究的主要目标是测试最先进的YOLO检测模型(包括YOLOv5、YOLOv6、YOLOv7和YOLOv8)在近期公开的全面标注数据集"GRAZPEDWRI-DX"上的有效性。我们比较了每个YOLO模型所有变体的性能,以验证相同架构的复合缩放版本是否能提升其表现。此外,本研究还探讨了这些单阶段检测方法与过去广泛使用的两阶段检测方法相比,在骨折检测方面的效果差异。除了进行多类别目标检测外,我们还评估了传统CNN在二分类任务(即区分骨折与非骨折)中的性能。我们假设,使用ultralytics (2022)、Li等(2022)、Wang等(2022)和ultralytics (2023)分别提出的YOLO模型,可以有效检测儿科X光图像中腕部附近区域的骨折。
We analyze the potential of utilizing object detection techniques in answering the following research questions (RQ):
我们分析了利用目标检测技术回答以下研究问题(RQ)的潜力:
1.2. Contribution
1.2. 贡献
The major contributions of this article are as follows:
本文的主要贡献如下:
• A thorough performance assessment of SOTA YOLO detection models on the newly released GRAZPEDWRIDX dataset, a large and diverse set of pediatric X-ray images. To the best of our knowledge, this is the first study of its kind. • An in-depth comparison of the performance of various variants within each YOLO model utilized. • Achieved state-of-the-art mean average precision (mAP) score on the GRAZPEDWRI-DX dataset.
• 在新发布的GRAZPEDWRI-DX数据集(一个庞大且多样化的儿科X光影像集)上对SOTA YOLO检测模型进行全面性能评估。据我们所知,这是该领域的首项研究。
• 深入比较所用各YOLO模型变体的性能表现。
• 在GRAZPEDWRI-DX数据集上实现了最先进的平均精度均值(mAP)分数。
• A detailed performance analysis of single-stage detection models in comparison to the widely-used twostage detection model, Faster R-CNN.
• 对单阶段检测模型与广泛使用的两阶段检测模型 Faster R-CNN 进行详细性能分析。
2. Related Work
2. 相关工作
Fracture detection is a crucial aspect in the field of wrist trauma, and computer vision techniques have played a significant role in advancing the research in this area. This section provides a comprehensive overview of the existing studies on fracture detection and highlights the key findings. The studies are divided into two subheadings: "Two-stage detection" and "One-stage detection". The first subheading covers studies that have used two-stage detection techniques, while the second subheading focuses on studies that have only employed single-stage detection algorithms.
手腕创伤领域的骨折检测至关重要,计算机视觉技术在该领域的研究推进中发挥了重要作用。本节全面综述了现有骨折检测研究并突出关键发现,将相关研究分为两个子章节:"两阶段检测"与"单阶段检测"。第一个子章节涵盖采用两阶段检测技术的研究,第二个子章节则聚焦仅使用单阶段检测算法的研究。
2.1. Two-stage detection
2.1. 两阶段检测
The detection of bone abnormalities, including fracture detection, has been widely studied in the literature, mainly using two-stage detection algorithms. For instance, In a study by Yahalomi, Chernofsky and Werman (2018), a Faster R-CNN model utilizing Visual Geometry Group (VGG16) was applied to identify distal radius fractures in antero posterior wrist X-ray images. The model achieved a mAP of 0.87 when tested on a set of 1,312 images. It should be noted that the initial dataset consisted of only 95 antero posterior images, with and without fractures, which were then augmented for training as well as for testing.
骨骼异常检测(包括骨折检测)在文献中已有广泛研究,主要采用两阶段检测算法。例如,Yahalomi、Chernofsky和Werman (2018) 的研究中,应用了基于Visual Geometry Group (VGG16) 的Faster R-CNN模型来识别腕关节正位X光图像中的桡骨远端骨折。该模型在1,312张测试图像上取得了0.87的mAP值。值得注意的是,初始数据集仅包含95张正位图像(含骨折与不含骨折),随后通过数据增强扩充用于训练和测试。
Thian, Li, Jagmohan, Sia, Chan and Tan (2019) developed two separate Faster R-CNN models with InceptionResNet for frontal and lateral projections of wrist images. The models were trained on 6,515 and 6,537 images of frontal and lateral projections, respectively. The frontal model detected $91%$ of fractures, with a specificity of 0.83 and a sensitivity of 0.96. The lateral model detected $96%$ of fractures, with a specificity of 0.86 and a sensitivity of 0.97. Both models had a high area under the receiver operating characteristic curve (AUC-ROC) values, with the frontal model having 0.92 and the lateral model having 0.93. The overall per-study specificity was 0.73, sensitivity was 0.98, and AUC was 0.89.
Thian、Li、Jagmohan、Sia、Chan和Tan (2019) 开发了两个独立的Faster R-CNN模型,采用InceptionResNet架构,分别用于腕部图像的正位和侧位投影。模型分别在6,515张正位投影图像和6,537张侧位投影图像上进行了训练。正位模型检测到$91%$的骨折,特异性为0.83,灵敏度为0.96。侧位模型检测到$96%$的骨折,特异性为0.86,灵敏度为0.97。两个模型的受试者工作特征曲线下面积 (AUC-ROC) 值均较高,正位模型为0.92,侧位模型为0.93。整体每项研究的特异性为0.73,灵敏度为0.98,AUC为0.89。
Guan, Zhang, Yao, Wang and Wang (2020) used a twostage R-CNN method to achieve an average precision (AP) of 0.62 on approximately $4{,}000\mathrm{X}$ -ray images of arm fractures in mus cul o skeletal radio graphs, MURA dataset. Wang, Yao, Zhang, Guan, Wang and Zhang (2021) developed a twostage R-CNN network called Parallel Net, with a TripleNet backbone network, for fracture detection in a dataset of 3,842 thigh fracture X-ray images, achieving an AP of 0.88 at an Intersection over Union (IoU) threshold of 0.5.
Guan、Zhang、Yao、Wang和Wang (2020) 采用两阶段R-CNN方法,在肌肉骨骼放射影像MURA数据集的约4000张手臂骨折X光片上实现了0.62的平均精度(AP)。Wang、Yao、Zhang、Guan、Wang和Zhang (2021) 开发了名为Parallel Net的双阶段R-CNN网络,其主干网络为TripleNet,用于3842张大腿骨折X光片数据集的骨折检测,在交并比(IoU)阈值为0.5时达到0.88的AP值。
Qi, Zhao, Shi, Zuo, Zhang, Long, Wang and Wang (2020) used a Faster R-CNN model with an anchor-based approach, combined with a multi-resolution Feature Pyramid Network (FPN) and a ResNet50 backbone network. They tested the model on $2333\mathrm{X}$ -ray images of different types of femoral fractures and obtained a mAP score of 0.69.
Qi、Zhao、Shi、Zuo、Zhang、Long、Wang和Wang (2020) 采用基于锚点的Faster R-CNN模型,结合多分辨率特征金字塔网络 (FPN) 和ResNet50主干网络。他们在2333张不同类型股骨骨折的X射线图像上测试该模型,获得了0.69的mAP分数。
Raisuddin, Va at to va ara, Nevalainen and et al. (2021) developed a deep learning-based pipeline called DeepWrist for detecting distal radius fractures. The model was trained on a dataset of 1946 wrist studies and was evaluated on two test sets. The first test set, comprising 207 cases, resulted in an AP score of 0.99, while the second test set, comprising 105 challenging cases, resulted in an AP of 0.64. The model generated heatmaps to indicate the probability of a fracture near the vicinity of the wrist but did not provide a bounding box or polygon to clearly locate the fracture. The study was limited by the use of a small dataset with a disproportionate number of challenging cases.
Raisuddin、Va at to va ara、Nevalainen等人(2021)开发了一个名为DeepWrist的基于深度学习(deep learning)的流程,用于检测桡骨远端骨折。该模型在1946个腕部研究数据集上进行训练,并在两个测试集上进行评估。第一个测试集包含207个病例,AP得分为0.99;第二个测试集包含105个具有挑战性的病例,AP得分为0.64。该模型生成热图(heatmap)来显示腕部附近骨折的概率,但没有提供边界框(bounding box)或多边形来精确定位骨折位置。该研究的局限性在于使用了小数据集,且具有挑战性的病例比例过高。
Ma and Luo (2021) in their study, first classified the images in the Radio pae dia dataset into the fracture and nonfracture categories using CrackNet. After this, they utilized Faster R-CNN for fracture detection on the 1052 bone images in the dataset. With an accuracy of 0.88, a recall of 0.88, and a precision of 0.89, they demonstrated the usefulness of the proposed approach. Wu, Yan, Liu, Yu, Geng, Wu, Han, Guo and Gao (2021) applied a Feature Ambiguity Mitigate Operator model along with ResNeXt101 and a FPN to identify fractures in a collection of 9040 radio graphs of various body parts, including the hand, wrist, pelvic, knee, ankle, foot, and shoulder. They accomplished an AP of 0.77.
Ma 和 Luo (2021) 在其研究中,首先使用 CrackNet 将 Radio pae dia 数据集中的图像分类为骨折和非骨折两类。随后,他们利用 Faster R-CNN 对数据集中的 1052 张骨骼图像进行骨折检测,并以 0.88 的准确率、0.88 的召回率和 0.89 的精确度验证了该方法的有效性。Wu、Yan、Liu、Yu、Geng、Wu、Han、Guo 和 Gao (2021) 则采用特征模糊缓解算子 (Feature Ambiguity Mitigate Operator) 模型结合 ResNeXt101 和 FPN,对包含手部、腕部、骨盆、膝盖、脚踝、足部和肩部等部位的 9040 张放射图像进行骨折识别,最终实现了 0.77 的平均精度 (AP)。
Xue, Yan, Luo, Zhang, Chaikovska, Liu, Gao and Yang (2021) proposed a guided anchoring method (GA) for fracture detection in hand X-ray images using the Faster RCNN model, which was used to forecast the position of fractures using proposal regions that were refined using the GA module’s learnable and flexible anchors. They evaluated the method on 3067 images and achieved an AP score of 0.71.
Xue、Yan、Luo、Zhang、Chaikovska、Liu、Gao和Yang (2021) 提出了一种用于手部X射线图像骨折检测的引导锚定方法(GA),该方法采用Faster RCNN模型,通过GA模块可学习且灵活的锚点优化提案区域来预测骨折位置。他们在3067张图像上评估了该方法,获得了0.71的AP分数。
Hardalaç, Uysal, Peker, Çiçeklidağ, Tolunay, Tokgöz, Kutbay, Demirciler and Mert (2022) conducted 20 fracture detection experiments using a dataset of wrist X-ray images from Gazi University Hospital. To improve the results, they developed an ensemble model by combining five different models, named WFD-C. Out of the 26 models evaluated for fracture detection, the WFD-C model achieved the highest average precision of 0.86. This study utilized both two-stage and single-stage detection methods. The two-stage models employed were Dynamic R-CNN, Faster R-CNN, and SABL and DCN models based on Faster R-CNN. Meanwhile, the single-stage models used were PAA, FSAF, RetinaNet and RegNet, SABL, and Libra.
Hardalaç、Uysal、Peker、Çiçeklidağ、Tolunay、Tokgöz、Kutbay、Demirciler和Mert (2022) 使用加齐大学医院的手腕X光图像数据集进行了20次骨折检测实验。为提高结果,他们通过结合五种不同模型开发了一个集成模型,命名为WFD-C。在评估的26个骨折检测模型中,WFD-C模型以0.86的平均精度取得了最高成绩。该研究同时采用了两阶段和单阶段检测方法。使用的两阶段模型包括Dynamic R-CNN、Faster R-CNN,以及基于Faster R-CNN的SABL和DCN模型。而单阶段模型则采用了PAA、FSAF、RetinaNet和RegNet、SABL,以及Libra。
Joshi, Singh and Joshi (2022) employed transfer learning with a modified Mask R-CNN to detect and segment fractures using two datasets: a surface crack image dataset of 3000 images and a wrist fracture dataset of 315 images. They first trained the model on the surface crack dataset and then fine-tuned it on the wrist fracture dataset. They achieved an average precision of $92.3%$ for detection and 0.78 for segmentation on a 0.5 scale, 0.79 for detection, and 0.52 for segmentation on a strict 0.75 scale.
Joshi、Singh和Joshi (2022) 采用迁移学习结合改进的Mask R-CNN模型,通过两个数据集实现骨折检测与分割:包含3000张图像的地表裂缝数据集和315张图像的腕部骨折数据集。他们先在地表裂缝数据集上训练模型,随后在腕部骨折数据集上微调。模型在0.5阈值下取得检测平均精度92.3%、分割精度0.78;在严格0.75阈值下达到检测精度0.79、分割精度0.52。
2.2. One-stage detection
2.2. 单阶段检测
Very few studies have been conducted demonstrating the performance of one-stage detectors in the area of wrist trauma and fracture detection. In the study by Sha, Wu and Yu (2020a), a YOLOv2 model was used to detect fractures in a dataset of 5134 spinal CT images, resulting in a mAP of 0.75. In another research by the same authors Sha, Yu and Wu (2020b), a Faster R-CNN model was applied to the same dataset, yielding an mAP of 0.73.
目前关于单阶段检测器在手腕创伤和骨折检测领域性能的研究较少。Sha、Wu和Yu (2020a) 的研究中,使用YOLOv2模型在包含5134张脊柱CT图像的数据集上检测骨折,获得了0.75的mAP值。同一作者团队Sha、Yu和Wu (2020b) 的另一项研究中,将Faster R-CNN模型应用于相同数据集,取得了0.73的mAP值。
A recent study by Hrži’c et al. (2022) compared the performance of the YOLOv4 object detection model Boc hk ovsk iy Wang and Liao (2020) to that of the U-Net segmentation model proposed by Lindsey, Daluiski, Chopra, Lachapelle, Mozer, Sicular, Hanel, Gardner, Gupta, Hotchkiss et al. (2018) and a group of radiologists on the "GRAZPEDWRIDX" dataset. The authors trained two YOLOv4 models for this study: one for identifying the most probable fractured object in an image and the other for counting the number of fractures present in an image. The first YOLOv4 model achieved high performance, with an AUC-ROC of 0.90 and an F1-score of 0.90, while the second YOLOv4 model achieved an AUC-ROC of 0.90 and an F1-score of 0.96. These results demonstrate the superior performance of YOLOv4 in comparison to traditional methods for fracture detection.
Hrži'c等人 (2022) 的最新研究在"GRAZPEDWRIDX"数据集上比较了YOLOv4目标检测模型 (Bochkovskiy Wang和Liao, 2020) 与U-Net分割模型 (Lindsey, Daluiski, Chopra, Lachapelle, Mozer, Sicular, Hanel, Gardner, Gupta, Hotchkiss等人, 2018) 以及一组放射科医生的表现。作者为此训练了两个YOLOv4模型:一个用于识别图像中最可能的骨折对象,另一个用于统计图像中的骨折数量。第一个YOLOv4模型表现出色,AUC-ROC为0.90,F1分数为0.90;第二个YOLOv4模型的AUC-ROC为0.90,F1分数达到0.96。这些结果表明YOLOv4在骨折检测方面优于传统方法。
The "GRAZPEDWRI-DX" dataset used in this study was recently published Nagy et al. (2022). The authors presented the baseline results for the dataset using the COCO pretrained YOLOv5m variant of YOLOv5. The model was trained on 15,327 (of 20,327) images and tested on 1,000 images. They achieved a mAP of 0.93 for fracture detection and an overall mAP of 0.62 at an IoU threshold of 0.5.
本研究所用的"GRAZPEDWRI-DX"数据集由Nagy等人 (2022) 近期发布。作者使用基于COCO预训练的YOLOv5m变体作为基线模型,该模型在15,327张 (共20,327张) 图像上训练,并在1,000张测试图像上取得0.93的骨折检测mAP值,在IoU阈值为0.5时整体mAP达到0.62。
In conclusion, the literature review shows that the majority of studies on fracture detection have utilized the twostage detection approach. Additionally, the datasets utilized in these studies tend to be limited in size in comparison to the dataset used in our study. This study builds upon the work of studies Hrži’c et al. (2022) and Nagy et al. (2022) by conducting a comprehensive comparative study between the state-of-the-art single-stage detection algorithms (YOLOv5, YOLOv6, YOLOv7, and YOLOv8) and a widely used twostage model Faster R-CNN. The results of this study provide valuable insights into the performance of these algorithms and contribute to the ongoing research in the field of wrist trauma and fracture detection.
综上所述,文献综述表明大多数骨折检测研究采用了双阶段检测方法。此外,这些研究使用的数据集规模普遍小于本研究采用的数据集。本研究基于Hrži'c等人 (2022) 和Nagy等人 (2022) 的工作,对当前最先进的单阶段检测算法 (YOLOv5、YOLOv6、YOLOv7和YOLOv8) 与广泛使用的双阶段模型Faster R-CNN进行了全面对比研究。该研究结果为这些算法的性能评估提供了重要参考,并推动了腕部创伤及骨折检测领域的持续研究。
3. Material & Methods
3. 材料与方法
3.1. Research Design
3.1. 研究设计
A quantitative (experimental) study is conducted using data from 10,643 wrist radio graph y studies of 6,091 unique patients collected by the Division of Paediatric Radiology, Department of Radiology, Medical University of Graz, Austria. As shown in Fig. 1, the dataset was randomly partitioned into a training set of 15,245, a validation set of 4,066, and a testing set of 1016. In the following subsection, we describe various measurements used to assess the performance of the models.
一项定量(实验)研究使用了奥地利格拉茨医科大学放射科儿科放射学部门收集的6,091名独特患者的10,643份手腕X光片数据。如图1所示,数据集被随机划分为15,245份的训练集、4,066份的验证集和1,016份的测试集。在接下来的小节中,我们将描述用于评估模型性能的各种测量方法。
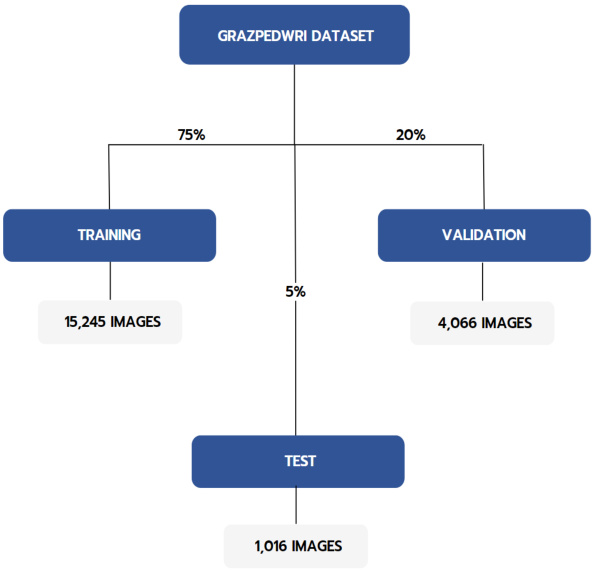
Figure 1: Dataset split into training, validation, and test sets.
图 1: 数据集划分为训练集、验证集和测试集。
3.2. Tools & Instruments
3.2. 工具与仪器
Python scripts were used to partition the dataset into training, validation, and testing sets. The deep learning framework PyTorch was used to train object detection models. To visualize, track, and compare model training, we employed the Weights and Biases (WANDB) platform. To take advantage of our system’s graphical processing units (GPUs), we utilized CUDA and cuDNN. All training was performed on a Windows PC equipped with an NVIDIA GeForce RTX 2080 SUPER (with 8,192 MB of video memory), an Intel(R) Xeon(R) W-2223 CPU $\textsuperscript{(0)}3.60\mathrm{GHz}$ processor, and 64GB of RAM. The Python version used was 3.9.13.
使用Python语言脚本将数据集划分为训练集、验证集和测试集。采用深度学习框架PyTorch训练目标检测模型。为可视化、追踪和比较模型训练过程,我们使用了Weights and Biases (WANDB)平台。为充分发挥系统图形处理器(GPU)性能,我们启用了CUDA和cuDNN加速库。所有训练均在配备NVIDIA GeForce RTX 2080 SUPER显卡(8,192 MB显存)、Intel(R) Xeon(R) W-2223 CPU $\textsuperscript{(0)}3.60\mathrm{GHz}$处理器及64GB内存的Windows PC上完成,运行环境为Python语言3.9.13版本。
3.3. Deep Learning Models For Object Detection
3.3. 目标检测深度学习模型
In this study, we employed 4 single-stage detection models, namely YOLOv5, YOLOv6, YOLOv7, and YOLOv8, as well as a two-stage detection model Faster R-CNN. To further optimize the performance of the single-stage models, we experimented with multiple variants of each YOLO model, ranging from 5 to 7 variants. This resulted in a total of 23 wrist abnormality detection procedures.
在本研究中,我们采用了4种单阶段检测模型(YOLOv5、YOLOv6、YOLOv7和YOLOv8)以及一个两阶段检测模型Faster R-CNN。为了进一步优化单阶段模型的性能,我们对每个YOLO模型进行了5至7种变体的实验,最终共构建了23种腕部异常检测流程。
The YOLO (You Only Look Once) algorithm, initially introduced by Redmon, Divvala, Girshick and Farhadi (2015) in 2015, is a single-stage object detection approach that uses a single pass of a convolutional neural network to make predictions about the locations of objects in an image, making it faster than other approaches to date. In 2021, YOLOv4 achieved the highest mean average precision on the MS COCO dataset while also being the fastest realtime object detection algorithm Boc hk ovsk iy et al. (2020). Since its initial release, the algorithm has undergone several improvements, with versions ranging from v1 to v8, with each subsequent version offering smaller volume, higher speed, and higher precision. Fig. 2 illustrates the general structure of YOLO with various backbones used in this study such as CSP, VGG, and EELAN.
YOLO (You Only Look Once) 算法最初由Redmon、Divvala、Girshick和Farhadi于2015年提出[20],是一种单阶段目标检测方法,通过单次卷积神经网络前向传播即可预测图像中物体的位置,使其成为当时速度最快的算法。2021年,YOLOv4在MS COCO数据集上实现了最高的平均精度(mAP),同时保持实时检测速度(Bochkovskiy et al., 2020)。该算法自发布以来经历了多次迭代,版本从v1演进至v8,每个后续版本都实现了更小体积、更快速度和更高精度。图2展示了本研究采用的YOLO通用结构,包括CSP、VGG和EELAN等多种骨干网络。

Figure 2: YOLO Architecture depicting the input, backbone, neck, head, and the output.
图 2: YOLO架构示意图,展示输入( input )、骨干网络( backbone )、颈部网络( neck )、头部网络( head )及输出( output )结构。
3.3.1. The YOLOv5 Model
3.3.1. YOLOv5模型
The YOLO framework comprises of three components: the backbone, neck, and head. The backbone extracts image features using the CSPDarknet architecture, known for its superior performance Wang, Liao, Wu, Chen, Hsieh and Yeh (2020). We adopted the same architecture in our research. CSPDarknet involves convolution, pooling, and residual connections represented as:
YOLO框架由三部分组成:骨干网络(backbone)、颈部(neck)和头部(head)。骨干网络采用CSPDarknet架构提取图像特征,该架构以卓越性能著称[20]。我们在研究中采用了相同的架构。CSPDarknet包含卷积、池化和残差连接,其数学表示如下:
$$
F_{i}=f(F_{i-1},W_{i})+F_{i-1}
$$
$$
F_{i}=f(F_{i-1},W_{i})+F_{i-1}
$$
(Where $F_{i}$ and $F_{i-1}$ are feature maps at $i$ -th and $(i\mathrm{-}1)$ - th layer respectively, $W_{i}$ represents weights and biases, and $f(\cdot)$ applies convolution and pooling operations). The SPP structure is then used to extract multi-scale features from the CSPDarknet’s output:
(其中 $F_{i}$ 和 $F_{i-1}$ 分别表示第 $i$ 层和第 $(i\mathrm{-}1)$ 层的特征图, $W_{i}$ 代表权重和偏置, $f(\cdot)$ 执行卷积和池化操作)。随后通过SPP结构从CSPDarknet的输出中提取多尺度特征:
$$
F_{S P P}=g(F_{i})
$$
$$
F_{S P P}=g(F_{i})
$$
(Where $F_{S P P}$ denotes multi-scale feature maps, and $g(\cdot)$ performs the SPP operation on $F_{i}$ ). The neck component adopts the Path Aggregation Network (PANet) to aggregate backbone features, generating higher-level features for output layers. The head constructs output vectors containing class probabilities, objectness scores, and bounding box coordinates. YOLOv5 encompasses five model variants ("n", "s", $"\mathrm{m"}$ , "l", and $"\mathbf{X}"$ ), which are compound-scaled versions of the same architecture. These variants offer varying detection accuracy and performance, achieved by adjusting network depth and layer count.
(其中 $F_{SPP}$ 表示多尺度特征图,$g(\cdot)$ 对 $F_{i}$ 执行SPP操作)。颈部组件采用路径聚合网络(PANet)来聚合骨干特征,为输出层生成更高层次的特征。头部构建包含类别概率、目标性得分和边界框坐标的输出向量。YOLOv5包含五种模型变体("n"、"s"、"m"、"l"和"x"),它们是同一架构的复合缩放版本。这些变体通过调整网络深度和层数,提供了不同的检测精度和性能。
3.3.2. The YOLOv6 Model
3.3.2. YOLOv6模型
YOLOv6 features an anchor-free design and reparameterized Backbone, with VGG and CSP Backbones used in the "n" and "s" variants, and "m", "l" and "l6" variants respectively. This Backbone is referred to as Efficient Rep. The Neck, named Rep-PAN, is similar to YOLOv5, but the Head is efficiently decoupled, improving accuracy and reducing computation by not sharing parameters between the classification and detection branches. The YOLOv6 includes five model variants ("n", "s", "m", "l", and "l6").
YOLOv6采用无锚点设计和重参数化Backbone,其中"n"和"s"变体使用VGG与CSP Backbone,"m"、"l"及"l6"变体则分别采用不同结构。该Backbone被称为Efficient Rep。其Neck模块Rep-PAN与YOLOv5类似,但Head采用高效解耦设计,通过分离分类与检测分支参数来提升精度并降低计算量。YOLOv6共包含五种模型变体 ("n", "s", "m", "l", "l6")。
3.3.3. The YOLOv7 Model
3.3.3. YOLOv7模型
YOLOv7 comes with several changes, including EELAN, which uses expand, shuffle, and merge cardinality to improve network learning without disrupting the gradient path. Other changes include Model Scaling techniques, Reparameter iz ation planning, and Auxiliary Head Coarse-toFine. Model scaling adjusts the width, depth, and resolution of a model to align with specific application requirements. YOLOv7 uses compound scaling to simultaneously scale network depth and width by concatenating layers, maintaining optimal architecture while scaling.
YOLOv7带来多项改进,包括采用扩展、洗牌与合并基数操作的EELAN结构 (在不破坏梯度路径的前提下提升网络学习能力) 。其他创新包含模型缩放 (Model Scaling) 技术、重参数化规划 (Reparameterization planning) 以及由粗到精的辅助头设计 (Auxiliary Head Coarse-to-Fine) 。模型缩放通过调整宽度、深度和分辨率使模型适配具体应用需求。YOLOv7采用复合缩放策略,通过层连接同步扩展网络深度与宽度,在缩放时保持最优架构。
Re-parameter iz ation techniques use gradient flow propagation to identify modules that require averaging weights for robustness. An auxiliary head in the middle of the network improves training but requires a coarse-to-fine approach for efficient supervision. The YOLOv7 model consists of seven variants: "P5" models (v7, v7x, and v7-tiny) and "P6" models (d6, e6, w6, and e6e).
重参数化技术利用梯度流传播来识别需要平均权重以提高鲁棒性的模块。网络中间的辅助头能提升训练效果,但需要采用由粗到细的方法进行高效监督。YOLOv7模型包含七个变体:"P5"系列模型(v7、v7x和v7-tiny)和"P6"系列模型(d6、e6、w6和e6e)。
3.3.4. The YOLOv8 Model
3.3.4. YOLOv8模型
YOLOv8 is reported to provide significant advancements in object detection when compared to previous YOLO models, particularly in compact versions that are implemented on less powerful hardware. At the time of writing this paper, the architecture of YOLOv8 is not fully disclosed and some of its features are still under development. As of now, it’s been confirmed that the system has a new backbone, uses an anchor-free design, has a revamped detection head, and has a newly implemented loss function. We have included the performance of this model on the GRAZPEDWRI-DX dataset as a benchmark for future studies, as further improvements to YOLOv8 may surpass the results obtained in this study. YOLOv8 comes in five versions at the time of release (January 10, 2023), namely, "n", "s", "m", "l", and "x".
据报道,YOLOv8相比之前的YOLO模型在目标检测方面取得了显著进步,尤其是在算力较低的硬件上运行的紧凑版本中。撰写本文时,YOLOv8的架构尚未完全公开,部分功能仍在开发中。目前已确认该系统具有新主干网络、采用无锚点(anchor-free)设计、改进了检测头并实现了新的损失函数。我们将该模型在GRAZPEDWRI-DX数据集上的性能作为未来研究的基准,因为YOLOv8的进一步改进可能会超越本研究的结果。截至发布时(2023年1月10日),YOLOv8共推出"n"、"s"、"m"、"l"和"x"五个版本。
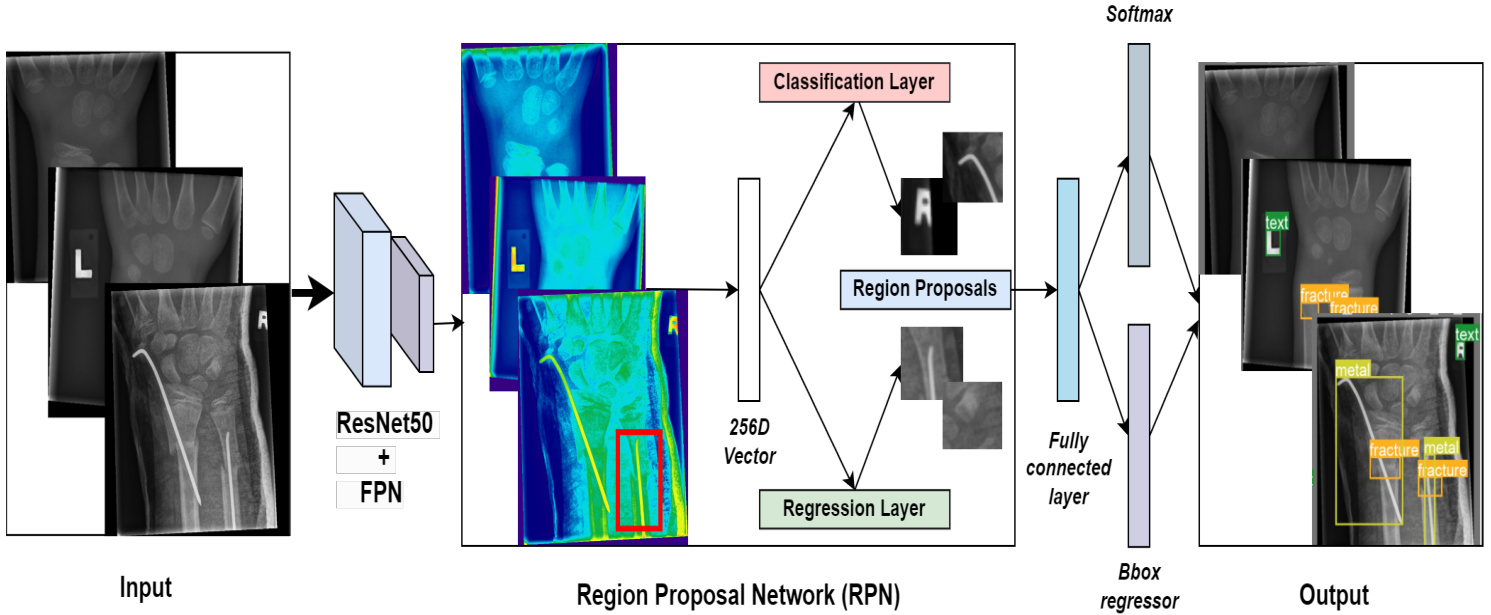
Figure 3: Faster R-CNN Pipeline.
图 3: Faster R-CNN 流程。
3.3.5. Faster R-CNN
3.3.5. Faster R-CNN
The Faster R-CNN model includes a backbone, an RPN (regional proposal network), and a detection network. ResNet50 with FPN is used as the backbone for feature extraction. Anchors with variable sizes and aspect ratios are generated for each feature. The RPN selects appropriate anchor boxes using a classifier that predicts if an anchor box contains an object based on an IoU threshold of 0.5. The regressor predicts offsets for anchor boxes containing objects to fit them tightly to the ground truth labels. Finally, the RoI pooling layer converts variable-sized proposals to a fixed size to run a classifier and regress a bounding box. Fig. 3 illustrates the architecture of Faster R-CNN.
Faster R-CNN模型包含主干网络、区域提议网络(RPN)和检测网络三部分。采用带有特征金字塔网络(FPN)的ResNet50作为特征提取主干。每个特征图会生成不同尺寸和长宽比的锚框(anchor),RPN通过分类器(以0.5交并比(IoU)阈值判断锚框是否包含物体)筛选合适锚框,回归器则对含物体的锚框预测偏移量以贴合真实标注。最后通过兴趣区域(RoI)池化层将可变尺寸的提议框转为固定尺寸,用于执行分类和边界框回归。图3展示了Faster R-CNN的架构。
3.4. Training Details
3.4. 训练细节
In the experimentation of YOLO variants, standard hyper parameters were utilized. The input resolution was fixed at 640 pixels. The optimization algorithm employed was SGD with an initial learning rate $\alpha=1\times10^{-2}$ , final learning rate $\alpha_{f}~=~1\times10^{-2}$ (except for YOLOv7 variants with a final learning rate $\alpha_{f}~=~1\times10^{-1}.$ ), momentum $=0.937$ , weight decay $=5\times10^{-4}$ . Each variant/model underwent 100 epochs of training from scratch and was observed to converge between 90-100 epochs. Every variant was trained with a batch size of 16 except for the $"\mathbf{P}6"$ variants of YOLOv7 namely (d6, e6, w6, e6e) which were trained with a batch size of 8 due to computational constraints.
在YOLO变体的实验中,采用了标准超参数。输入分辨率固定为640像素。使用的优化算法为SGD (随机梯度下降),初始学习率 $\alpha=1\times10^{-2}$,最终学习率 $\alpha_{f}~=~1\times10^{-2}$(YOLOv7变体除外,其最终学习率为 $\alpha_{f}~=~1\times10^{-1}.$),动量 $=0.937$,权重衰减 $=5\times10^{-4}$。每个变体/模型均从头开始训练100个epoch,并观察到在90-100个epoch之间收敛。除YOLOv7的$"\mathbf{P}6"$变体(即d6、e6、w6、e6e)由于计算限制采用批量大小8外,其余变体均以批量大小16进行训练。
With Faster R-CNN, the only difference was the learning rate of $\alpha=1\times10^{-3}$ , momentum of 0.9 and weight decay of $5\times10^{-4}$ . All other parameters were the same as YOLO variants. As with YOLO models, the selection of these parameters is not deliberate, they are the default settings.
使用Faster R-CNN时,唯一区别是学习率为$\alpha=1\times10^{-3}$、动量为0.9且权重衰减为$5\times10^{-4}$。其余参数均与YOLO变体相同。与YOLO模型一样,这些参数的选择并非刻意为之,均为默认设置。
All binary class if i ers were trained for a maximum of 100 epochs using a batch size of 64. The learning rate was set at $1\times10^{-3}$ . The Adam optimization algorithm guided the training process. Input images were standardized to a resolution of 224 pixels.
所有二分类器均以64的批次大小训练最多100个周期,学习率设定为$1\times10^{-3}$,训练过程采用Adam优化算法。输入图像统一标准化为224像素分辨率。
3.5. Evaluation Metrics: mAP
3.5. 评估指标: mAP
For the evaluation of object detection, a common way to determine if the predicted location of an object was correct is to find in Intersection over Union $(I o U)$ . It is defined as the ratio of the intersection of the predicted and the ground truth bounding box over the union of the predicted and ground truth bounding box. A visual illustration of $I o U$ is presented in Fig. 4. Given the set of predicted bounding boxes $A$ for a given image, and the set of ground truth bounding boxes $B$ for the same image. The IoU can be computed as:
在目标检测的评估中,判断物体预测位置是否正确的一种常见方法是计算交并比 $(IoU)$。其定义为预测边界框与真实边界框的交集面积除以它们的并集面积。图 4 展示了 $IoU$ 的直观图示。给定图像的一组预测边界框 $A$ 和同一图像的真实边界框集合 $B$,IoU 的计算公式为:
$$
I o U(A,B)={\frac{A\cap B}{A\cup B}};\qquad{\mathrm{where~}}A,B\in[0,1]
$$
$$
I o U(A,B)={\frac{A\cap B}{A\cup B}};\qquad{\mathrm{where~}}A,B\in[0,1]
$$
Commonly, if the $I o U>0.5$ , we classify the detection as true positive, otherwise, it is classified as false positive. Given IoU, we can compute the number of true positives $T P$ and false positives $F P$ and compute the Average precision $A P$ for each object class $c$ as follows:
通常,如果 $I o U>0.5$,我们将检测结果分类为真阳性 (true positive),否则归类为假阳性 (false positive)。给定 IoU,我们可以计算真阳性数量 $T P$ 和假阳性数量 $F P$,并按以下方式计算每个物体类别 $c$ 的平均精度 (Average precision) $A P$:
$$
A P(c)={\frac{T P(c)}{T P(c)+F P(c)}}
$$
$$
A P(c)={\frac{T P(c)}{T P(c)+F P(c)}}
$$
Finally, after computing $A P$ for each object class, we compute the Mean Average Precision $m A P$ which is an average of $A P$ across all classes $C$ under consideration. $m A P$ is given
最后,在计算每个对象类别的 $AP$ 后,我们计算平均精度均值 $mAP$ ,即所有考虑类别 $C$ 的 $AP$ 平均值。$mAP$ 的表达式为
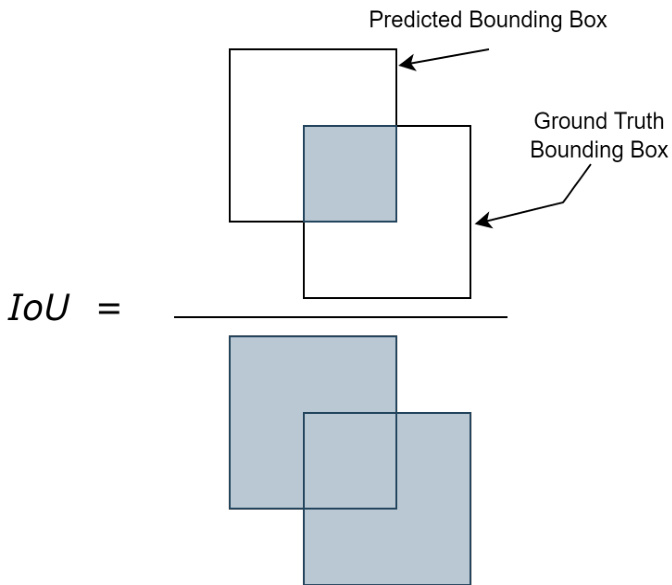
Figure 4: Visual illustration of Intersection over Union $(I o U)$ .
图 4: 交并比 (Intersection over Union, IoU) 的视觉示意图。
as:
as:
$$
m A P={\frac{1}{C}}\sum_{c=1}^{C}A P(c)
$$
$$
m A P={\frac{1}{C}}\sum_{c=1}^{C}A P(c)
$$
$m A P$ is the metric that quantifies the performance of object detection algorithms. Thus, the metric $m A P_{0.5}$ indicates $m A P$ for $I o U>0.5$ . This is the $I o U$ threshold we will be using to make our assessments of the detection models.
$mAP$ 是量化目标检测算法性能的指标。因此,指标 $mAP_{0.5}$ 表示 $IoU>0.5$ 时的 $mAP$。这是我们用于评估检测模型的 $IoU$ 阈值。
3.5.1. Sensitivity
3.5.1. 敏感性
Sensitivity, in the context of our model, pertains to its capacity to accurately recognize true detections among all positive detections within the dataset. Specifically, it gauges the model’s ability to correctly identify the presence of a fracture or abnormality. We prioritize this metric due to the potential consequences of false negatives in wrist trauma cases. Failure to detect fractures is a frequent reason for differences in diagnosis between the initial interpretation of X-ray images and the final analysis conducted by certified radiologists. The calculation for sensitivity is as follows:
在我们模型的背景下,敏感度 (sensitivity) 指的是模型在数据集中所有阳性检测中准确识别真实检测的能力。具体而言,它衡量了模型正确识别骨折或异常情况的能力。我们优先考虑这一指标,因为在手腕创伤病例中假阴性可能带来严重后果。未能检测出骨折是X光片初步解读与认证放射科医师最终分析之间出现诊断差异的常见原因。敏感度的计算公式如下:
$$
\mathrm{Sensitivity}={\frac{\mathrm{True Positives}}{\mathrm{True Positives}+\mathrm{False~Negatives}}}
$$
$$
\mathrm{Sensitivity}={\frac{\mathrm{True Positives}}{\mathrm{True Positives}+\mathrm{False~Negatives}}}
$$
4. Dataset
4. 数据集
The dataset used in this study is called GRAZPEDWRIDX for machine learning presented by the authors in Nagy et al. (2022) and is publicly made available to encourage computer vision research. The dataset contains pediatric wrist radiograph images in PNG format of 6,091 patients (mean age 10.9 years, range 0.2 to 19 years; 2,688 females, 3,402 males, 1 unknown), treated at the Division of Paediatric Radiology, Department of Radiology, Medical University of Graz, Austria. The dataset includes a total of 20,327 wrist images covering lateral and poster o anterior projections. The radio graphs were acquired over the span of 10 years between 2008 and 2018 and have been compre hens iv ely annotated between 2018 and 2020 by expert radiologists and various medical students. The annotations were validated by three experienced radiologists as the Xray images were annotated. This process was repeated until a consensus was met between the annotations and interpretations from three radiologists. We choose to use this dataset in our study for the following reasons:
本研究所用数据集名为GRAZPEDWRIDX,由Nagy等人(2022)提出用于机器学习研究,并公开共享以促进计算机视觉领域发展。该数据集包含6,091名儿科患者(平均年龄10.9岁,范围0.2-19岁;2,688名女性,3,402名男性,1名性别未知)的腕部X光PNG格式图像,这些患者均就诊于奥地利格拉茨医科大学放射科儿科放射学部门。数据集总计包含20,327张腕部图像,涵盖侧位和后前位投照体位。所有X光片拍摄于2008至2018年间,并在2018至2020年期间由专业放射科医师和多名医学生完成全面标注。标注过程中,三位资深放射科医师对每张X光片的标注结果进行验证,直至三位医师的标注与解读达成一致意见。本研究选用该数据集基于以下考量:
4.1. Analysis of Objects in the Dataset
4.1. 数据集中的对象分析
The dataset includes a total of 9 objects: periosteal reaction, fracture, metal, pronator sign, soft tissue, bone anomaly, bone lesion, foreign body, and text. The object "text" is present in all X-ray images and is used to identify the side of the body (right or left hand) on which the Xray was taken. The number of objects in the dataset is shown in Table 1. The table clearly indicates that the object "fracture" has the most common occurrence in wrist Xrays of GRAZPEDWRI-Dataset. The class "periosteal reaction" has the second largest occurrence followed by the third largest class "metal". Meanwhile, the classes "bone anomaly", "bone lesion", and "foreign body" have the lowest occurrence. Note that this table shows how many X-ray images contain a particular object and not the number of times an object is labeled in the dataset. Additionally, a histogram is shown in Fig. 5 visually shows the class distribution.
该数据集共包含9类对象:骨膜反应、骨折、金属物、旋前肌征、软组织、骨骼异常、骨病变、异物和文本。其中"文本"对象存在于所有X光片中,用于标识拍摄部位(右手或左手)。数据集中各类对象的数量如 表1 所示。该表清晰显示在GRAZPEDWRI数据集的腕部X光片中,"骨折"对象的出现频率最高,"骨膜反应"次之,第三位是"金属物"。而"骨骼异常"、"骨病变"和"异物"这三类的出现频率最低。需注意此表统计的是包含特定对象的X光片数量,而非数据集中该对象的标注总次数。此外,图5 所示的直方图直观展示了类别分布情况。
Table 1 Class Distribution
表 1: 类别分布
| 异常类型 | 实例数 | 比例 |
|---|---|---|
| Boneanomaly | 192 | 0.94% |
| Bonelesion | 42 | 0.21% |
| Foreignbody | 8 | 0.04% |
| Fracture | 13550 | 66.6% |
| Metal | 708 | 3.48% |
| Periostealreaction | 2235 | 11.0% |
| Pronatorsign | 566 | 2.78% |
| Softtissue | 439 | 2.16% |
In Table 2, we show the number of images in which a particular anomaly occurs only once, twice, or multiple times. The column "Total" represents the total number of images in which a particular anomaly is present.
在表2中,我们展示了特定异常仅出现一次、两次或多次的图像数量。"Total"列表示存在特定异常的图像总数。

Figure 5: Histogram of Class Distribution.
图 5: 类别分布直方图。
Table 2 Object Occurrences
表 2 物体出现次数
| 异常类型 | 零 | 一 | 二 | 更多 | 总计 |
|---|---|---|---|---|---|
| 骨折 | 6777 | 9212 | 4137 | 201 | 13550 |
| 骨骼异常 | 20135 | 42 | 24 | 126 | 192 |
| 骨损伤 | 20285 | 11 | 8 | 23 | 42 |
| 异物 | 20319 | 0 | 0 | 8 | 8 |
| 金属 | 19620 | 347 | 219 | 141 | 707 |
| 骨膜反应 | 18092 | 1273 | 885 | 77 | 2235 |
| 旋前肌征 | 19761 | 456 | 71 | 39 | 566 |
| 软组织 | 19888 | 221 | 82 | 136 | 439 |
5. Results & Discussion
5. 结果与讨论
This section presents a comprehensive analysis of the performance of various models for wrist abnormality detection on the GRAZPEDWRI-DX dataset. A total of 23 detec- tion procedures were conducted using different variants of each YOLO model and a two-stage detection model (Faster R-CNN) on a test set consisting of 1016 randomly selected samples. The performance of each model was evaluated using metrics such as precision, recall, and mean average precision (mAP). We begin by providing a detailed analysis of the variants within each YOLO model. Next, we select the best-performing variant from each YOLO model based on the highest mAP score obtained for the fracture class, as well as across all classes. Finally, we compare these variants to determine the overall best-performing model and evaluate its performance against Faster R-CNN.
本节全面分析了在GRAZPEDWRI-DX数据集上进行腕部异常检测时各模型的性能表现。我们在包含1016个随机样本的测试集上,使用不同版本的YOLO模型和两阶段检测模型(Faster R-CNN)共执行了23次检测流程,并通过精确率、召回率和平均精度均值(mAP)等指标评估各模型性能。首先详细分析各YOLO模型的变体版本,然后根据骨折类别及所有类别的最高mAP得分,从每个YOLO模型中选出最佳变体,最后将这些变体与Faster R-CNN进行对比以确定综合性能最优的模型。
The results of YOLOv5 variants are presented in Table 3 and 4, showing the performance of the variants across all classes and on the fracture class, respectively. All values are rounded to two decimal places. The results show that the fractures were detected with the highest mAP of 0.95 at IoU $=0.5$ , with a precision of 0.92, and a recall of 0.90 by the YOLOv5 variant, YOLOv5l. Additionally, the performance of YOLOv5l appears to be satisfactory across all classes with the mAP score of 0.68 at $\mathrm{IoU}=0.5$ . The variant YOLOv5x seems to perform just as well in terms of mAP obtained for the fracture class. In terms of overall performance across all classes, the highest mAP score achieved was 0.69 by the two YOLOv5 variants $"\mathrm{m"}$ and $"\mathbf{X}"$ . The highest precision obtained across all classes is 0.80 by the variant $"\mathrm{m"}$ , while the highest recall achieved was 0.66 by the variant "s". It can also be observed from the results shown in Table 4 that as the complexity of the architecture in YOLOv5 increases, its performance improves.
YOLOv5各变体的结果如表3和表4所示,分别展示了所有类别及骨折类别的性能表现。所有数值均保留两位小数。结果显示,YOLOv5l变体在IoU $=0.5$ 时以0.95的最高mAP检测到骨折,精确度为0.92,召回率为0.90。此外,YOLOv5l在所有类别中的表现也令人满意,在 $\mathrm{IoU}=0.5$ 时mAP得分为0.68。YOLOv5x变体在骨折类别的mAP表现同样出色。就所有类别的整体性能而言,两个YOLOv5变体 $"\mathrm{m"}$ 和 $"\mathbf{X}"$ 取得了0.69的最高mAP得分。变体 $"\mathrm{m"}$ 在所有类别中获得了0.80的最高精确度,而变体"s"则实现了0.66的最高召回率。从表4所示结果还可以观察到,随着YOLOv5架构复杂度的增加,其性能也有所提升。
Table 3 YOLOv5 Results (Across All Classes)
表 3 YOLOv5 结果 (所有类别)
| 模型变体 | 精确率 (Precision) | 召回率 (Recall) | mAP@0.5 | mAP@0.5:0.95 |
|---|---|---|---|---|
| YOLOv5n | 0.77 | 0.52 | 0.59 | 0.34 |
| YOLOv5s | 0.75 | 0.66 | 0.65 | 0.38 |
| YOLOv5m | 0.80 | 0.62 | 0.69 | 0.44 |
| YOLOv5l | 0.76 | 0.61 | 0.68 | 0.43 |
| YOLOv5x | 0.73 | 0.64 | 0.69 | 0.45 |
Table 4 YOLOv5 Results (Fracture Class)
表 4 YOLOv5 结果(骨折类别)
| 模型变体 | 精确率 | 召回率 | mAP@0.5 | mAP@0.5:0.95 |
|---|---|---|---|---|
| YOLOv5n | 0.87 | 0.91 | 0.94 | 0.54 |
| YOLOv5s | 0.89 | 0.91 | 0.95 | 0.56 |
| YOLOv5m | 0.91 | 0.90 | 0.94 | 0.56 |
| YOLOv5l | 0.92 | 0.90 | 0.95 | 0.57 |
| YOLOv5x | 0.91 | 0.90 | 0.95 | 0.57 |
Table 5 displays the mAP scores of all YOLOv5 variants at an IoU threshold of 0.5 for all classes present in the GRAZPEDWRI-DX dataset. It is worth noting that these mAP scores are particularly significant as they are calculated at an IoU threshold of 0.5, which is a commonly used threshold in object detection evaluations. These scores are crucial indicators of the performance of the YOLOv5 variants on the GRAZPEDWRI-DX dataset and provide valuable insights into their abilities to detect objects within the various classes present in the GRAZPEDWRI-DX dataset. Upon examination of the Table 5, it can be seen that almost all variants of YOLOv5 demonstrate the capability to detect classes that are in the minority, such as bone anomaly, bone lesion, and foreign body, with considerably good mAP scores as seen in Table 5. For instance, despite the limited number of instances of the class "Bonelesion" (only 42, as shown in Table 1), the four variants of YOLOv5 ("s", "m," "l," and ${}^{"}\mathbf{X}^{"})$ are able to correctly detect it in all instances where it occurs, with the mAP score of 1.00.
表 5 展示了所有 YOLOv5 变体在 GRAZPEDWRI-DX 数据集中所有类别上 IoU (Intersection over Union) 阈值为 0.5 时的 mAP (mean Average Precision) 分数。值得注意的是,这些 mAP 分数尤为重要,因为它们是基于目标检测评估中常用的 0.5 IoU 阈值计算的。这些分数是衡量 YOLOv5 变体在 GRAZPEDWRI-DX 数据集上性能的关键指标,并为了解它们检测该数据集中各类别目标的能力提供了宝贵参考。通过观察表 5 可以发现,几乎所有 YOLOv5 变体都展现出检测少数类别(如骨骼异常、骨病变和异物)的能力,并取得了相当不错的 mAP 分数。例如,尽管"Bonelesion"类别的实例数量有限(仅 42 个,如表 1 所示),但 YOLOv5 的四个变体("s"、"m"、"l"和 ${}^{"}\mathbf{X}^{"})$ 都能在所有出现该类别的情况下正确检测到它,并获得了 1.00 的 mAP 分数。
Table 6 and 7 present the results of YOLOv6 variants, showcasing their performance on all classes and the fracture class, respectively. Variants "n", "s", and "m" achieved the highest mAP of 0.94 at an IoU threshold of 0.5 for detecting fractures. Variants "n", "m", and "l" displayed the highest precision for the fracture class with a value of 0.94, while variant "s" had the highest recall of 0.89. In terms of overall performance across all classes, the highest mAP score of 0.64 at an IoU threshold of 0.5 was obtained by variants "m" and "l", with variant "l" achieving the highest precision of 0.60 and variant "m" having the highest recall of 0.83.
表 6 和表 7 展示了 YOLOv6 各变体的结果,分别呈现了它们在所有类别和骨折类别上的性能表现。在检测骨折时,变体 "n"、"s" 和 "m" 在 IoU 阈值为 0.5 的情况下取得了最高的 mAP 值 0.94。对于骨折类别,变体 "n"、"m" 和 "l" 显示出最高的精确度 0.94,而变体 "s" 的召回率最高,达到 0.89。在所有类别的整体性能方面,变体 "m" 和 "l" 在 IoU 阈值为 0.5 时获得了最高的 mAP 分数 0.64,其中变体 "l" 实现了最高的精确度 0.60,变体 "m" 的召回率最高,为 0.83。

Figure 6: Performance analysis curves $({\mathsf{Y O L O v}}8{\mathsf{x}})$
图 6: 性能分析曲线 $({\mathsf{Y O L O v}}8{\mathsf{x}})$
Table 5 YOLOv5 mAP@0.5 Scores (For All Classes)
表 5 YOLOv5 mAP@0.5 分数 (所有类别)
| 模型变体 | 骨骼异常 | 骨病变 | 异物 | 骨折 | 金属 | 骨膜反应 | 旋前征 | 软组织 | 文本 |
|---|---|---|---|---|---|---|---|---|---|
| YOLOv5n | 0.31 | 0.57 | 0.00 | 0.94 | 0.88 | 0.66 | 0.74 | 0.21 | 0.99 |
| YOLOv5s | 0.31 | 1.00 | 0.00 | 0.95 | 0.91 | 0.75 | 0.74 | 0.25 | 0.99 |
| YOLOv5m | 0.33 | 1.00 | 0.33 | 0.94 | 0.92 | 0.69 | 0.75 | 0.25 | 0.99 |
| YOLOv5l | 0.34 | 1.00 | 0.25 | 0.95 | 0.90 | 0.71 | 0.75 | 0.19 | 0.99 |
| YOLOv5x | 0.37 | 1.00 | 0.33 | 0.95 | 0.92 | 0.71 | 0.77 | 0.19 | 0.99 |
Table 8 illustrates that YOLOv6 variants, similar to YOLOv5 variants, exhibit the ability to detect minority classes. However, Table 7 reveals that, unlike YOLOv5, as the complexity of the model increases from variant "m" to "l" and then to $"16"$ , the mAP score decreases, indicating that complexity beyond variant "m" results in decreased performance. This trend is also observed in Table 6, where increasing complexity from variant "l" to $"16"$ results in decreased performance across all classes.
表 8 表明,与 YOLOv5 变体类似,YOLOv6 变体也具备检测少数类别的能力。然而,表 7 显示,不同于 YOLOv5,当模型复杂度从变体 "m" 提升至 "l" 再到 $"16"$ 时,mAP 分数反而下降,说明超过 "m" 变体的复杂度会导致性能降低。这一趋势在表 6 中同样可见:当复杂度从变体 "l" 增至 $"16"$ 时,所有类别的性能均出现下降。
The performance of YOLOv7 variants on both across classes and the fracture class is presented in Tables 9 and 10, respectively. The results indicate that the second variant of the YOLOv7 model exhibits the highest mean average precision (mAP) of 0.94 at an intersection over union (IoU) threshold of 0.5, with a precision of 0.86 and recall of 0.91 for detecting fractures. This variant also demonstrates superior performance across all classes with a mAP of 0.61 at an IoU of 0.5, a precision of 0.79, and a recall of 0.54. The variant YOLOv7x seems to perform just as well in terms of mAP obtained for the fracture class but has a lower mAP score compared to the second variant across all classes. Additionally, it can be observed from our experiments that, in contrast to YOLO5, increasing the complexity of the YOLOv7 architecture, in terms of depth and number of layers, hurts its performance in detecting wrist abnormalities. The only exception to this trend is the increase in performance observed when comparing the smaller variant "YOLOv7-Tiny" to the slightly larger variant " $"\mathrm{YOLOv}7"$ . The "YOLOv7-Tiny" achieved mAP of 0.5 at $\mathrm{IoU=0.5}$ , but the "YOLOv7" variant showed an improvement of 0.11 across all classes. Additionally, when focusing on the specific class of fractures, an improvement of 0.01 in the mAP score was observed, suggesting that there is an optimal balance of complexity and performance for this model. The decline in performance for YOLOv7’s "P6" models, specifically "W6", "E6", "D6", and "E6E", compared to the "P5" models may be attributed to the reduced image resolution. However, the results across all classes indicate that even with this resolution, the performance of "P6" models either decreases or does not improve at all.
YOLOv7各变体在所有类别和骨折类别上的性能分别如表9和表10所示。结果表明,YOLOv7模型的第二个变体在交并比(IoU)阈值为0.5时表现出最高的平均精度(mAP)0.94,其骨折检测的精确率为0.86,召回率为0.91。该变体在所有类别中也展现出优越性能,在IoU为0.5时mAP达0.61,精确率0.79,召回率0.54。YOLOv7x变体在骨折类别的mAP表现相当,但在所有类别上的mAP分数低于第二个变体。实验还发现,与YOLO5不同,增加YOLOv7架构的深度和层数会降低其腕部异常检测性能。唯一例外是较小变体"YOLOv7-Tiny"与稍大变体"YOLOv7"对比时出现的性能提升:前者在IoU=0.5时mAP为0.5,而后者在所有类别上提升了0.11;针对骨折类别,mAP分数也有0.01的提升,表明该模型存在复杂度与性能的最佳平衡点。YOLOv7的"P6"模型("W6"、"E6"、"D6"和"E6E")相比"P5"模型性能下降可能源于图像分辨率降低,但所有类别的结果显示即使保持该分辨率,"P6"模型性能要么下降要么毫无提升。
Table 6 YOLOv6 Results (Across All Classes)
表 6: YOLOv6 结果 (所有类别)
| 模型变体 | 精确率 (Precision) | 召回率 (Recall) | mAP@0.5 | mAP@0.5:0.95 |
|---|---|---|---|---|
| YOLOv6n | 0.50 | 0.73 | 0.51 | 0.31 |
| YOLOv6s | 0.51 | 0.82 | 0.62 | 0.37 |
| YOLOv6m | 0.59 | 0.83 | 0.64 | 0.36 |
| YOLOv6l | 0.60 | 0.80 | 0.64 | 0.41 |
| YOLOv6l6 | 0.49 | 0.77 | 0.52 | 0.31 |
Table 7 YOLOv6 Results (Fracture Class)
表 7 YOLOv6 结果(骨折类别)
| 模型变体 | 精确率 | 召回率 | mAP@0.5 | mAP@0.5:0.95 |
|---|---|---|---|---|
| YOLOv6n | 0.94 | 0.86 | 0.94 | 0.55 |
| YOLOv6s | 0.92 | 0.89 | 0.94 | 0.54 |
| YOLOv6m | 0.94 | 0.87 | 0.94 | 0.55 |
| YOLOv6l | 0.94 | 0.87 | 0.93 | 0.53 |
| YOLOv6l6 | 0.91 | 0.86 | 0.92 | 0.53 |
It is worth noting that rare classes such as bone anomaly, bone lesion, and foreign body have a very low mAP score and are sometimes not detected at all, as shown in Table 11. However, the second variant of YOLOv7 is the only variant able to detect all the minority classes such as "bone anomaly", "bone lesion", and "foreign body".
值得注意的是,如表 11 所示,骨骼异常 (bone anomaly)、骨骼病变 (bone lesion) 和异物 (foreign body) 等罕见类别的 mAP 分数非常低,有时甚至完全无法检测到。然而,YOLOv7 的第二个变体是唯一能够检测所有少数类别(如"骨骼异常"、"骨骼病变"和"异物")的变体。
Tables 12 and 13 show the performance of YOLOv8 model variants across all classes and on the fracture class, respectively. The YOLOv8 variant $"\mathrm{YOLOv8x"}$ achieved the highest mAP of 0.95 for fracture detection at an IoU threshold of 0.5, with a precision of 0.91 and a recall of 0.89. Additionally, it demonstrated superior overall performance across all classes with a mAP of 0.77 at an IoU threshold of 0.5. Table 14 also shows that all YOLOv8 variants demonstrated good performance in detecting all classes, including minority classes, except the "foreign body" class not being detected by the small and the medium variants. The results suggest that using compound-scaled variants of the YOLOv8 architecture generally improves performance, except for a decrease in mAP scores across all classes when moving from the variant "s" to a medium variant $"\mathrm{m"}$ , with a decrease of 0.09 in Table 13.
表 12 和表 13 分别展示了 YOLOv8 模型变体在所有类别及骨折(fracture)类别上的性能表现。YOLOv8x 变体在 IoU 阈值为 0.5 时取得了骨折检测的最高 mAP 值 0.95(精确率 0.91,召回率 0.89)。此外,该变体在所有类别上也展现出最优的综合性能(IoU=0.5 时 mAP 0.77)。表 14 同时表明,除小(s)型和中(m)型变体未能检测"异物(foreign body)"类外,所有 YOLOv8 变体在检测包括少数类在内的全部类别时均表现良好。结果显示,采用复合缩放(compound-scaled)的 YOLOv8 架构变体通常能提升性能,但从 s 型变体升级到 m 型变体时会出现 mAP 下降(表 13 中降低 0.09)。

Figure 7: Confusion Matrix $({\mathsf{Y O L O v}}8{\mathsf{x}})$ .
图 7: 混淆矩阵 $({\mathsf{Y O L O v}}8{\mathsf{x}})$ 。
The results of the experimental evaluation using the two-stage detector Faster R-CNN are presented in Table 15. The table shows the mean Average Precision (mAP) scores obtained for each class individually as well as the overall mAP across all classes. The results indicate that all variants of the YOLO model outperform Faster R-CNN by a significant margin. This is supported by the fact that the mean mAP score of every YOLO variant was found to be higher than that of Faster R-CNN, both for fracture detection and overall performance across all classes. These findings suggest that the single-stage detection algorithm, YOLO, is a more effective model for this task. Moreover, Faster R-CNN does not seem to exhibit the ability to detect the classes in minority such as "bone anomaly", "bone lesion", and "foreign body".
使用两阶段检测器Faster R-CNN的实验评估结果如表15所示。该表展示了每个类别单独获得的平均精度均值(mAP)分数以及所有类别的总体mAP。结果表明,所有YOLO模型变体的性能都显著优于Faster R-CNN。这一结论得到以下事实的支持:无论是骨折检测还是所有类别的整体性能,每个YOLO变体的平均mAP分数都高于Faster R-CNN。这些发现表明,单阶段检测算法YOLO是更适合本任务的模型。此外,Faster R-CNN似乎不具备检测少数类别(如"骨骼异常"、"骨病变"和"异物")的能力。
Figures 8 and 9 provide an overview of the mAP scores obtained for fracture class as well as across all classes by all YOLO variants and Faster R-CNN. In applications where false positives are costly, a model with high precision may be preferable, while in situations where missing detections are costly, a model with high recall may be more desirable. The mean Average Precision (mAP) serves as a comprehensive measure of the model’s performance. Therefore, we selected the best-performing variant within each YOLO model based on the highest mAP achieved for the fracture class and overall performance across all classes. We have also compared their mAP scores to each other as well as with that of the Faster R-CNN model, as illustrated in Table 16. We also evaluated the performance of all variants, including Faster R-CNN, on a challenging image containing multiple objects of interest, including 2 fractures, 3 periosteal reactions, 1 metal, and 1 text. The bounding box estimates for these objects from each variant and Faster R-CNN are illustrated in Fig. 10.
图8和图9展示了所有YOLO变体和Faster R-CNN在骨折类别及所有类别上获得的mAP分数概览。在误报成本较高的应用场景中,高精确率的模型更受青睐;而在漏检代价较高的情况下,高召回率的模型可能更为理想。平均精度均值(mAP)是衡量模型性能的综合指标。因此,我们根据各YOLO变体在骨折类别的最高mAP值及整体表现,筛选出每个YOLO模型中的最佳变体。如表16所示,我们将其mAP分数相互比较,并与Faster R-CNN模型进行对比。此外,我们还评估了所有变体(包括Faster R-CNN)在包含多个目标对象的挑战性图像上的表现,该图像包含2处骨折、3处骨膜反应、1个金属物体和1段文字。图10展示了各变体与Faster R-CNN对这些对象的边界框预测结果。
Table 8 YOLOv6 mAP@0.5 Scores (For All Classes)
表 8: YOLOv6 mAP@0.5 分数 (所有类别)
| 模型变体 | 骨骼异常 | 骨病变 | 异物 | 骨折 | 金属 | 骨膜反应 | 旋前征 | 软组织 | 文本 |
|---|---|---|---|---|---|---|---|---|---|
| YOLOv6n | 0.10 | 0.01 | 0.00 | 0.94 | 0.84 | 0.73 | 0.76 | 0.29 | 0.98 |
| YOLOv6s | 0.15 | 0.54 | 0.33 | 0.94 | 0.91 | 0.72 | 0.76 | 0.21 | 0.98 |
| YOLOv6m | 0.10 | 0.10 | 1.00 | 0.94 | 0.87 | 0.75 | 0.76 | 0.31 | 0.98 |
| YOLOv6l | 0.10 | 0.10 | 1.00 | 0.93 | 0.93 | 0.71 | 0.77 | 0.25 | 0.98 |
| YOLOv6l6 | 0.13 | 0.10 | 0.00 | 0.92 | 0.90 | 0.67 | 0.76 | 0.22 | 0.98 |
Table 9 YOLOv7 Results (Across All Classes)
表 9: YOLOv7 结果 (所有类别)
| 模型变体 | 精确率 (Precision) | 召回率 (Recall) | mAP@0.5 | mAP@0.5:0.95 |
|---|---|---|---|---|
| YOLOv7-Tiny | 0.59 | 0.52 | 0.50 | 0.28 |
| YOLOv7 | 0.79 | 0.54 | 0.61 | 0.39 |
| YOLOv7x | 0.68 | 0.49 | 0.53 | 0.32 |
| YOLOv7-W6 | 0.53 | 0.43 | 0.44 | 0.24 |
| YOLOv7-E6 | 0.56 | 0.38 | 0.40 | 0.21 |
| YOLOv7-D6 | 0.50 | 0.45 | 0.42 | 0.24 |
| YOLOv7-E6E | 0.75 | 0.45 | 0.44 | 0.25 |
Table 10 YOLOv7 Results (Fracture Class)
表 10 YOLOv7 结果(骨折类别)
| 模型变体 | 精确率 | 召回率 | mAP@0.5 | mAP@0.5:0.95 |
|---|---|---|---|---|
| YOLOv7-Tiny | 0.79 | 0.91 | 0.93 | 0.53 |
| YOLOv7 | 0.86 | 0.91 | 0.94 | 0.55 |
| YOLOv7x | 0.85 | 0.90 | 0.94 | 0.54 |
| YOLOv7-W6 | 0.72 | 0.89 | 0.90 | 0.50 |
| YOLOv7-E6 | 0.55 | 0.84 | 0.83 | 0.44 |
| YOLOv7-D6 | 0.62 | 0.89 | 0.89 | 0.49 |
| YOLOv7-E6E | 0.74 | 0.89 | 0.91 | 0.52 |
It is clear from Table 16 that the variant "YOLOv8x" of YOLOv8 is the best-performing variant out of all the variants employed in this study. The results presented in this study using the variant "YOLOv8x" represent a significant improvement upon the ones originally presented in Nagy et al. (2022) for the fracture class. In that paper, the model variant "YOLOv5m" trained on COCO weights achieved a mean average precision (mAP) score of 0.93 for fracture detection and an overall mAP score of 0.62 at an IoU threshold of 0.5. In contrast, the results obtained in this study demonstrate a higher mAP score of 0.95 for fracture detection and an overall mAP of 0.77 at an IoU threshold of 0.5. Fig. 6a, 6b, 6c, and 6d present the F1 versus Confidence, Recall versus Confidence, Precision versus Confidence, and Precision versus Recall curves, respectively, for the variant "YOLOv8x" across all classes. These curves provide a visual representation of the model’s performance on different confidence intervals and allow for a more thorough evaluation of its capabilities. The F1 versus Confidence curve shows the relationship between the model’s F1 score, which is a measure of the balance between precision and recall, and the confidence of its predictions. The Recall versus Confidence curve illustrates the model’s ability to correctly identify objects, while the Precision versus Confidence curve demonstrates the proportion of correct predictions made by the model. The Precision versus Recall curve shows the tradeoff between the model’s precision and recall, with higher precision typically corresponding to lower recall and vice versa. Additionally, a confusion matrix 7 is shown for the variant $"\mathrm{YOLOv8x"}$ .
从表16可以明显看出,YOLOv8的变体"YOLOv8x"是本研究中所有采用变体中性能最佳的。本研究使用"YOLOv8x"变体得到的结果,相比Nagy等人(2022)论文中针对骨折类别的原始结果有显著提升。在该论文中,基于COCO权重训练的"YOLOv5m"变体在IoU阈值为0.5时,骨折检测的平均精度(mAP)得分为0.93,总体mAP得分为0.62。相比之下,本研究结果显示在相同IoU阈值下,骨折检测mAP得分达到0.95,总体mAP为0.77。图6a、6b、6c和6d分别展示了"YOLOv8x"变体在所有类别上的F1分数-置信度、召回率-置信度、精确率-置信度以及精确率-召回率曲线。这些曲线直观呈现了模型在不同置信区间的表现,便于更全面地评估其能力。F1-置信度曲线显示了模型F1分数(衡量精确率与召回率平衡的指标)与预测置信度的关系;召回率-置信度曲线反映模型正确识别目标的能力;精确率-置信度曲线展示模型预测正确的比例;而精确率-召回率曲线则体现模型在这两个指标间的权衡关系——通常更高的精确率对应更低的召回率,反之亦然。此外,还展示了变体$"\mathrm{YOLOv8x"}$的混淆矩阵7。
Our study found that the relationship between the complexity of a YOLO model and its performance is not always linear. Our results on the GRAZPEDWRI-DX dataset revealed that the performance of YOLO models did not consistently improve with increasing complexity, except for YOLOv5 and YOLOv8.
我们的研究发现,YOLO模型的复杂度与其性能之间的关系并非总是线性的。在GRAZPEDWRI-DX数据集上的结果表明,除YOLOv5和YOLOv8外,YOLO模型的性能并未随着复杂度增加而持续提升。
6. Conclusion & Future Work
6. 结论与未来工作
In this study, we aimed to evaluate the performance of state-of-the-art single-stage detection models, specifically YOLOv5, YOLOv6, YOLOv7, and YOLOv8, in detecting wrist abnormalities and compare their performances against each other and the widely used two-stage detection model Faster R-CNN. Additionally, the analysis of the performance of all variants within each YOLO model was also provided. The evaluation was conducted using the recently released GRAZPEDWRI-DX Nagy et al. (2022) dataset, with a total of 23 detection procedures being carried out. The findings of our study demonstrated that YOLO models outperform the commonly used two-stage detection model, Faster R-CNN, in both fracture detection and across all classes present in the GRAZPEDWRI-DX dataset.
在本研究中,我们旨在评估最先进的单阶段检测模型(特别是YOLOv5、YOLOv6、YOLOv7和YOLOv8)在检测手腕异常方面的性能,并将其与广泛使用的两阶段检测模型Faster R-CNN进行对比。此外,还分析了每个YOLO模型所有变体的性能表现。评估使用了最新发布的GRAZPEDWRI-DX Nagy等人 (2022) 数据集,共进行了23项检测流程。我们的研究结果表明,在骨折检测和GRAZPEDWRI-DX数据集所有类别中,YOLO模型均优于常用的两阶段检测模型Faster R-CNN。
Furthermore, an analysis of YOLO models revealed that the YOLOv8 variant "YOLOv8x" achieved the highest mAP across all classes of wrist abnormalities in the GRAZPEDWRI-DX dataset, including the fracture class, at an IoU threshold of 0.5. We also discovered that the relationship between the complexity of a YOLO model, as measured by the use of compound-scaled variants within each YOLO model, and its performance is not always linear. Specifically, our analysis of the GRAZPEDWRI-DX dataset revealed that the performance of YOLO variants did not consistently improve with increasing complexity, except for YOLOv5 and YOLOv8. Some variants were successful in detecting minority classes while others were not. These results contribute to understanding the relationship between the complexity of YOLO models and their performance, which is important for guiding the development of future models. Our study highlights the potential of single-stage detection algorithms, specifically YOLOv5, YOLOv6, YOLOv7, and YOLOv8, for detecting wrist abnormalities in clinical settings. These algorithms are faster than their two-stage counterparts, making them more practical for emergencies commonly found in hospitals and clinics. Additionally, the study’s results indicate that single-stage detectors are highly accurate in detecting wrist abnormalities, making them a promising choice for clinical use.
此外,对YOLO模型的分析显示,在GRAZPEDWRI-DX数据集中,YOLOv8变体"YOLOv8x"以0.5的交并比(IoU)阈值在所有腕部异常类别(包括骨折类)上取得了最高平均精度(mAP)。我们还发现,YOLO模型的复杂度(通过各YOLO模型中复合缩放变体的使用来衡量)与其性能之间的关系并非总是线性的。具体而言,我们对GRAZPEDWRI-DX数据集的分析表明,除YOLOv5和YOLOv8外,YOLO变体的性能并未随复杂度提升而持续改善。某些变体能成功检测少数类别,而其他变体则未能实现。这些结果有助于理解YOLO模型复杂度与性能的关系,对指导未来模型开发具有重要意义。
本研究凸显了单阶段检测算法(特别是YOLOv5、YOLOv6、YOLOv7和YOLOv8)在临床环境中检测腕部异常的潜力。这些算法比两阶段检测器更快速,使其更适用于医院和诊所常见的紧急情况。此外,研究结果表明单阶段检测器在腕部异常检测中具有高精度,使其成为临床应用的理想选择。
Table 11 YOLOv7 mAP@0.5 Scores (For All Classes)
表 11 YOLOv7 mAP@0.5 分数 (所有类别)
| 模型变体 | 骨骼异常 | 骨病变 | 异物 | 骨折 | 金属 | 骨膜反应 | 旋前肌征 | 软组织 | 文本 |
|---|---|---|---|---|---|---|---|---|---|
| YOLOv7-Tiny | 0.13 | 0.00 | 0.00 | 0.93 | 0.88 | 0.69 | 0.69 | 0.14 | 0.99 |
| YOLOv7 | 0.20 | 0.33 | 0.33 | 0.94 | 0.95 | 0.76 | 0.71 | 0.25 | 0.99 |
| YOLOv7x | 0.17 | 0.10 | 0.00 | 0.94 | 0.90 | 0.72 | 0.70 | 0.24 | 0.99 |
| YOLOv7-W6 | 0.00 | 0.00 | 0.00 | 0.90 | 0.88 | 0.57 | 0.46 | 0.14 | 0.98 |
| YOLOv7-E6 | 0.00 | 0.00 | 0.00 | 0.83 | 0.81 | 0.42 | 0.40 | 0.11 | 0.98 |
| YOLOv7-D6 | 0.00 | 0.00 | 0.00 | 0.89 | 0.87 | 0.53 | 0.34 | 0.14 | 0.99 |
| YOLOv7-E6E | 0.01 | 0.00 | 0.00 | 0.91 | 0.88 | 0.60 | 0.43 | 0.12 | 0.99 |

Figure 8: mAP Scores (Across All Classes).
图 8: mAP (平均精度均值) 分数 (所有类别)。
Table 12 YOLOv8 Results (Across All Classes)
表 12 YOLOv8 结果 (所有类别)
| 模型变体 | 精确率 (Precision) | 召回率 (Recall) | mAP@0.5 | mAP@0.5:0.95 |
|---|---|---|---|---|
| YOLOv8n | 0.73 | 0.58 | 0.59 | 0.36 |
| YOLOv8s | 0.72 | 0.63 | 0.65 | 0.39 |
| YOLOv8m | 0.60 | 0.60 | 0.56 | 0.36 |
| YOLOv8l | 0.74 | 0.60 | 0.62 | 0.41 |
| YOLOv8x | 0.79 | 0.64 | 0.77 | 0.53 |
Table 13 YOLOv8 Results (Fracture Class)
表 13 YOLOv8 结果(骨折类别)
| 模型变体 | 精确率 (Precision) | 召回率 (Recall) | mAP@0.5 | mAP@0.5:0.95 |
|---|---|---|---|---|
| YOLOv8n | 0.87 | 0.88 | 0.93 | 0.55 |
| YOLOv8s | 0.87 | 0.91 | 0.94 | 0.56 |
| YOLOv8m | 0.84 | 0.92 | 0.95 | 0.57 |
| YOLOv8l | 0.92 | 0.90 | 0.95 | 0.57 |
| YOLOv8x | 0.91 | 0.89 | 0.95 | 0.57 |
While this research was conducted, YOLOv8 was the most recent version. The results of this study can serve as a benchmark for evaluating the performance of future models for wrist abnormality detection, as further improvements to either YOLOv8 or future versions of YOLO may surpass the results obtained in this study. It is worth noting that this study didn’t explore the entire hyper parameter space and finding the best hyper parameters for each YOLO model may improve wrist abnormality detection performance on the dataset. Computational limitations restricted the input resolution to 640 pixels, but higher resolutions could further improve performance. The study showed that the models had difficulty detecting "bone anomaly", "bone lesion", and "foreign body" due to low instances of these classes, so increasing their instances through augmentation or image generation could enhance performance. Additionally, the performance of classification models could also be assessed by exploring the dataset for pure classification tasks without object localization.
在进行本研究时,YOLOv8是最新版本。该研究结果可作为评估未来腕部异常检测模型性能的基准,因为YOLOv8或未来YOLO版本的进一步改进可能会超越本研究的成果。值得注意的是,本研究未探索完整的超参数空间,为每个YOLO模型寻找最佳超参数可能会提升数据集的腕部异常检测性能。计算限制将输入分辨率控制在640像素,但更高分辨率可能进一步提升性能。研究表明,由于"骨骼异常"、"骨病变"和"异物"类别的样本量不足,模型对这些类别的检测存在困难,因此通过数据增强或图像生成增加这些类别的样本量可能会提高性能。此外,也可通过探索纯分类任务(无需目标定位)的数据集来评估分类模型的性能。
Table 14 YOLOv8 mAP@0.5 Scores (For All Classes)
表 14 YOLOv8 mAP@0.5 分数 (所有类别)
| 模型变体 | 骨骼异常 | 骨病变 | 异物 | 骨折 | 金属 | 骨膜反应 | 旋前征 | 软组织 | 文本 |
|---|---|---|---|---|---|---|---|---|---|
| YOLO8n | 0.20 | 0.50 | 0.11 | 0.93 | 0.91 | 0.71 | 0.70 | 0.26 | 0.99 |
| YOLOv8s | 0.27 | 1.00 | 0.00 | 0.94 | 0.93 | 0.71 | 0.76 | 0.21 | 0.99 |
| YOLOv8m | 0.19 | 0.27 | 0.00 | 0.95 | 0.96 | 0.73 | 0.80 | 0.18 | 0.99 |
| YOLOv8l | 0.22 | 0.55 | 0.10 | 0.95 | 0.97 | 0.72 | 0.79 | 0.26 | 0.99 |
| YOLOv8x | 0.26 | 1.00 | 1.00 | 0.95 | 0.95 | 0.72 | 0.79 | 0.32 | 0.99 |

Figure 9: mAP Scores (Fracture Class).
图 9: mAP分数 (骨折类别)。
Table 15 Faster R-CNN mAP@0.5 Scores (Across All Classes
表 15: Faster R-CNN mAP@0.5 分数 (所有类别)
| 异常类型 | mAP@0.5 |
|---|---|
| Boneanomaly Bonelesion | 0.00 0.00 |
| Foreignbody | 0.00 |
| Fracture | 0.75 |
| Metal | 0.78 |
| Periostealreaction | 0.54 |
| Pronatorsign | 0.10 |
| Softtissue | 0.03 |
| Text | 0.96 |
| AlII | 0.35 |
Table 16 mAP@0.5 Scores For Best Performing Model Variants
表 16: 最佳模型变体的 mAP@0.5 分数
| Model | Fracture | AII |
|---|---|---|
| YOLOv5x | 0.95 | 0.69 |
| YOLOv6m | 0.94 | 0.64 |
| YOLOv7 | 0.94 | 0.61 |
| YOLOv8x | 0.95 | 0.77 |
| FasterR-CNN | 0.75 | 0.35 |