Early hospital mortality prediction using vital signals
基于生命体征的早期院内死亡率预测
Abstract
摘要
Early hospital mortality prediction is critical as in tens iv is ts strive to make efficient medical decisions about the severely ill patients staying in intensive care units (ICUs). As a result, various methods have been developed to address this problem based on clinical records. However, some of the laboratory test results are time-consuming and need to be processed. In this paper, we propose a novel method to predict mortality using features extracted from the heart signals of patients within the first hour of ICU admission. In order to predict the risk, quantitative features have been computed based on the heart rate signals of ICU patients suffering cardiovascular diseases. Each signal is described in terms of 12 statistical and signal-based features. The extracted features are fed into eight class if i ers: decision tree, linear discriminant, logistic regression, support vector machine (SVM), random forest, boosted trees, Gaussian SVM, and K-nearest neighborhood (K-NN). To derive insight into the performance of the proposed method, several experiments have been conducted using the well-known clinical dataset named Medical Information Mart for Intensive Care III (MIMIC-III). The experimental results demonstrate the capability of the proposed method in terms of precision, recall, F1-score, and area under the receiver operating characteristic curve (AUC). The decision tree classifier satisfies both accuracy and interpret ability better than the other class if i ers, producing an F1-score and AUC equal to 0.91 and 0.93, respectively. It indicates that heart rate signals can be used for predicting mortality in patients in the care units especially coronary care units (CCUs), achieving a comparable performance with existing predictions that rely on high dimensional features from clinical records which need to be processed and may contain missing information.
早期住院死亡率预测至关重要,因为医护人员需要为重症监护病房(ICU)中的危重患者做出高效医疗决策。为此,基于临床记录已开发出多种解决方案。但部分实验室检测结果耗时较长且需后续处理。本文提出一种创新方法,通过提取患者入住ICU首小时心电信号特征进行死亡率预测。我们基于心血管疾病ICU患者的心率信号计算了12项统计与信号特征,并将这些特征输入八种分类器:决策树、线性判别、逻辑回归、支持向量机(SVM)、随机森林、提升树、高斯SVM和K近邻(K-NN)。为验证方法性能,我们采用知名临床数据集MIMIC-III进行实验。结果显示该方法在精确率、召回率、F1分数和受试者工作特征曲线下面积(AUC)方面表现优异,其中决策树分类器以0.91的F1分数和0.93的AUC值在准确性与可解释性上均优于其他分类器。这表明心率信号可用于ICU(特别是冠心病监护病房CCU)患者的死亡率预测,其性能与依赖高维临床记录特征(需处理且可能存在缺失)的现有预测方法相当。
1. Introduction
1. 引言
Intensive care unit (ICU) is a ward in hospital, where seriously ill patients are cared for by specially trained staff. Quick and accurate decisions for the patients are needed. As a result, a wide range of decision support systems have been deployed to aid in tens iv is ts for prioritizing the patients who have a high risk of mortality.
重症监护病房 (ICU) 是医院中由经过专门培训的医护人员对重症患者进行监护的病房。这里需要为患者做出快速而准确的决策。因此,已部署了多种决策支持系统,以协助医护人员优先处理具有高死亡风险的患者。
Most mortality prediction systems are considered as score-based models [1][2][3][4] which appraise disease severity to predict an outcome. These models utilize patient demographics and physiological variables such as age, temperature, and heart rate collected within the initial 12 to 24 hours after ICU admission with the aim of assessing ICU performance. The score-based models employ certain features that sometimes are not available at ICU admission. Also, they make decisions according to a collection of data after at least first 12 hours of ICU admission. To enhance the proficiency, the customized models refine the score-based models for usage within specific conditions. For instance, [5] introduces a model to predict the risk of mortality due to car dio respiratory arrest. Although these models provide adequate results, the ICU patients are varied and subjected to multiple diseases. Therefore, selecting the right model for a special patient who is immediately admitted to ICU is difficult. On the other hand, various studies [6][7][8][9][10] express the superiority of data mining techniques over traditional score-based models. The data mining models have exerted different techniques such as random forest [6][7], support vector machine [8], decision tree [9], and deep learning [10][11][12][13]. Furthermore, some of the methods like [14] engage a pipeline of data mining techniques to predict the risk of mortality. These methods are organized based on certain clinical records which are collected in initial hours after ICU admission. However, laboratory test results need to be processed and many clinical records contain missing values [15]. While vital signals can provide numerous information which has been proven to possess strong relation with the mortality [16]. Therefore, vital signal fluctuations can provide high capability to predict the mortality risk more accurately and faster than clinical-based methods.
大多数死亡率预测系统被视为基于评分的模型 [1][2][3][4],通过评估疾病严重程度来预测结果。这些模型利用患者入ICU后最初12至24小时内收集的人口统计学和生理变量(如年龄、体温和心率),旨在评估ICU绩效。基于评分的模型采用的某些特征有时在患者刚入ICU时无法获取,且需依据至少入ICU 12小时后的数据集合进行决策。为提升效能,定制化模型会对基于评分的模型进行优化以适配特定场景。例如,[5]提出了预测心搏呼吸骤停致死风险的模型。虽然这些模型能提供合理结果,但ICU患者病情多样且常合并多种疾病,因此为刚入ICU的特殊患者选择合适模型存在困难。另一方面,多项研究 [6][7][8][9][10] 表明数据挖掘技术优于传统评分模型。数据挖掘模型应用了随机森林 [6][7]、支持向量机 [8]、决策树 [9] 和深度学习 [10][11][12][13] 等多种技术。此外,诸如 [14] 等方法采用数据挖掘技术流程来预测死亡风险。这些方法基于患者入ICU初期数小时内收集的特定临床记录进行组织,但实验室检测结果需经处理且许多临床记录存在缺失值 [15]。而生命体征信号可提供大量信息,已被证明与死亡率存在强相关性 [16]。因此,相较于基于临床记录的方法,生命体征波动能更快速、更准确地预测死亡风险。
The main goal of this paper is to provide an early mortality prediction of patients based on their first hour after ICU admission according to their heart rate signals. Our study relies on the Medical Information Mart for Intensive Care III, MIMIC-III Waveform Database records [17]. We propose a method to extract both statistical and signalbased features from the heart signals and employ well-known class if i ers such as logistic regression and decision tree to predict hospital mortality, i.e. death inside the hospital.
本文的主要目标是根据患者进入重症监护室(ICU)后第一小时的心率信号,对其早期死亡率进行预测。我们的研究基于MIMIC-III波形数据库[17]中的医疗信息记录。我们提出了一种从心电信号中提取统计特征和信号特征的方法,并采用逻辑回归和决策树等经典分类器来预测院内死亡率(即患者在院内死亡的情况)。
The rest of the paper is organized as follows: Section 2 presents a literature review on the related studies. Section 3 describes the proposed method in four subsections of data description, signal preprocessing, feature extraction, and classification. To evaluate the performance of the proposed method, Section 4 is allocated to the experiments and discussions. Finally, Section 5 summarizes the conclusion and future work.
本文其余部分结构如下:第2节对相关研究进行文献综述。第3节通过数据描述、信号预处理、特征提取和分类四个小节阐述所提出的方法。为评估该方法性能,第4节专门用于实验与讨论。最后,第5节总结结论与未来工作。
2. Related Work
2. 相关工作
There is an increasing interest in addressing early hospital mortality prediction. The proposed systems can be categorized into three classes of score-based, customized, and data mining models.
人们对解决早期医院死亡率预测的兴趣日益增长。提出的系统可分为三类:基于评分的模型、定制化模型和数据挖掘模型。
Various score-based approaches such as acute physiology and chronic health evaluation (APACHE) [4], simplified acute physiology score (SAPS) [3], and quick sepsis-related organ failure assessment score (qSOFA) [2] have been proposed. APACHE score is the best-known and widely used in intensive cares [18]. The original APACHE score [19] employed 34 physiological measures from initial 24 hours after ICU admission to determine the chronic health status of the patients. [4] introduced the APACHE II scoring model including a reduction in the number of variables to 12 routine physiological measurements, along with the age of patients. Extending that, the APACHE III improved the effectiveness of mortality prediction by adding new variables such as race, length of stay in ICU, and prior place before ICU. APACHE IV also endeavored to enhance the over prediction problem of the APACHE III by adding new variables and using the weights utilized in APACHE III [20]. The traditional severity of illness score-based models commonly attempted to predict based on either specific age ranges, or information recorded within the first 24 hours of ICU admission [21]. Furthermore, they utilized features which are not always available at the time of ICU admission. For instance, the APACHE IV applied its analysis on over 100 variables like chronic health variables of AIDS, cirrhosis, hepatic failure, immunosuppression which may not be recorded at the time of admission.
多种基于评分的评估方法被提出,如急性生理与慢性健康评分 (APACHE) [4]、简化急性生理评分 (SAPS) [3] 和快速序贯器官衰竭评分 (qSOFA) [2]。其中APACHE评分是重症监护领域最知名且广泛使用的评估体系 [18]。最初的APACHE评分 [19] 通过患者入ICU后24小时内的34项生理指标来评估其慢性健康状况。文献 [4] 提出的APACHE II评分模型将变量精简至12项常规生理指标,并纳入患者年龄因素。在此基础上,APACHE III通过新增种族、ICU住院时长及入ICU前所在地等变量,提升了死亡率预测的准确性。APACHE IV则通过引入新变量并沿用APACHE III的权重系数 [20],致力于改善APACHE III存在的预测值偏高问题。传统基于疾病严重程度的评分模型通常仅针对特定年龄段患者,或依赖入ICU最初24小时的记录数据进行预测 [21]。此外,这些模型采用的某些特征指标(如APACHE IV使用的100余项变量中的艾滋病、肝硬化、肝衰竭、免疫抑制等慢性健康指标)在患者入院时往往尚未完成采集。
The customized models make a decision according to the characteristics of either specific health problems such as car dio respiratory arrest [5] and early severe sepsis [22], or specific geographical areas such as France [23] or Australia [24]. For instance, Le Gall and coworkers [23] customized the SAPS II model based on the French patients’ characteristics. They used the logit of the original SAPS II model and computed the coefficients according to the data. Furthermore, they tried to expand the second version of SAPS by adding six variables (age, sex, length of hospital stay before ICU admission, and the patient’s location before ICU) that are potentially associated with mortality. Although these models provide adequate results, most ICU patients are elderly people over 65 years [25] who are faced with multiple ailments. Also, selecting the right model is challenging due to the variety of patients who are immediately admitted to ICU. Moreover, the models for specific geographical areas are not extendable for other cases.
定制化模型根据特定健康问题(如心肺骤停 [5] 和早期严重脓毒症 [22])或特定地理区域(如法国 [23] 或澳大利亚 [24])的特征做出决策。例如,Le Gall 及其同事 [23] 根据法国患者的特征定制了 SAPS II 模型。他们使用原始 SAPS II 模型的 logit 值,并根据数据计算系数。此外,他们还尝试通过添加六个可能与死亡率相关的变量(年龄、性别、入住 ICU 前的住院时长以及患者入住 ICU 前的位置)来扩展 SAPS 的第二版。尽管这些模型提供了合理的结果,但大多数 ICU 患者是 65 岁以上的老年人 [25],他们面临多种疾病。此外,由于立即入住 ICU 的患者类型多样,选择合适的模型具有挑战性。而且,针对特定地理区域的模型无法扩展到其他情况。
The third class of methods employ data mining techniques to forecast mortality. For instance, [6] devised a method based on random forest and the synthetic minority over-sampling technique. In another method, Ven u gopalan et. al [14] used a pipeline of logistic regression, neural network, and conditional random forest. The three categories of demographic, lab, and chart data such as gender, age, height, sodium, creatinine, and heart rate have been fed to logistic regression, neural network, and conditional random forest, respectively. These methods focus on using clinical records instead of waveform data while in practice, many clinical records such as laboratory test results need to be processed which could delay the clinical decision support process.
第三类方法采用数据挖掘技术来预测死亡率。例如,[6]设计了一种基于随机森林和合成少数类过采样技术的方法。在另一种方法中,Venugopalan等人[14]使用了逻辑回归、神经网络和条件随机森林的组合流程。人口统计学、实验室和图表数据这三类数据(如性别、年龄、身高、钠、肌酐和心率)分别输入到逻辑回归、神经网络和条件随机森林中。这些方法侧重于使用临床记录而非波形数据,而在实践中,许多临床记录(如实验室检测结果)需要处理,这可能会延迟临床决策支持过程。
To address these issues, we propose a method for early mortality prediction of patients based on the first hour after ICU admission using heart rate signals. To the best of our knowledge, this paper is the first work which utilizes only heart signals for early mortality prediction using the MIMIC-III dataset. We describe each signal in terms of 12 statistical and signal-based features which are fed into multiple transparent and non-transparent class if i ers.
为了解决这些问题,我们提出了一种基于患者入住ICU后第一小时心率信号的早期死亡率预测方法。据我们所知,本文是首个仅利用心电信号在MIMIC-III数据集上进行早期死亡率预测的研究。我们通过12个统计和信号特征来描述每个信号,并将这些特征输入到多个透明与非透明分类器中。
3. Methodology
3. 方法论
This section presents a novel method which utilizes statistical and signal-based features with the purpose of fast and accurate early hospital mortality prediction. Subsection 3.1 provides a review on the MIMIC-III clinical dataset while subsections 3.2 and 3.3 describe signal preprocessing and feature extraction, respectively. Ultimately, subsection 3.4 presents an overview on the descriptive class if i ers employed to predict whether a patient survives or passes away based on the characteristics of their ECG signal.
本节提出了一种利用统计和信号特征实现快速准确早期住院死亡率预测的新方法。3.1小节回顾了MIMIC-III临床数据集,3.2和3.3小节分别描述了信号预处理和特征提取方法。最后,3.4小节概述了用于根据患者心电图(ECG)信号特征预测其存活或死亡的描述性分类器。
3.1. Data Description
3.1. 数据描述
This study is conducted over the well-known MIMICIII database comprising the records of 46520 patients who stayed in critical care units. Due to the de-identification process, there are only 10282 patients whose the clinical data in the MIMIC-III are associated with the related vital signals in the Matched Subset. As shown in the Figure 1, the age distributions of the whole MIMIC-III (without infants) and the Matched Subset are similar. Hence, the outcomes of the Matched Subset can be extended to the whole database. It is worth mentioning that due to the de-identification process, all the patients greater than or equal to 90 years of age are assigned to one group.
本研究基于著名的MIMICIII数据库开展,该库包含46520名重症监护病房患者的记录。由于去标识化处理,仅有10282名患者的MIMIC-III临床数据与Matched Subset中的相关生命体征信号相关联。如图1所示,整个MIMIC-III数据库(不含婴儿)与Matched Subset的年龄分布相似。因此,Matched Subset的研究结果可推广至整个数据库。需要说明的是,由于去标识化处理,所有年龄大于或等于90岁的患者被归为一个组别。
Also, the hospital wards for patients throughout their hospital stay have been reported via the transfers table in the clinical dataset. Indeed, it specifies which of the care units described in Table 1 have been allocated to each patient in a certain time. Since nearly 90 percent of patients in the Matched Subset suffer from cardiovascular diseases, we have focused on predicting the risk of mor
此外,临床数据集中的转移表记录了患者在整个住院期间所在的病房。该表具体指明了表1中描述的哪些护理单元在特定时间段内分配给了每位患者。由于匹配子集中近90%的患者患有心血管疾病,我们重点预测了死亡风险
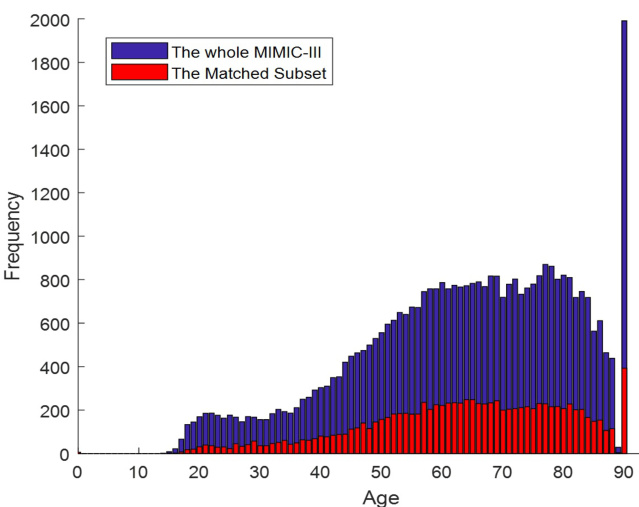
Figure 1: The age distribution over the Whole MIMIC-III (without infants) and the Matched Subset
图 1: 整个MIMIC-III(不含婴儿)与匹配子集的年龄分布
tality among patients who stayed in coronary care unit (CCU) in this study. CCU is an ICU that takes patients with cardiac conditions required continuous monitoring and treatment.
本研究中对入住冠心病监护病房(CCU)患者的死亡率进行了分析。CCU是一种专门收治需要持续监测和治疗的心脏病患者的重症监护病房。
Table 1: Care Units in MIMIC-III
表 1: MIMIC-III中的护理单元
| Careunit | Description |
|---|---|
| CCU | 冠心病监护病房 (Coronary care unit) |
| CSRU | 心脏外科术后恢复病房 (Cardiac surgery recovery unit) |
| MICU | 内科重症监护病房 (Medical intensive care unit) |
| NICU | 新生儿重症监护病房 (Neonatal intensive care unit) |
| NWARD | 新生儿病房 (Neonatal ward) |
| SICU | 外科重症监护病房 (Surgical intensive care unit) |
| TSICU | 创伤/外科重症监护病房 (Trauma/surgical intensive care unit) |
3.2. Signal Preprocessing
3.2. 信号预处理
The recorded physiological signals are always accompanied with noise due to different recording systems. The MIMIC-III database is extracted from the CareVue and MetaVision clinical information systems provided by Philips and iMDSoft, respectively [17]. After extracting the data, we truncated the tails which contain only zeros or undefined
记录的生理信号总会因不同记录系统而伴随噪声。MIMIC-III数据库分别从Philips的CareVue和iMDSoft的MetaVision临床信息系统中提取数据 [17]。提取数据后,我们截去了仅含零值或未定义的尾部数据。
values. Following this, we replaced the missing values with the previous known ones. Finally, the smoothed version of heart rate signal, $S^{\prime}(t)$ , was computed according to the moving average filter with one-hour windows size $\rho$ in the form of Equation 1.
随后,我们用之前已知的值替换了缺失值。最后,根据公式1所示的窗口大小为$\rho$(一小时)的移动平均滤波器,计算出了心率信号的平滑版本$S^{\prime}(t)$。
where the original signal $S(t)$ contains $L$ samples. On the other hand, the heart signals were recorded with different lengths and sampling rates. For instance, the sampling rate of the heart rate (HR) signals are varied from 1 to $0.17:\mathrm{Hz}$ in MIMIC-III database. To avoid biased comparison among signals due to the different sampling rates and lengths, the anti-aliasing finite impulse response (FIR) low-pass filter [26] was performed over the low sampling rate signals. Indeed, a linear-phase FIR filter interpolates new samples to resample the signals with a lower sampling rate. For instance, as shown in Figure 2 the noise samples have been removed by applying the moving average over the original signal. Then, the oversampling method increases the frequency of the heart rate signal to $1H z$ , leading to increasing the number of samples from 9021 to $541310^{5}$ .
原始信号 $S(t)$ 包含 $L$ 个样本。另一方面,心电信号以不同的长度和采样率记录。例如,在MIMIC-III数据库中,心率(HR)信号的采样率从1到 $0.17:\mathrm{Hz}$ 不等。为避免因采样率和长度不同导致的信号间有偏比较,我们对低采样率信号进行了抗混叠有限脉冲响应(FIR)低通滤波[26]。实际上,线性相位FIR滤波器通过插值新样本来对信号进行降采样重采样。例如,如图2所示,通过对原始信号应用移动平均法去除了噪声样本。随后,过采样方法将心率信号的频率提升至 $1Hz$,使样本数量从9021增加到 $541310^{5}$。
3.3. Feature Extraction
3.3. 特征提取
In order to predict the risk of mortality after the first hour of ICU admission, quantitative features have been computed based on the HR signals. Each signal is described in terms of 12 statistical and signal-based features which were extracted from the patient’s ECG signal. The statistical features reveal useful information about the distributions of the processed data described in the subsection 3.2. Signal preprocessing. Maximum, minimum, and
为了预测患者进入ICU后第一小时的死亡风险,我们基于心率(HR)信号计算了量化特征。每条信号均通过12个统计特征和信号特征进行描述,这些特征均从患者心电(ECG)信号中提取获得。统计特征能够反映3.2小节"信号预处理"中所述处理数据的分布信息,包括最大值、最小值和...
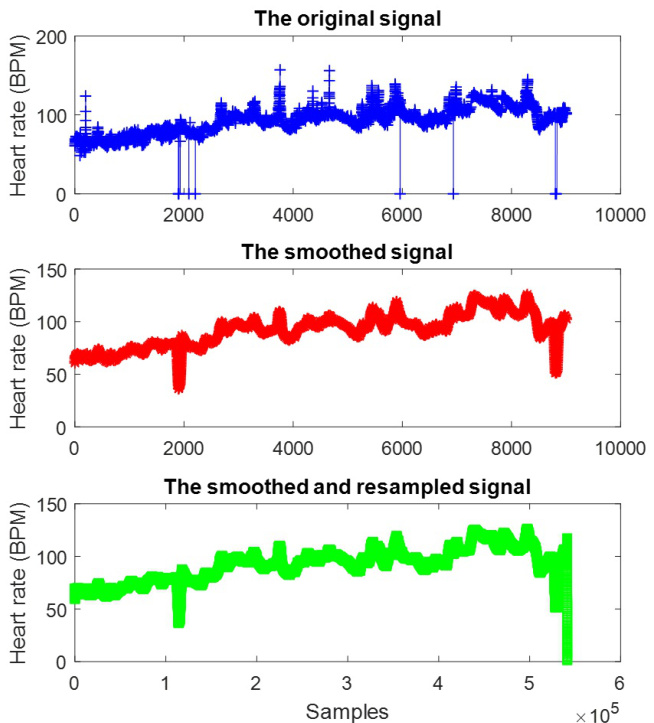
Figure 2: The pre processed heart rate signal of one survived patient from CCU
图 2: CCU幸存患者的心率信号预处理结果
range can demonstrate the spectrum in which the distribution lies. The skewness indicates whether the distribution is symmetric or skewed. The kurtosis measures the thickness of the tails of the distribution and the standard deviation shows how the data samples scatter around the mean. Table 2 indicates the average of each feature for both passed away and living patients. The reported values indicate the capability of these features in segregating the two groups of patients based on the proposed statistical and signal-based features.
范围可以展示分布所处的频谱。偏度表示分布是对称还是偏斜的。峰度衡量分布尾部的厚度,标准差显示数据样本围绕均值的离散程度。表 2 展示了已逝患者和存活患者每个特征的平均值。报告数值表明这些特征能够基于所提出的统计和信号特征区分两组患者。
Table 2: Descriptive Statistics for Statistical and Signal-Based Features
| Column | Feature | Passed away patients | Alive patients |
| 1 | Maximum | 97.82 | 90.92 |
| 2 | Minimum | 80.69 | 76.24 |
| 3 | Mean | 88.46 | 81.92 |
| 4 | Median | 88.45 | 81.81 |
| 5 | Mode | 85.25 | 79.98 |
| 6 | Standard deviation | 2.63 | 2.25 |
| 7 | Variance | 15.84 | 11.56 |
| 8 | Range | 17.13 | 14.68 |
| 9 | Kurtosis | 17.48 | 17.85 |
| 10 | Skewness | 0.83 | 1.02 |
| 11 | Averaged power | 8186.02 | 7045.04 |
| 12 | Energy spectral density | 5114.78 | 4420.38 |
表 2: 统计特征与信号特征的描述性统计
| 列 | 特征 | 已故患者 | 存活患者 |
|---|---|---|---|
| 1 | 最大值 | 97.82 | 90.92 |
| 2 | 最小值 | 80.69 | 76.24 |
| 3 | 平均值 | 88.46 | 81.92 |
| 4 | 中位数 | 88.45 | 81.81 |
| 5 | 众数 | 85.25 | 79.98 |
| 6 | 标准差 | 2.63 | 2.25 |
| 7 | 方差 | 15.84 | 11.56 |
| 8 | 极差 | 17.13 | 14.68 |
| 9 | 峰度 | 17.48 | 17.85 |
| 10 | 偏度 | 0.83 | 1.02 |
| 11 | 平均功率 | 8186.02 | 7045.04 |
| 12 | 能量谱密度 | 5114.78 | 4420.38 |
The signal-based features in this study fall into two different groups of averaged power and power spectral density [27]. The averaged power of a finite discrete-time signal is defined as the mean of the signal’s energy. The averaged power of a discrete-time signal $S[n]$ is computed as:
本研究中的信号特征分为平均功率和功率谱密度[27]两类。有限离散时间信号的平均功率定义为信号能量的均值。离散时间信号$S[n]$的平均功率计算公式为:
$$
\bar{P}=\frac{E}{n_{2}-n_{1}+1}=\frac{1}{n_{2}-n_{1}+1}\sum_{n_{1}}^{n_{2}}S[n]^{2}
$$
$$
\bar{P}=\frac{E}{n_{2}-n_{1}+1}=\frac{1}{n_{2}-n_{1}+1}\sum_{n_{1}}^{n_{2}}S[n]^{2}
$$
where $n_{1}$ and $n_{2}$ are the first and last samples, respectively. The signal power is computed by taking the integral of the power spectral density (PSD) of a signal over the entire frequency space. The PSD is the Fourier transform of the biased estimate of the auto correlation sequence. The PSD of the signal $S[n]$ with sampling rate $\rho$ , in the interval $\Delta T$ can be computed as follows:
其中 $n_{1}$ 和 $n_{2}$ 分别为第一个和最后一个样本。信号功率通过在整个频率空间上对信号功率谱密度 (PSD) 进行积分计算得出。PSD是自相关序列有偏估计的傅里叶变换。采样率为 $\rho$ 的信号 $S[n]$ 在时间间隔 $\Delta T$ 内的PSD可按以下公式计算:
$$
\bar{P}=\frac{\Delta T}{N}\mid\sum_{n=0}^{N-1}S[n]e^{-i2\pi\rho}\mid
$$
$$
\bar{P}=\frac{\Delta T}{N}\mid\sum_{n=0}^{N-1}S[n]e^{-i2\pi\rho}\mid
$$
3.4. Classification
3.4. 分类
In the MIMIC III dataset, the number of patients who passed away inside the hospital is relatively small in comparison with the number of patients who survived, meaning the dataset is imbalanced. The ratio of physiological signals pointing to the passed away patient in contrast to those who survive is equal to 7.03. Thus, the early mortality prediction systems are faced with an imbalanced dataset. To handle this issue, a wide range of techniques such as resampling [6], cost sensitive class if i ers [28], and one-class class if i ers [29][30] have been proposed. Resampling methods make no assumptions about the distribution of samples and therefore, they can be applicable to any classification problem. Also, they are less sensitive to outliers than other techniques. In this study, we utilize a resampling method called adaptive semi-unsupervised weighted oversampling (A-SUWO) [31] to balance the dataset.
在MIMIC III数据集中,院内死亡患者数量与存活患者相比相对较少,这意味着数据集存在不平衡问题。指向死亡患者的生理信号与存活患者的比例达到7.03。因此,早期死亡率预测系统面临着数据不平衡的挑战。为解决这一问题,学界提出了多种技术方案,包括重采样 [6] 、代价敏感分类器 [28] 以及单类分类器 [29][30] 。重采样方法不对样本分布做任何假设,因此可适用于任何分类问题。与其他技术相比,这类方法对异常值的敏感度更低。本研究采用了一种名为自适应半监督加权过采样 (A-SUWO) [31] 的重采样方法来平衡数据集。
The 10-fold cross-validation strategy was used to evaluate the performance of class if i ers on the same dataset. In this way, samples are arbitrarily divided into ten disjoint sections. In ten iterations, nine folds shape a group of samples used to train class if i ers. Furthermore, the remaining one is utilized to test the learning process. The mean of learning rates determines the performance of the methods in segregation of classes.
采用10折交叉验证策略评估分类器在同一数据集上的性能。该方法将样本随机划分为十个互不相交的子集。在十次迭代中,九折作为训练集用于训练分类器,剩余一折则用于测试学习过程。各类别分离方法的性能由学习率的平均值决定。
In this study, two categories of class if i ers are examined: transparent or interpret able models, and non-transparent or black-box models. Transparent class if i ers such as decision tree, linear discriminant, logistic regression, and support vector machine (SVM) using the linear kernel explain hidden clinical implications and integrate background knowledge into analysis. Also, they are not only easy to interpret and fast, but also need small memory in practice. On the other hand, non-transparent class if i ers like random forest, K-NN, boosted tree, and Gaussian SVM are black-box methods which frequently provide adequate classification results. However, these non-transparent class if i ers suffer from lack of easily-comprehensible descriptions for the relations between input and output variables.
本研究考察了两类分类器:透明或可解释模型,以及非透明或黑盒模型。透明分类器如决策树、线性判别、逻辑回归和使用线性核的支持向量机 (SVM) ,能够解释隐藏的临床意义并将背景知识整合到分析中。此外,它们不仅易于解释且速度快,在实际应用中还占用较少内存。另一方面,随机森林、K近邻、提升树和高斯SVM等非透明分类器属于黑盒方法,通常能提供足够的分类结果。然而,这些非透明分类器难以提供易于理解的输入与输出变量关系描述。
4. Experiments and Results
4. 实验与结果
In these experiments, a retrospective analysis on patients who stayed in CCU was performed using the information recorded in from the MIMIC-III Waveform Database Matched Subset. This dataset contains the records of 365 patients who passed away while staying at CCU and 2614 patients successfully discharged. As mentioned above, the effect of noise samples was reduced by smoothing the heart rate signals using the averaged smoothing filter. Also, resampling of low-sampled signals was used to have a fair comparison. Eventually, the combination of statistical and signal-based features after normalization was fed to several interpret able and non-transparent class if i ers which are easy to interpret and statistically powerful, respectively.
在这些实验中,利用MIMIC-III波形数据库匹配子集中记录的信息,对CCU住院患者进行了回顾性分析。该数据集包含365例CCU住院期间死亡患者和2614例成功出院患者的记录。如前所述,通过使用平均平滑滤波器对心率信号进行平滑处理,降低了噪声样本的影响。同时采用低采样信号的重采样以确保公平比较。最终,将归一化后的统计特征与信号特征组合输入到若干可解释分类器和非透明分类器中(分别易于解释且统计效力较强)。
Four transparent class if i ers: decision tree, linear discriminant, logistic regression, and support vector machine (SVM) were examined. The decision tree was implemented based on a CART tree algorithm [32] with Gini’s diversity index $(G D I)$ as a split criterion. This splitting criterion is one of the most popular impurity measurements which not only performs similar to information gain in most cases [33], but also has lower computational complexity as a result of avoiding use of the logarithm. The Gini index in the form of Equation 4 is utilized to select the next feature at each node of the tree for splitting the data.
四种透明分类器:决策树、线性判别、逻辑回归和支持向量机 (SVM) 被纳入研究。决策树基于 CART 树算法 [32] 实现,以基尼多样性指数 $(GDI)$ 作为分割标准。该分割标准是最流行的不纯度度量方法之一,不仅在多数情况下表现与信息增益相似 [33],还因避免使用对数运算而具有更低计算复杂度。如公式 4 所示的基尼指数被用于在树的每个节点选择下一个特征进行数据分割。
$$
G D I=1-\sum_{i}(p(i))^{2}
$$
$$
G D I=1-\sum_{i}(p(i))^{2}
$$
where $p(i)$ is the observed fraction of samples in the node, which are labeled as $i$ . Therefore, the $G D I$ equal to zero points out to a pure node which contains samples of one class. On the other hand, the $G D I$ for binary classification is equal to 0.5 at most when a node contains samples of both classes with identical numbers. Furthermore, the linear SVM working based on dot product kernel is a simple linear classifier. As a result, this version of SVM is both easy to be interpreted and fast in prediction.
其中 $p(i)$ 表示节点中被标记为 $i$ 的样本观测比例。因此,当 $GDI$ 为零时,表明该节点为纯节点,仅包含单一类别的样本。另一方面,在二分类任务中,若节点包含两类数量相等的样本,则 $GDI$ 最大值为0.5。此外,基于点积核函数的线性SVM是一种简单的线性分类器,这使得该版本SVM既易于解释又具有快速预测的特点。
Regarding to the non-transparent class if i ers, four black-box methods of random forest, boosted trees, Gaussian SVM, and K-nearest neighborhood (K-NN) are employed. The random forest and boosted trees utilize 60 decision tree learners according to the bootstrap aggregating [34] and adaptive boosting [35] ensemble methods, respectively. Moreover, the Gaussian SVM uses radial basis function kernel and K-NN exerts the K equal to 100. All the experiments are implemented in MATLAB 9.2.0.538062(R2017a) on the same machine with an Intel processor $2.50\mathrm{GHz}$ with 8 GB RAM
针对非透明分类器,采用了随机森林、提升树、高斯支持向量机 (SVM) 和 K近邻 (K-NN) 四种黑盒方法。其中随机森林和提升树分别基于自助聚合 [34] 与自适应增强 [35] 集成方法,各采用60个决策树学习器。高斯SVM使用径向基函数核,K-NN设置K值为100。所有实验均在配备Intel $2.50\mathrm{GHz}$ 处理器和8GB内存的同一台计算机上,通过MATLAB 9.2.0.538062(R2017a) 实现。
4.1. Results
4.1. 结果
The outputs of class if i ers can be summarized in four groups: the patients who are truly diagnosed as passed away (TP), the people who are incorrectly labeled as passed away (FP), the records correctly detected as information belonging to survived patients (TN), and finally the ones incorrectly assigned as living patients (FN). These four groups can be aggregated in different ways.
分类器的输出结果可归纳为四类:真实诊断为已死亡的患者(TP)、被错误标记为已死亡的人员(FP)、正确识别为幸存患者信息的记录(TN),以及最终被错误归类为在世患者的记录(FN)。这四类数据可通过不同方式进行汇总。
Equation 5 indicates the precision metric as the fraction of patients who have been truly diagnosed as passed away over all the patients predicted as having passed away. Indeed, the larger number of patients incorrectly predicted as passed away leads to the lower precision for the classifier. Moreover, to see the ability of the classification method in predicting all passed-away patients, we utilize the recall metric presented in Equation 6. In other words, this metric presents the fraction of the patients who are correctly predicted as passed-away over the whole number of passed-away patients.
公式5将精确率指标定义为在所有被预测为已死亡的患者中,真实确诊为已死亡患者的比例。事实上,被错误预测为已死亡的患者数量越多,分类器的精确率就越低。此外,为了评估分类方法在预测所有已死亡患者方面的能力,我们采用公式6所示的召回率指标。换言之,该指标表示在整个已死亡患者群体中,被正确预测为已死亡的患者比例。
$$
P r e c i s i o n=\frac{T P}{T P+F P}
$$
$$
P r e c i s i o n=\frac{T P}{T P+F P}
$$
$$
R e c a l l=\frac{T P}{T P+F N}
$$
召回率 (Recall) = \frac{TP}{TP+FN}
It is worth mentioning that all samples being assigned to positive group lead to high recall and low precision. Then, the harmonic average of precision and recall called F1-score is also considered. Indeed, F1-score described in Equation 7 calculates the quality of classification for both passed away and living patients, simultaneously.
值得一提的是,将所有样本归入阳性组会导致高召回率和低精确率。因此,还需考虑精确率与召回率的调和平均数,即F1分数。实际上,公式7中描述的F1分数能同时衡量已故患者和存活患者的分类质量。
$$
F1-s c o r e=\frac{2\times(P r e c i s i o n\times R e c a l l)}{P r e c i s i o n+R e c a l l}
$$
$$
F1-s c o r e=\frac{2\times(P r e c i s i o n\times R e c a l l)}{P r e c i s i o n+R e c a l l}
$$
Table 3: Classification Results for CCU Mortality
| Classifier | Precision | Recall | F1-score | Interpretability |
| Randomforest | 0.97 | 0.97 | 0.97 | |
| Gaussian SVM | 0.95 | 0.96 | 0.96 | Hard |
| Decision tree | 0.90 | 0.92 | 0.91 | Easy |
| Boosted trees | 0.91 | 0.83 | 0.87 | Hard |
| K-NN | 0.80 | 0.85 | 0.82 | Hard |
| Logistic regression | 0.77 | 0.67 | 0.72 | Easy |
| Linear discriminant | 0.78 | 0.66 | 0.71 | Easy |
| Linear SVM | 0.80 | 0.63 | 0.70 | Easy |
表 3: CCU死亡率分类结果
| 分类器 | 精确率 | 召回率 | F1分数 | 可解释性 |
|---|---|---|---|---|
| Randomforest | 0.97 | 0.97 | 0.97 | |
| Gaussian SVM | 0.95 | 0.96 | 0.96 | Hard |
| Decision tree | 0.90 | 0.92 | 0.91 | Easy |
| Boosted trees | 0.91 | 0.83 | 0.87 | Hard |
| K-NN | 0.80 | 0.85 | 0.82 | Hard |
| Logistic regression | 0.77 | 0.67 | 0.72 | Easy |
| Linear discriminant | 0.78 | 0.66 | 0.71 | Easy |
| Linear SVM | 0.80 | 0.63 | 0.70 | Easy |
As shown in the Table 3, the decision tree outperforms all transparent class if i ers which are easily interpret able and provide some clinical insights into the classification process. Also, the values for F1-score among the transparent class if i ers demonstrate a big gap between the decision tree and the others. The F1-score of linear discriminant, linear SVM, and logistic regression is near to 0.71 while the decision tree results in 0.91. The linear discriminant assumes that different groups of data are generated based on different Gaussian distributions. However, the amounts of Skewness and Kurtosis of both passed away and surviving patients are not equal to zero (table 2) which indicates non-Gaussian distribution for the both groups of patients. This is the likely reason why the linear discriminant results in low performance. In addition, weak performance of the logistic regression and linear SVM may indicate that the data are not linearly separable. Furthermore, the performance of these supervised methods is similar to the results of the other empirical comparisons such as [36] describing that random forest can outperform other class if i ers like SVM and K-NN in certain conditions.
如表3所示,决策树在可解释性强且能提供临床分类过程洞察的透明分类器中表现最优。各透明分类器的F1值也显示出决策树与其他方法的显著差距:线性判别、线性SVM和逻辑回归的F1值约为0.71,而决策树达到0.91。线性判别分析基于不同高斯分布生成数据组的假设,但如表2所示,死亡组与存活组的偏度和峰度均不为零,表明两组患者数据均不符合高斯分布,这可能是线性判别性能较低的原因。此外,逻辑回归和线性SVM的弱表现可能说明数据非线性可分。这些监督方法的性能与其他实证研究结果一致,例如[36]指出在某些条件下随机森林能超越SVM和K-NN等分类器。
From another point of view, all interpret able class if i ers except the decision tree have lower recall (near 0.65) rather than their precision. However, the decision tree has both high precision and recall that shows not only most of the passed-away patients have been correctly recognized but also most of the predicted passed-away patients are correctly assigned to the correct category. As expected, most of the non-transparent class if i ers achieve higher performance in comparison to the interpret able class if i ers. In addition, random forest comprising several decision tree learners performs better than the other black boxe methods. The interesting point is that the decision tree exceeds many of the non-transparent class if i ers including K-NN and boosted tree.
从另一个角度来看,除决策树外所有可解释分类器的召回率(约0.65)都低于其精确率。然而决策树同时具备高精确率和高召回率,表明不仅能正确识别大多数死亡病例,还能将预测的死亡病例准确归类。不出所料,大多数非透明分类器的性能优于可解释分类器。此外,由多个决策树学习器组成的随机森林表现优于其他黑盒方法。值得注意的是,决策树超越了包括K近邻和提升树在内的多种非透明分类器。
Decision support systems are required to be accurate and robust; however, they also should be interpret able, transparent, and capable of integrating clinical background knowledge into the analysis. Hence, we focus on transparent class if i ers and scrutinize their performance in different thresholds. Figure 3 demonstrates that the decision tree outperforms the other transparent class if i ers in terms of AUC. Furthermore, the linear SVM, logistic regression, and linear discriminant have similar performance even on different thresholds, which lie lower than the AUC of the decision tree.
决策支持系统需要具备准确性和鲁棒性,同时还应具备可解释性、透明度,并能将临床背景知识整合到分析中。因此,我们重点关注透明分类器,并详细分析它们在不同阈值下的性能表现。图3显示,在AUC指标上,决策树的表现优于其他透明分类器。此外,线性支持向量机(SVM)、逻辑回归和线性判别分析即使在不同阈值下也表现出相似的性能,但它们的AUC值均低于决策树。
Referring to the ROC curve of black-box methods plotted by solid lines in Figure 3, random forest has the best performance in comparison to Gaussian SVM, boosted trees, and K-NN. Moreover, the curves indicate that random forest and Gaussian SVM have a homogeneous ratio of true positive rate over false positive rate. Furthermore, the
图 3 中用实线绘制的黑盒方法ROC曲线显示,随机森林 (random forest) 相比高斯支持向量机 (Gaussian SVM)、提升树 (boosted trees) 和K近邻 (K-NN) 具有最佳性能。此外,曲线表明随机森林和高斯支持向量机在真阳性率与假阳性率之比上具有同质性。
ROC curve of decision tree represents the out performance of this transparent classifier over two black-box methods of K-NN and boosted trees.
决策树的ROC曲线表明,这种透明分类器的性能优于K近邻(K-NN)和提升树这两种黑盒方法。
The results reveal that the most non-transparent classifiers achieve higher discrimination power while they failed to provide adequate explanations about how the classification results are derived. On the other hand, the interpret able class if i ers often attempt to create a decision boundary using the value of linear combination of the sample features. However, most real samples originate from a complex system such as human body. Hence, the decision tree may provide the best choice as a tradeoff between transparency and accuracy. The decision tree discovers knowledge which can be expressed in a readable form while its classification performance is comparable with other methods, even popular non-transparent classifiers.
结果表明,最具不透明性的分类器虽然实现了更高的判别力,却无法充分解释分类结果是如何得出的。另一方面,可解释分类器通常试图利用样本特征的线性组合值来创建决策边界。然而,大多数真实样本源自人体等复杂系统。因此,决策树可能成为透明性与准确性之间的最佳折中选择。决策树发现的知识能以可读形式呈现,其分类性能也与其他方法(甚至流行的非透明分类器)相当。
4.2. Discussion
4.2. 讨论
In order to interpret the decision tree qualitatively, Figure 4 illustrates the best trained structural model of this classifier gained in the experiments. The tree model hierarchically separates data according to the features leading to a more stable and pure tree. For instance, the
为了定性解释决策树,图 4展示了实验中获得的该分类器最佳训练结构模型。该树模型根据特征对数据进行分层划分,从而形成更稳定、更纯净的树结构。例如,

Figure 3: The ROC curves of transparent and black-box class if i ers shown by dashed and solid lines, respectively
图 3: 透明分类器(虚线)与黑盒分类器(实线)的ROC曲线对比
left-most child of the decision tree displayed by green star contains records from class 1 (survived patients). The highlighted path shows records which satisfy the three rules shown in the graph. The first rule divides samples according to the amount of energy spectral density computed for each record. The samples with energy spectral density lower than $-0.85$ are passed to the decision Node 2 which provides a rule for the amount of Skewness of signals. Node 4 then filters the samples with value of Maximum less than $-0.83$ which will be assigned to the green star node.
决策树最左侧的子节点(用绿色星号表示)包含来自类别1(存活患者)的记录。高亮路径显示了满足图中三个规则的记录。第一条规则根据每条记录计算出的能量谱密度 (energy spectral density) 对样本进行划分。能量谱密度低于$-0.85$的样本被传递到决策节点2,该节点提供了信号偏斜度 (Skewness) 的规则。接着,节点4筛选出最大值 (Maximum) 小于$-0.83$的样本,这些样本将被分配到绿色星号节点。
The averaged power, the 11th feature, has been selected as the root of the tree with the highest Gini index. This result shows that using the averaged power features may be promising in early mortality predictions. To further scrutinize the effects of individual features in the decision tree, the estimate of predictor importance is computed. It sums up changes in the risk caused by splits on every independent variable and divides the total result by the number of branch nodes (the tree nodes without any children). Indeed, this sum is taken over the best splits found at each branch node. The importance of features according to this separation is computed as the difference between the risk for the parent node and the sum of risks for its children.
平均功率(第11个特征)因其基尼指数最高而被选为决策树的根节点。这一结果表明,使用平均功率特征在早期死亡率预测中可能具有潜力。为了进一步分析各特征在决策树中的影响,我们计算了预测变量重要性估计值。该指标通过对每个自变量分割带来的风险变化求和,再除以分支节点(无子节点的树节点)数量得出。具体而言,该求和过程基于各分支节点找到的最佳分割点。特征重要性根据分割前后风险差值计算,即父节点风险与其子节点风险总和之差。
The risk of splitting for each node is composed of the impurity measurement and the node probability. As explained before, we employed the Gini index as the impurity measurement which has less computational complexity in comparison to the information gain. Also, node probability is defined as the number of records reaching the node, divided by the total number of records. Then, the risk of splitting for node $\mathbf{X}$ is computed as follows.
每个节点的分裂风险由不纯度度量和节点概率组成。如前所述,我们采用基尼系数 (Gini index) 作为不纯度度量,相比信息增益具有更低计算复杂度。节点概率定义为到达该节点的记录数除以总记录数。节点 $\mathbf{X}$ 的分裂风险计算如下:

Figure 4: The decision tree model comprises decision and leaf nodes represented by triangles and the dots, respectively. The green star shows the left-most leaf node of the model.
图 4: 决策树模型由三角形和圆点分别表示的决策节点和叶节点组成。绿色星号标记了模型最左侧的叶节点。
$$
R i s k(x)=G D I(x)\times P r o b a b i l i t y(x)
$$
$$
R i s k(x)=G D I(x)\times P r o b a b i l i t y(x)
$$
The estimate of predictor importance for a certain feature is directly associated with the $G D I$ gap between the node corresponding to that feature and its children. This estimation assigns higher importance to features which lead to the largest number of pure children (i.e. terminal nodes). This estimation allots greater importance to the features which have influence on a larger portion of the records. As a result, the feature comprising the root node (in this case the Averaged Power from Figure 4) has higher probability than other features that define rules at lower levels. It allows the feature of the root node to be considered as one of the most important features.
某个特征在预测器中的重要性估计直接关联于该特征对应节点与其子节点间的$G D I$差距。这一评估方法会将更高的重要性赋予那些能产生最多纯子节点(即终端节点)的特征。同时,对更大比例记录产生影响的特征也会被分配更高权重。因此,根节点所包含的特征(本例中为图4的平均功率)比定义较低层级规则的其他特征具有更高概率,这使得根节点特征被视为最重要的特征之一。
The energy spectral density, averaged power, and range are found to be the most important features in the mortality prediction based on the heart rate signal (Figure 5). As described above, the averaged power is one of the most important features since it is placed as the root of the decision tree. However, the energy spectral density gained the highest score of importance in comparison to the other features. Hence, the nodes corresponding to the energy spectral density feature have higher amount of $G D I$ compared to their children. As a matter of fact, this is a sign of high $G D I$ gap between these nodes and their children.
基于心率信号的死亡率预测中,能量谱密度 (energy spectral density) 、平均功率 (averaged power) 和范围被证实是最重要的特征 (图 5) 。如前所述,平均功率因其被置于决策树的根节点而成为最关键特征之一。然而与其他特征相比,能量谱密度获得了最高的重要性评分。因此,对应能量谱密度特征的节点比其子节点拥有更高的 $G D I$ 值。实际上,这表明这些节点与其子节点之间存在显著的 $G D I$ 差距。
The energy spectral density provides basic information about the power variation in frequency components comprising the original signal within a finite interval. Since the power spectral density employs Fourier transform to decompose original signals into a spectrum of frequencies, it can reflect the parasympathetic and sympathetic activities which are highly correlated to the fluctuation of frequency components of heart signals. It has been reported [37] that the high-frequency component reflects parasympathetic nervous activity, while the ratio of
能量谱密度提供了有限区间内构成原始信号的频率分量功率变化的基本信息。由于功率谱密度采用傅里叶变换将原始信号分解为频谱,它能反映与心脏信号频率分量波动高度相关的副交感和交感神经活动。据文献[37]报道,高频分量反映副交感神经活动,而

Figure 5: Feature importance in the proposed model for mortality prediction based on heart rate signal
图 5: 基于心率信号的死亡率预测模型中各特征的重要性
low-frequency over the high-frequency components reflects sympathetic nervous activity. Hence, a combination of frequency-domain (e.g. energy spectral density) and time-domain signal analysis (such as skewness) enables us to separate CCU patients who survive or pass away.
低频成分相对于高频成分的优势反映了交感神经活动。因此,结合频域(如能量谱密度)和时域信号分析(如偏度)能够区分出CCU患者中的存活者与离世者。
5. Conclusion and Future Work
5. 结论与未来工作
Early hospital risk of mortality prediction in CCU units is critical due to the need for quick and accurate medical decisions. This paper proposes a new signal-based model for early mortality prediction, leveraging the benefits of statistical and signal-based features. Our method is a clinical decision support system which focuses on using only the heart rate signal instead of other health variables such physical state or presence of chronic diseases. Since such variables require laboratory test results which could delay the decision-making time or may not be available at the time of admission, our proposed method may give faster feedback to healthcare professionals working in CCUs. We demonstrate the capability of using statistical and signal-based features, especially the energy-based features of heart rate signals, to distinguish between patients who survive or pass away in the CCU. Among the interpret able class if i ers, the decision tree achieved the highest accuracy, allowing for both accurate and explain able outcomes.
CCU病房的早期院内死亡风险预测对快速准确的医疗决策至关重要。本文提出了一种新型基于信号的早期死亡率预测模型,结合统计特征与信号特征的优点。我们的临床决策支持系统仅聚焦心率信号,无需依赖体格状态或慢性病史等其他健康变量。由于此类变量需等待实验室检测结果(可能延误决策时机)或入院时无法获取,本方案能为CCU医护人员提供更快速的反馈。我们验证了利用统计特征与信号特征(特别是心率信号的能量特征)区分CCU存活与死亡患者的可行性。在可解释分类器中,决策树实现了最高准确率,兼具精确性与结果可解释性。
In our future work, we plan to apply our proposed method over other intensive care units, incorporating multiple vital signals along with the heart rate signal as a means to better understand the cause of mortality. The study also can be extended to develop a framework using sensors, laboratory data, and information cached from in tens iv is ts and nurses’ reports using knowledge graph [38] and text mining [39]. Another direction is to explore the effect of computing features from vital signals with different length of windows and using dynamic feature selections [40][41]. Finally, we plan on creating a real-time mortality prediction system based on the variability of physiological signals [42] that can predict patient outcomes for early intervention.
在我们未来的工作中,计划将所提出的方法应用于其他重症监护单元,整合心率信号外的多种生命体征信号,以更深入地理解死亡原因。该研究还可扩展为开发一个框架,利用传感器数据、实验室数据以及通过知识图谱 [38] 和文本挖掘 [39] 从医护人员报告中缓存的信息。另一个方向是探索不同时间窗口长度下生命体征信号计算特征的效果,并采用动态特征选择 [40][41]。最后,我们计划基于生理信号变异性 [42] 构建实时死亡率预测系统,以实现早期干预的患者结局预测。
Supplementary Material
补充材料
The source code is available at: https://github.com/Rez aS a deg hi WSU/Early-Hospital-Mortality-Prediction-usingVital-Signals
源代码位于:https://github.com/Rez aS a deg hi WSU/Early-Hospital-Mortality-Prediction-usingVital-Signals