Analyzing Covariate Influence on Gender and Race Prediction from Near-Infrared Ocular Images
分析近红外眼图像中协变量对性别和种族预测的影响
Denton Bobeldyk and Arun Ross Preprint title: Predicting Gender and Race from Near Infrared Iris and Periocular Images
Denton Bobeldyk 和 Arun Ross 预印本标题:从近红外虹膜和眼周图像预测性别和种族
Abstract—Recent research has explored the possibility of auto mati call y deducing information such as gender, age and race of an individual from their biometric data. While the face modality has been extensively studied in this regard, the iris modality less so. In this paper, we first review the medical literature to establish a biological basis for extracting gender and race cues from the iris. Then, we demonstrate that it is possible to use simple texture descriptors, like BSIF (Binarized Statistical Image Feature) and LBP (Local Binary Patterns), to extract gender and race attributes from an NIR ocular image used in a typical iris recognition system. The proposed method predicts gender and race from a single eye image with an accuracy of $86%$ and $90%$ , respectively. In addition, the following analysis are conducted: (a) the role of different parts of the ocular region on attribute prediction; (b) the influence of gender on race prediction, and vice-versa; (c) the impact of eye color on gender and race prediction; (d) the impact of image blur on gender and race prediction; (e) the general iz ability of the method across different datasets; and (f) the consistency of prediction performance across the left and right eyes.
摘要—最近的研究探索了从生物特征数据中自动推断个体性别、年龄和种族等信息的可能性。虽然面部模态在这方面得到了广泛研究,但虹膜模态的研究相对较少。本文首先回顾了医学文献,以确立从虹膜中提取性别和种族线索的生物学基础。然后,我们证明了可以使用简单的纹理描述符,如BSIF(二值化统计图像特征)和LBP(局部二值模式),从典型的虹膜识别系统中使用的近红外(NIR)眼部图像中提取性别和种族属性。所提出的方法从单张眼部图像中预测性别和种族的准确率分别为$86%$和$90%$。此外,还进行了以下分析:(a) 眼部区域不同部分在属性预测中的作用;(b) 性别对种族预测的影响,反之亦然;(c) 眼睛颜色对性别和种族预测的影响;(d) 图像模糊对性别和种族预测的影响;(e) 该方法在不同数据集上的泛化能力;(f) 左右眼预测性能的一致性。
I. INTRODUCTION
I. 引言
A. Iris Recognition System
A. 虹膜识别系统
A biometric system utilizes the physical or behavioral traits of an individual to automatically recognize an individual [2]. Examples of such traits include face, fingerprint, iris, voice and gait. The focus of this paper is on the iris biometric trait. The iris is the colored and richly textured annular region of the eye surrounding the pupil (see Figure 1). The rich texture of dark colored irides is not easily discernible in the visible wavelength; therefore, the iris is typically imaged in the Near Infrared (NIR) spectrum since longer wavelengths tend to penetrate deeper into the multi-layered iris structure thereby eliciting the texture of even dark-colored eyes. Further, the NIR image acquisition process does not excite the pupil, thereby ensuring that the iris texture is not unduly deformed due to pupil dynamics [3].
生物识别系统利用个体的生理或行为特征来自动识别个体 [2]。这些特征的例子包括面部、指纹、虹膜、声音和步态。本文的重点是虹膜生物识别特征。虹膜是眼睛中围绕瞳孔的有色且纹理丰富的环形区域(见图 1)。深色虹膜的丰富纹理在可见光波长下不易辨别;因此,虹膜通常在近红外 (NIR) 光谱中成像,因为较长的波长往往能更深入地穿透多层虹膜结构,从而揭示深色眼睛的纹理。此外,NIR 图像采集过程不会刺激瞳孔,从而确保虹膜纹理不会因瞳孔动态而过度变形 [3]。
B. Predictable Attributes from NIR Ocular Images
B. 从近红外眼部图像中可预测的属性
In addition to performing the task of recognizing an individual [4], it is possible to predict attributes about the individual, such as gender, race and age, from the raw biometric data itself. These attributes are referred to as soft biometrics [5]. Soft biometric attributes may not be disc rim i native enough to uniquely identify an individual, but can be used to increase the recognition accuracy of a biometric system [6]. In addition to increased performance, there are several other motivating factors to glean these attributes from the raw biometric data.
除了执行识别个体的任务 [4],还可以从原始生物特征数据本身预测个体的属性,如性别、种族和年龄。这些属性被称为软生物特征 [5]。软生物特征属性可能不足以唯一识别个体,但可以用来提高生物特征系统的识别准确率 [6]。除了提高性能外,从原始生物特征数据中提取这些属性还有其他几个动机因素。
Firstly, databases containing biometric data could be automatically processed and the soft biometric information aggregated (e.g., proportion of Asian Males in a database). The aggregated information could then be used for statistical descriptions of the database or to index the database for faster retrieval of identities. Secondly, a semantic description of an individual (e.g., ”Middle-aged Caucasian Male”) can be automatically generated from a single biometric sample that could prove useful in forensic applications to either reduce the list of potential matching candidates or to exclude a suspect from the search. Thirdly, soft biometric attributes may be beneficial in scenarios where the input image does not lend itself to the identity recognition task. For example, out-of-focus iris images may result in poor recognition accuracy while still allowing for the extraction of attributes such as gender and race. Fourthly, soft biometric attributes can potentially enable cross-spectral recognition, where images acquired in the NIR spectrum have to be compared against their visible spectrum counterparts [7].
首先,包含生物特征数据的数据库可以自动处理,并汇总软生物特征信息(例如,数据库中亚洲男性的比例)。汇总后的信息可用于数据库的统计描述或索引数据库以加快身份检索速度。其次,可以从单个生物特征样本中自动生成个体的语义描述(例如,“中年白人男性”),这在法医应用中可能有助于减少潜在匹配候选人的列表或将嫌疑人排除在搜索之外。第三,软生物特征属性在输入图像不适合身份识别任务的情况下可能有益。例如,失焦的虹膜图像可能导致识别准确性较差,但仍允许提取性别和种族等属性。第四,软生物特征属性可能实现跨光谱识别,其中在近红外光谱中获取的图像必须与其可见光谱对应物进行比较 [7]。
The work discussed in this paper will focus specifically on the prediction of gender1 and $\mathrm{race}^{2}$ from NIR ocular images typically used in iris recognition systems. Some sample NIR ocular images with the race and gender label are displayed in Figure 2. The prediction of attributes from other biometric traits has also been actively studied in the literature (see Table I). There is also related attribute prediction research from visible spectrum ocular images [10], [11], [12] and [13].
本文讨论的工作将特别关注从通常用于虹膜识别系统的近红外 (NIR) 眼部图像中预测性别和种族。图 2 展示了一些带有种族和性别标签的近红外眼部图像样本。从其他生物特征中预测属性的研究也在文献中得到了积极探讨(见表 I)。此外,还有从可见光谱眼部图像中进行相关属性预测的研究 [10], [11], [12] 和 [13]。
C. Ocular Anatomy
C. 眼部解剖
A discussion of the ocular anatomy is useful in understanding the type of gender and race markers present in the ocular region. The ocular region could be defined as the region housing the eye (see Figure 3). The eyeball has both upper and lower eyelids that provide a protective and lub ric at ive function to the eyeball. The upper eyelid contains the levator palpebrae superioris, which is the muscle that allows the eye to blink [19]. The gap between the upper and lower eyelid is the palpebral fissure. The iris and pupil region are located between the upper and lower eyelids.
讨论眼部解剖结构有助于理解眼部区域存在的性别和种族标记类型。眼部区域可以定义为包含眼睛的区域(见图 3)。眼球有上下眼睑,为眼球提供保护和润滑功能。上眼睑包含提上睑肌,这是使眼睛能够眨眼的肌肉 [19]。上下眼睑之间的间隙称为睑裂。虹膜和瞳孔区域位于上下眼睑之间。
Previous research has established the distinctiveness of the iris patterns of an individual [20]. The iris texture is imparted
先前的研究已经证实了个体虹膜模式的独特性 [20]。虹膜纹理是由
1The terms ‘gender’ and ‘sex’ have been used interchangeably in the biometric literature. There is, however, a specific definition provided by the Health and Medicine Division of the National Academies of Science, Engineering and Medicine. They state that sex is biologically or genetically determined, while gender is culturally determined [8].
1在生物识别文献中,"性别"和"性"这两个术语经常被互换使用。然而,美国国家科学、工程和医学院的健康与医学部门提供了一个具体的定义。他们指出,性是由生物学或遗传学决定的,而性别是由文化决定的 [8]。
2The terms ‘ethnicity’ and ‘race’ have been used interchangeably in related biometric literature. An exact definition of either of these two terms appears to be debatable, and further information can be found in [9].
在相关的生物识别文献中,“ethnicity”和“race”这两个术语经常被互换使用。这两个术语的确切定义似乎存在争议,更多信息可以参考 [9]。
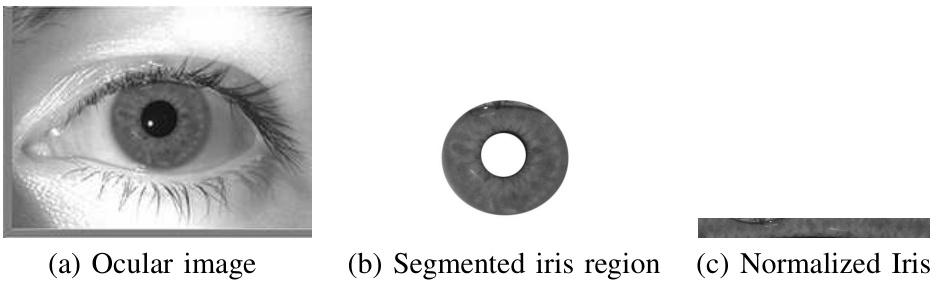
Fig. 1: The process of iris recognition typically involves (a) imaging the ocular region of the eye using an NIR camera, (b) segmenting the annular iris region from the ocular image, and (c) unwrapping the annular iris region into a fixed-size rectangular entity referred to as normalized iris. Image (a) is from [1].
图 1: 虹膜识别的过程通常包括 (a) 使用近红外 (NIR) 相机拍摄眼睛的眼部区域图像,(b) 从眼部图像中分割出环形虹膜区域,以及 (c) 将环形虹膜区域展开为固定大小的矩形实体,称为归一化虹膜。图像 (a) 来自 [1]。
TABLE I: Examples of attribute prediction using different biometric traits.
表 1: 使用不同生物特征进行属性预测的示例
| 特征 | 属性 | 使用的方法 | 数据集 (#图像/#对象) | 预测准确率 | 参考文献 |
|---|---|---|---|---|---|
| 身体 | 性别 | 基于 SVM 的序列图 | HumanID (100 对象) | 96.7% | [14] |
| 面部 | 年龄 | LBP, HOG, 生物启发特征与非线性 SVM | YGA (8000 图像) | 94.9% | [15] |
| 近红外面部 | 性别 | LBP 与 SVM | CBSR NIR (3200 图像) | 93.59% | [16] |
| 指纹 | 性别 | 离散小波变换, 小波分析 | 私有 (498 图像) | 96.59% | [17] |
| 面部 | 种族 | 2D 和 3D 多尺度多比例 LBP 与 Adaboost | FRGCv2.0 (180 对象) | 99.5% | [18] |
by an agglomeration of several anatomical features: stroma, Fuchs’ crypts, Wolfflin nodules, pigmentation dots, and contraction furrows, to name a few. The anterior portion of the iris has two distinct zones, the pupillary zone and the ciliary zone, that are separated by the collarette. There are some correlations between features that are present in the iris. For example, an iris that has no Fuchs’ crypts may have clearly distinguishable contraction furrows [21]. A decrease in the density of the stroma has been observed as the number of Fuchs’ crypts increases. As the density decreases, the contraction furrows has been observed to decrease.
虹膜由多个解剖特征聚集而成:基质、Fuchs隐窝、Wolfflin结节、色素点和收缩沟等。虹膜的前部有两个明显的区域,即瞳孔区和睫状区,它们由虹膜领分隔。虹膜中的特征之间存在一些相关性。例如,没有Fuchs隐窝的虹膜可能具有明显可辨的收缩沟 [21]。随着Fuchs隐窝数量的增加,基质的密度会降低。随着密度的降低,收缩沟的数量也会减少。
The medical literature suggests both geometric and textural difference between male and female irides. From a textural perspective, Larsson and Pederson [22] found that males have a greater number of Fuchs’ crypts than females. From a geometric perspective, Sanchis et. al [23] report that the pupil diameters are greater in emmetropic females.3
医学文献表明,男性和女性的虹膜在几何和纹理上存在差异。从纹理角度来看,Larsson 和 Pederson [22] 发现男性的 Fuchs 隐窝数量多于女性。从几何角度来看,Sanchis 等人 [23] 报告称,正视眼女性的瞳孔直径更大。
If the entire ocular region is considered (and not just the iris), it has been found that the lacrimal glands of men are $30%$ larger and contain $45%$ more cells than those of females [24]. There are also significant corneal differences in that women have steeper corneas4 than men and their corneas are also thinner [25][24]. Other differences in the cornea include “diameter, curvature, thickness, sensitivity and wetting time of the cornea” [25]. While a number of the aforementioned features may not manifest themselves in a 2D NIR ocular image, we hypothesize that the texture of the ocular region, including the iris, may offer gender (or sex) cues of an individual.
如果考虑整个眼部区域(而不仅仅是虹膜),研究发现男性的泪腺比女性大 $30%$,并且细胞数量多 $45%$ [24]。角膜方面也存在显著差异,女性的角膜比男性更陡峭且更薄 [25][24]。其他角膜差异包括“直径、曲率、厚度、敏感性和湿润时间” [25]。虽然上述许多特征可能不会在二维近红外(NIR)眼部图像中显现,但我们假设包括虹膜在内的眼部区域的纹理可能提供个体的性别线索。
There exists textural differences in the iris between races as well. Edwards et al. [26] examined images of irides in the visible spectrum from 3 separate populations: South Asian, East Asian and European. Europeans were found to have a higher grade5 of Fuchs’ crypts, more pigment spots, more extended contraction furrows, and more extended Wolfflin nodules than East Asians [26]. East Asians were found to have a lower grade of Fuchs’ crypts than both Europeans and South Asians. Europeans had the largest iris width, followed by South Asians, and then by East Asians [26]. As for eye color, East Asians had the darkest while Europeans had the lightest.
不同种族之间虹膜的纹理也存在差异。Edwards 等人 [26] 研究了来自三个不同种族群体(南亚人、东亚人和欧洲人)的可见光谱虹膜图像。研究发现,欧洲人比东亚人具有更高等级的 Fuchs 隐窝、更多的色素斑点、更广泛的收缩沟和更广泛的 Wolfflin 结节 [26]。东亚人的 Fuchs 隐窝等级低于欧洲人和南亚人。欧洲人的虹膜宽度最大,其次是南亚人,最后是东亚人 [26]。至于眼睛颜色,东亚人的眼睛颜色最深,而欧洲人的眼睛颜色最浅。
D. Paper Contributions
D. 论文贡献
This article focuses on the covariate influence of predicting race and gender from the ocular region using simple texture descriptors. Thus, the contributions of the paper are as follows:
本文重点研究了使用简单的纹理描述符从眼部区域预测种族和性别的协变量影响。因此,本文的贡献如下:
• The prediction accuracies due to the iris-only region is contrasted with that of the extended ocular region for both race and gender using multiple texture descriptors. • Determine whether eye location (i.e., left or right eye) has a significant impact on gender and race prediction. • Determine whether Caucasian or Non-Caucasian subjects exhibit higher gender prediction accuracy
- 使用多种纹理描述符对比虹膜区域和扩展眼部区域在种族和性别预测中的准确性。
- 确定眼睛位置(即左眼或右眼)对性别和种族预测是否有显著影响。
- 确定白种人或非白种人在性别预测中是否表现出更高的准确性。
$^5\mathrm{{In}}$ their work, the authors defined 4 categories of Fuchs’ crypts. Category 1 contains no crypts, while category 4 contains ‘at least three large crypts located in three or more quadrants of the iris’ [26].
$^5\mathrm{{In}}$ 在他们的工作中,作者定义了 Fuchs 隐窝的 4 个类别。类别 1 不包含隐窝,而类别 4 包含“至少三个位于虹膜三个或更多象限中的大隐窝” [26]。
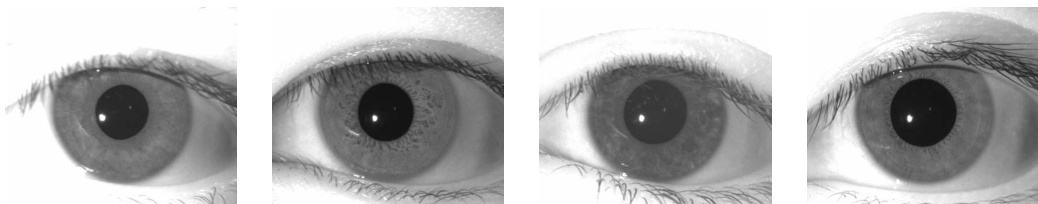
Fig. 2: Examples of ocular images pertaining to different categories of individuals. From Left to Right: male Caucasian, male Non-Caucasian, female Caucasian, female Non-Caucasian. The images are from [1].
图 2: 不同类别个体的眼部图像示例。从左到右:男性高加索人、男性非高加索人、女性高加索人、女性非高加索人。图像来自 [1]。
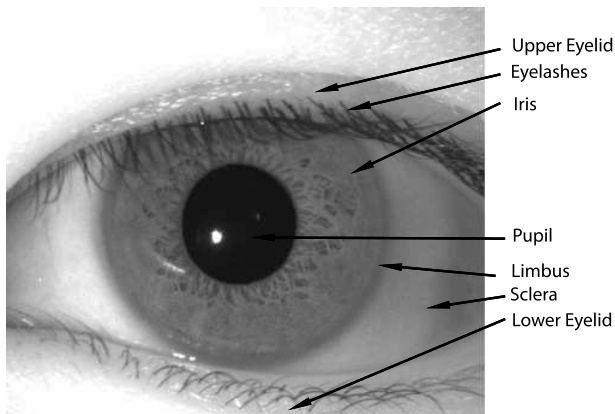
Fig. 3: An NIR image depicting the various parts of the ocular region.
图 3: 一张展示眼部区域各个部分的近红外图像。
The rest of the paper is organized as follows: Section II discusses related work in the field. Section III discusses the proposed feature extraction method. Section IV describes the datasets that were used. Section V discusses the experiments conducted and the associated results. Section VI discusses the experimental results and summarizes the findings of this work. Section VII provides a list of future directions for this research.
本文的其余部分组织如下:第二部分讨论了该领域的相关工作。第三部分讨论了提出的特征提取方法。第四部分描述了所使用的数据集。第五部分讨论了进行的实验及相关结果。第六部分讨论了实验结果并总结了本工作的发现。第七部分列出了本研究的未来方向。
II. RELATED WORK
II. 相关工作
The problem of attribute prediction, be it gender or race, is typically posed as a pattern classification problem where a feature set extracted from the biometric data (e.g., an ocular image) is input to a classifier (e.g., SVM, decision tree, etc.) in order to produce the attribute label (e.g., ‘Male’). The classifier itself is trained in a supervised manner with a training set consisting of ocular data labeled with attributes. The performance of the prediction algorithm is then evaluated on an independent test set. Good practice [27] dictates that the subjects in the training set and test set be mutually exclusive. An optimally biased predictor can be produced if there is an overlap of subjects in the training and test sets as indicated in [28], [29]. While most recent work in attribute prediction from iris have clearly adopted a subject-disjoint protocol [28], [29], [30], [31], some of the earlier papers on this topic have been ambiguous on this front [32], [33], [34], [35]. Table II and Table IV, respectfully, summarize the previous work on gender and race prediction from a single NIR image. Table III summarizes the gender prediction work that use images from both the left and right eyes in a fusion framework.
属性预测问题,无论是性别还是种族,通常被表述为一个模式分类问题,其中从生物特征数据(例如,眼部图像)中提取的特征集被输入到分类器(例如,支持向量机 (SVM)、决策树等)以生成属性标签(例如,“男性”)。分类器本身是通过监督学习的方式训练的,训练集由带有属性标签的眼部数据组成。然后在一个独立的测试集上评估预测算法的性能。良好的实践 [27] 要求训练集和测试集中的受试者互不重叠。如果在训练集和测试集中存在受试者重叠,则可以产生一个最优偏置的预测器,如 [28]、[29] 所示。尽管最近在虹膜属性预测方面的工作明确采用了受试者分离协议 [28]、[29]、[30]、[31],但早期的一些论文在这方面存在模糊性 [32]、[33]、[34]、[35]。表 II 和表 IV 分别总结了从单一近红外 (NIR) 图像中进行性别和种族预测的先前工作。表 III 总结了在融合框架中使用左右眼图像进行性别预测的工作。
A. Gender
A. 性别
One of the earliest work in prediction of gender from the iris was published by Thomas et al. [32]. The authors assembled a dataset of 57, 137 ocular images. The iris was extracted from each of the ocular images and normalized into a $20\times240$ image using Daugman’s rubber sheet method [20]. A feature vector was generated from the normalized image by applying a one dimensional Gabor filter. Feature selection was performed using an information gain metric. The resulting reduced feature vector was classified as ‘Male’ or ‘Female’ by a decision tree algorithm. Only left iris images were used for their experiments. The authors were able to achieve an accuracy that was ‘upwards of $80%$ with Bagging’ 7 using only the Caucasian subjects in their dataset.8
最早从虹膜预测性别的研究之一由 Thomas 等人 [32] 发表。作者收集了包含 57,137 张眼部图像的数据集。使用 Daugman 的橡皮筋方法 [20],从每张眼部图像中提取虹膜并将其归一化为 $20\times240$ 的图像。通过应用一维 Gabor 滤波器,从归一化图像中生成特征向量。使用信息增益度量进行特征选择。最终通过决策树算法将降维后的特征向量分类为“男性”或“女性”。实验中仅使用了左眼虹膜图像。作者仅使用数据集中白种人的数据,通过 Bagging 方法实现了“超过 $80%$ 的准确率”。
Bansal et al. [33] were able to achieve an $83.06%$ gender classification accuracy using statistical and wavelet features along with an SVM classifier. Occlusions from the iris region were removed (i.e., eyelids, eyelashes) using a masking algorithm. The size of their dataset, however, was quite small with only 150 subjects and 300 iris images. 100 of the subjects were male and 50 of the subjects were female. However, it is not clear if they used a subject-disjoint evaluation protocol.
Bansal 等人 [33] 使用统计和小波特征以及 SVM 分类器,能够实现 83.06% 的性别分类准确率。他们使用掩码算法去除了虹膜区域的遮挡(即眼睑、睫毛)。然而,他们的数据集规模较小,仅有 150 名受试者和 300 张虹膜图像。其中 100 名受试者为男性,50 名为女性。然而,尚不清楚他们是否使用了受试者不重叠的评估协议。
Lagree and Bowyer performed gender classification on a dataset of 600 iris images each of which was normalized to a $40\times240$ rectangular image. 8 horizontal regions of 5-pixel
Lagree 和 Bowyer 在一个包含 600 张虹膜图像的数据集上进行了性别分类,每张图像都被归一化为 $40\times240$ 的矩形图像。8 个水平区域,每个区域为 5 像素。
6The published paper claims 1500 subjects; however it was discovered during our experiments that there was actually far less number of subjects. The authors confirmed their error via email and in one of their subsequent publications [29].
已发表的论文声称有1500名受试者;然而,在我们的实验过程中发现,实际受试者数量远少于这个数字。作者通过电子邮件确认了他们的错误,并在他们的一篇后续出版物中进行了说明 [29]。
$^{7}\mathrm{{It}}$ was not stated whether a subject-disjoint training and test set were used $^8\mathrm{A}$ prediction accuracy of $75%$ was achieved using all of the images
$^{7}\mathrm{{It}}$ 未说明是否使用了主题不相交的训练和测试集
$^8\mathrm{A}$ 使用所有图像时达到了 $75%$ 的预测准确率
TABLE II: Gender Prediction - Related Work (Left or Right Eye Image).
表 II: 性别预测 - 相关工作 (左眼或右眼图像)。
| 作者 | 年份 | 是否指定主体分离 | 数据集 | 主体数量 | 图像数量 | 特征 | 预测准确率 |
|---|---|---|---|---|---|---|---|
| Thomas 等 [32] | 2007 | 否 | 私有 | 未知 | 57,137 | 几何/纹理特征 | 80% |
| Bansal 等 [33] | 2012 | 否 | 私有 | 150 | 300 | 统计/纹理特征 | 83.06% |
| Singh 等 [36] | 2017 | 否 | ND-Iris-0405 | 356 | 60,259 | 深度类别编码器 | 82.53% |
| Singh 等 [36] | 2017 | 是 | GFI | 1500 | 3000 | 深度类别编码器 | 83.17% |
| Lagree & Bowyer [37] | 2011 | 是 | 私有 | 120 | 1200 | 基本纹理滤波器 | 62% |
| Fairhurst 等 [38] | 2015 | 是 | BioSecure | 200 | 1600 | 几何和纹理特征 | 81.43% |
| Bobeldyk & Ross [28] | 2016 | 是 | 私有 | 1083 | 3314 | BSIF | 85.7% |
| Kuehlkamp 等 [39] | 2017 | 是 | GFI | 1500 | 3000 | CNN 和 MLPs | 80% |
| Tapia 等 [12] | 2017 | 是 | CROSS-EYED | 120 | 1920 | HOG 特征选择 | 90.0% |
| 本工作 | 2018 | 是 | GFI | 1500 | 3000 | BSIF | 84.4% |
| 本工作 | 2018 | 是 | BioCOP2009 | 1096 | 41,780 | BSIF | 86.0% |
Work that uses the publicly available GFI dataset are highlighted for ease of comparison TABLE III: Gender Prediction - Related Work (Left $^+$ Right Eye Fusion)
表 III: 性别预测 - 相关工作 (左眼 $^+$ 右眼融合)
| 作者 | 年份 | 是否指定了不重叠的受试者 | 数据集 | 受试者数量 | 图像数量 | 特征 | 预测准确率 |
|---|---|---|---|---|---|---|---|
| Tapia et al. [40] | 2014 | 否 | GFI | 15006 | 3000 | 均匀LBP | 91.33% |
| Tapia et al. [29] | 2016 | 是 | GFI | 1500 | 3000 | Iriscode 和加权特征选择 | 89% |
| Tapia et al. [41] | 2017 | 是 | GFI | 1500 | 3000 | 左右眼CNN融合 | 84.66% |
| Tapia&Aravena [30] | 2018 | 是 | GFI | 1500 | 3000 | CNN (LeNet的简化版本) | 87.26% |
width and 10 vertical regions of 24-pixel width were then created. Using the created regions and some simple texture filters (i.e., for detecting spots, lines), an 882-dimensional feature vector was computed. An SVM classifier was then applied (specifically the WEKA SMO algorithm) for classification, achieving a $62%$ accuracy.
然后创建了10个水平区域,每个区域高度为24像素,以及10个垂直区域,每个区域宽度为24像素。使用这些创建的区域和一些简单的纹理过滤器(例如用于检测斑点、线条),计算了一个882维的特征向量。随后应用了SVM分类器(具体为WEKA SMO算法)进行分类,达到了62%的准确率。
Tapia et al. [29] extended their earlier work [40] to determine if the iriscode9 contained sex predictive information. Using an SVM classifier on the iriscode they obtained a $77.3%$ accuracy for the left iris and a $74.66%$ accuracy for the right iris. Their previous work in [40] did not use a subject-disjoint training/testing dataset resulting in an ‘accuracy of $87.33%$ for the left iris and $84.66%$ for the right iris.’ The accuracy was artificially high due to a labeling error in the dataset which did not allow for a subject-disjoint training/testing dataset [29]. The method in [29] improved upon their results by applying fusion between the left and right iriscodes using Weighted Conditional Mutual Information Maximization fusion which resulted in an $89.00\pm0.68%$ prediction accuracy. Tapia et al. [41] continued their work on deducing gender from iris by utilizing a CNN architecture that fused normalized iris images from the left and right eyes and were able to achieve an $84.66%$ accuracy. Tapia et al. [41] cited the small size of their dataset as a possible reason for their performance not surpassing that of their previous work [29]. In [30], Tapia & Aravena proposed a CNN architecture that fused the left and right periocular NIR images together. The model utilized three CNNs: one for the left eye, one for the right eye and one to fuse the left and right eye models together. They were able to achieve an $87.26%$ prediction accuracy.
Tapia 等人 [29] 扩展了他们之前的工作 [40],以确定 iriscode9 是否包含性别预测信息。他们在 iriscode 上使用 SVM 分类器,获得了左眼虹膜 $77.3%$ 的准确率和右眼虹膜 $74.66%$ 的准确率。他们之前的工作 [40] 没有使用主体分离的训练/测试数据集,导致左眼虹膜的准确率为 $87.33%$,右眼虹膜的准确率为 $84.66%$。由于数据集中的标签错误,准确率被人为地提高,这不允许使用主体分离的训练/测试数据集 [29]。[29] 中的方法通过使用加权条件互信息最大化融合对左右眼 iriscode 进行融合,改进了他们的结果,预测准确率达到 $89.00\pm0.68%$。Tapia 等人 [41] 继续他们的工作,通过利用 CNN 架构融合左右眼的归一化虹膜图像来推断性别,并能够达到 $84.66%$ 的准确率。Tapia 等人 [41] 提到他们数据集的小规模可能是其性能未超过之前工作 [29] 的原因。在 [30] 中,Tapia 和 Aravena 提出了一种 CNN 架构,将左右眼的近红外 (NIR) 图像融合在一起。该模型使用了三个 CNN:一个用于左眼,一个用于右眼,另一个用于融合左右眼模型。他们能够达到 $87.26%$ 的预测准确率。
Most biometric recognition work pertaining to NIR iris images have focused on extracting the iris region from the captured ocular image (see Figure 1). Thus, algorithms for soft biometric prediction have typically focused on the iris region rather than the extended ocular region (see Figure 4). Recent work [28] based on the Binarized Statistical Image Feature (BSIF) descriptor has shown that the extended ocular region commonly imaged by iris recognition systems provides greater sex prediction accuracy than the iris-only region. Predicting soft biometric attributes from the ocular region provides one major advantage over the iris region in that it does not require a potentially error prone algorithm for iris region extraction. Bobeldyk and Ross [28] were able to achieve an $85.7%$ sex prediction accuracy using concatenated histograms from tesselated regions of the BSIF code computed from NIR ocular images.
大多数与近红外 (NIR) 虹膜图像相关的生物识别工作都集中在从捕获的眼部图像中提取虹膜区域(见图 1)。因此,软生物特征预测算法通常集中在虹膜区域,而不是扩展的眼部区域(见图 4)。最近基于二值化统计图像特征 (BSIF) 描述符的研究 [28] 表明,虹膜识别系统通常捕获的扩展眼部区域比仅虹膜区域提供了更高的性别预测准确率。从眼部区域预测软生物特征属性相比虹膜区域有一个主要优势,即它不需要可能容易出错的虹膜区域提取算法。Bobeldyk 和 Ross [28] 通过使用从近红外人眼图像计算的 BSIF 代码的分块区域的串联直方图,能够实现 85.7% 的性别预测准确率。
Fairhurst et al. [38] utilized geometric features from the ocular image and texture features from the normalized iris image and were able to achieve an $81.43%$ prediction accuracy on a subset of the BioSecure dataset consisting of 200 subjects and 1600 images.
Fairhurst 等人 [38] 利用了眼部图像的几何特征和归一化虹膜图像的纹理特征,在包含 200 名受试者和 1600 张图像的 BioSecure 数据集子集上实现了 $81.43%$ 的预测准确率。
Singh et al. [36] use a variant of an auto-encoder that includes the attribute class label alongside the reconstruction layer. They used NIR ocular images that were resized to $48\times64$ pixels. Their proposed method was tested on both the GFI and ND-Iris-0405 datasets from Notre Dame. The experiments on the GFI dataset utilized the 80-20 subjectdisjoint split specified in the dataset. While experiments using the ND-Iris-0405 dataset were not indicated as being subjectdisjoint, their paper states: ‘All protocols ensure mutually exclusive training and testing sets, such that there is no image [emphasis added] which occurs in both the partitions’.
Singh 等人 [36] 使用了一种变体的自编码器,该自编码器在重建层旁边包含了属性类别标签。他们使用了调整为 $48\times64$ 像素的近红外 (NIR) 眼部图像。他们提出的方法在 Notre Dame 的 GFI 和 ND-Iris-0405 数据集上进行了测试。在 GFI 数据集上的实验使用了数据集中指定的 80-20 主体分离划分。虽然使用 ND-Iris-0405 数据集的实验并未明确说明是否为主体分离,但他们的论文指出:“所有协议确保训练集和测试集互斥,因此没有任何图像 [强调] 同时出现在两个分区中。”
Kuehlkamp et al. [39] studied the effect of mascara on predicting gender from iris. Using only the occlusion mask from each of the images, they achieved a $60%$ gender prediction accuracy. They went on to show that LBP combined with an MLP network was able to achieve a $66%$ accuracy. Using the entire ‘eye’ image they were able to achieve around $80%$ using CNNs and MLPs.
Kuehlkamp 等人 [39] 研究了睫毛膏对从虹膜预测性别的影响。仅使用每张图像中的遮挡掩码,他们实现了 $60%$ 的性别预测准确率。他们进一步展示了 LBP 结合 MLP 网络能够实现 $66%$ 的准确率。使用完整的“眼睛”图像,他们通过 CNN 和 MLP 实现了约 $80%$ 的准确率。
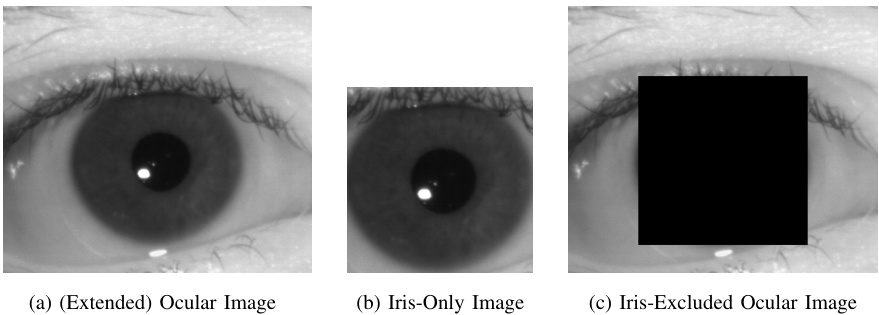
Fig. 4: The three different regions in an NIR ocular image that are independently considered for the gender and race prediction tasks. Images are from [1].
图 4: 在近红外 (NIR) 眼部图像中,性别和种族预测任务独立考虑的三种不同区域。图像来自 [1]。
Tapia et al. [30] used a feature selection model that was similar to their earlier work on iris [29], but applied to periocular images. They were able to achieve a $90.0%$ prediction accuracy on a dataset containing 120 subjects and 1920 images.
Tapia 等人 [30] 使用了一种特征选择模型,该模型与他们之前在虹膜上的工作 [29] 类似,但应用于眼周图像。他们在包含 120 个受试者和 1920 张图像的数据集上实现了 $90.0%$ 的预测准确率。
Previous work utilizing a single eye image (left or right) are displayed in Table II and those utilizing a fused model combining the left and right are shown in Table III. For ease of comparison, the works that utilized the publicly available GFI dataset are highlighted in Table II. The reported accuracy for our current work on the GFI dataset is based on a prediction model that was trained on the BioCOP2009 dataset (see Section V-B3).
先前利用单眼图像(左眼或右眼)的工作展示在表 II 中,而利用左右眼融合模型的工作则展示在表 III 中。为了方便比较,表 II 中突出显示了使用公开可用的 GFI 数据集的工作。我们在 GFI 数据集上报告的当前工作准确率基于在 BioCOP2009 数据集上训练的预测模型(见第 V-B3 节)。
It should also be noted that there are some gender prediction work using the periocular region in the visible wavelength spectrum in [10], [11], [12] and [13].
还应注意的是,在[10]、[11]、[12]和[13]中,有一些使用可见光波长光谱中的眼周区域进行性别预测的工作。
B. Race
B. 竞赛
There are only a few papers that attempt to deduce race from NIR iris images. In [34] and [35] the authors do not state whether their train and test partitions are subject-disjoint, and the size of the datasets are quite small (3982 and 2400 images, respectively). In both publications, Qiu et al. [34], [35] utilized the texture generated from Gabor filters to create a feature vector that was classified using AdaBoost and SVM (respectively) class if i ers. A smaller region within the captured iris image was used in order to minimize occlusions from eyelids or eyelashes.
只有少数论文尝试从近红外(NIR)虹膜图像中推断种族。在 [34] 和 [35] 中,作者并未说明他们的训练和测试分区是否是主体独立的,且数据集的规模相对较小(分别为 3982 和 2400 张图像)。在这两篇论文中,Qiu 等人 [34], [35] 利用 Gabor 滤波器生成的纹理创建特征向量,并分别使用 AdaBoost 和 SVM 分类器进行分类。为了减少眼睑或睫毛的遮挡,他们使用了捕获的虹膜图像中的较小区域。
Singh et al. [36] also did not specify a subject-disjoint experimental protocol. Their proposed method used a variant of an auto-encoder that includes the class label alongside the reconstruction layer. The experiments were performed on the ND-Iris-0405 dataset as well as a multi-ethnicity iris dataset composed of three separate datasets. Each class (Asian, Indian, Caucasian) was represented by a distinct dataset. They achieved a $94.33%$ prediction accuracy on the ND-Iris0405 dataset and $97.38%$ on the multi-ethnicity iris dataset. However, it is not clear if the multi-ethnicity results were optimistically biased due to the use of different datasets for the 3 classes. As pointed out by El Naggar and Ross [43], dataset-specific cues are often present in the images.
Singh 等人 [36] 也没有指定一个主体不相交的实验协议。他们提出的方法使用了一种变体的自编码器,该自编码器在重建层旁边包含了类别标签。实验在 ND-Iris-0405 数据集以及一个由三个独立数据集组成的多民族虹膜数据集上进行。每个类别(亚洲人、印度人、高加索人)由一个独立的数据集表示。他们在 ND-Iris-0405 数据集上达到了 $94.33%$ 的预测准确率,在多民族虹膜数据集上达到了 $97.38%$ 的准确率。然而,尚不清楚多民族结果是否由于对三个类别使用了不同的数据集而存在乐观偏差。正如 El Naggar 和 Ross [43] 所指出的,图像中通常存在数据集特定的线索。
To the best of our knowledge, Lagree and Bowyer [37] were the first to look at the impact of gender on race prediction. Race was predicted by training and testing on images from only female subjects, as well as images from only male subjects. They were able to achieve an $82.8%$ race prediction accuracy using only female subjects, and a $92%$ accuracy using only male subjects. Using all of the images (both male and female) their best prediction accuracy was $87.6%$ . Using a slightly larger dataset, they achieved a $90.58%$ accuracy for a mixed male and female dataset.
据我们所知,Lagree 和 Bowyer [37] 是第一个研究性别对种族预测影响的人。他们通过仅使用女性受试者的图像以及仅使用男性受试者的图像进行训练和测试来预测种族。他们仅使用女性受试者实现了 $82.8%$ 的种族预测准确率,而仅使用男性受试者则实现了 $92%$ 的准确率。使用所有图像(男性和女性)时,他们的最佳预测准确率为 $87.6%$。使用稍大的数据集时,他们在混合男性和女性的数据集上实现了 $90.58%$ 的准确率。
III. FEATURE EXTRACTION
III. 特征提取
One of the goals of our work is to establish the utility of simple texture descriptors for attribute prediction. Uniform local binary patterns (LBP) [44] and binarized statistical image features (BSIF) are two texture descriptors that have performed well on the Outex and Curet texture datasets [45]. Both have shown to perform well in the attribute prediction domain [28], [40], with BSIF outperforming LBP in both domains (texture and attribute prediction). Three texture descriptors were considered in this work: BSIF, LBP and LPQ (Local Phase Quantization).
我们工作的目标之一是确立简单纹理描述符在属性预测中的实用性。均匀局部二值模式 (LBP) [44] 和二值化统计图像特征 (BSIF) 是在 Outex 和 Curet 纹理数据集 [45] 上表现良好的两种纹理描述符。两者在属性预测领域 [28], [40] 都表现良好,其中 BSIF 在两个领域(纹理和属性预测)中都优于 LBP。本文考虑了三种纹理描述符:BSIF、LBP 和 LPQ(局部相位量化)。
LBP [44] encodes local texture information by comparing the value of every pixel of an image with each of its respective neighboring pixels. This results in a binary code whose length is equal to the number of neighboring pixels considered. The binary sequence is then converted into a decimal value, thereby generating an LBP code for every pixel in the image.
LBP [44] 通过比较图像中每个像素与其各自相邻像素的值来编码局部纹理信息。这会产生一个二进制代码,其长度等于所考虑的相邻像素的数量。然后将二进制序列转换为十进制值,从而为图像中的每个像素生成一个 LBP 代码。
LPQ [46] encodes local texture information by utilizing the phase information of an image. A sliding rectangular window is used, so that at each pixel location, an 8-bit binary code is generated utilizing the phase information from the 2-D Discrete Fourier Transform. A histogram of those generated values results in a 256-dimensional feature vector.
LPQ [46] 通过利用图像的相位信息来编码局部纹理信息。使用一个滑动矩形窗口,在每个像素位置,利用二维离散傅里叶变换的相位信息生成一个8位二进制代码。这些生成值的直方图形成一个256维的特征向量。
BSIF was introduced by Kanala and Rahtu [45] as a texture descriptor. BSIF projects the image into a subspace by convolving the image with pre generated filters. The pre generated filters are created from 13 natural images supplied by the authors of [47]. 50,000 patches of size $k\times k$ are randomly sampled from the 13 natural images. Principal component analysis is applied, keeping only the top n components. Independent component analysis is then applied generating $\mathbf{n}$ filters of size $k\times k$ . The authors of [45] provide the pre generated filters for $k={3,5,7,9,11,13,15,17}$ and $n={5-12}$ .10
BSIF 由 Kanala 和 Rahtu [45] 提出,作为一种纹理描述符。BSIF 通过将图像与预生成的滤波器进行卷积,将图像投影到一个子空间中。这些预生成的滤波器是从 [47] 的作者提供的 13 张自然图像中创建的。从这 13 张自然图像中随机采样了 50,000 个大小为 $k\times k$ 的补丁。应用主成分分析,仅保留前 n 个成分。然后应用独立成分分析,生成大小为 $k\times k$ 的 $\mathbf{n}$ 个滤波器。[45] 的作者提供了 $k={3,5,7,9,11,13,15,17}$ 和 $n={5-12}$ 的预生成滤波器。
Each of the $\mathbf{n}$ pre generated filters are convolved with the image and the response is binarized. If the response is greater than zero, a ‘1’ is generated. If the response is less than or equal to zero, a $\mathrm{{}^{\cdot}0^{\cdot}}$ is generated. The concatenated responses form a binary string that is converted into a numeric decimal value (the BSIF code). For example, if the n binary responses were ${1,0,0,1,1}$ , the resulting decimal value would be $\cdot_{19},$ . Therefore, given $\mathbf{n}$ filters, the BSIF response will range between 0 and $2^{n}-1$ .
每个预生成的 $\mathbf{n}$ 个滤波器都与图像进行卷积,并将响应二值化。如果响应大于零,则生成“1”。如果响应小于或等于零,则生成 $\mathrm{{}^{\cdot}0^{\cdot}}$。串联的响应形成一个二进制字符串,该字符串被转换为一个十进制数值(BSIF 码)。例如,如果 $\mathbf{n}$ 个二进制响应为 ${1,0,0,1,1}$,则生成的十进制值为 $\cdot_{19},$。因此,给定 $\mathbf{n}$ 个滤波器,BSIF 响应的范围将在 0 到 $2^{n}-1$ 之间。
TABLE IV: Race Prediction - Related Work
表 IV: 种族预测 - 相关工作
| 作者 | 主题分离指定 | 使用数据集 | 受试者数量 | 图像数量 | 使用特征 | 预测准确率 |
|---|---|---|---|---|---|---|
| Qiu 等 [34] | 否 | CASIA, UPOL, UBIRIS | 未知 | 3982 | Gabor 滤波器 | 85.95% |
| Qiu 等 [35] | 否 | 专有数据集 | 60 | 2400 | Gabor 滤波器 | 91.02% |
| Singh 等 [36] | 否 | ND-Iris-0405/多民族数据集 | 240/未知 | 60,259/60,310 | 深度分类编码器 | 94.33%/97.38% |
| Lagree & Bowyer [37] | 是 | 专有数据集 | 120 | 1200 | 基础纹理滤波器 | 90.58% |
| 本研究 | 是 | BioCOP2009 | 1096 | 41780 | BSIF | 90.1% |
Our proposed method applies the texture descriptor to each of the NIR ocular images which were then tesselated into $20\times20$ pixel regions (see Figure 5 for a visual representation). This tessellation was done in order to ensure the spatial information is included in the feature vector that is being created. Histograms were generated for each of the tessellations, normalized, and concatenated into a single feature vector. In order to provide consistent spatial information across each image, a geometric alignment was applied to the original NIR ocular image. The parameters chosen for this geometric alignment are similar to those proposed by [28] and discussed in Section IV-A as well as shown in Figure 6.
我们提出的方法将纹理描述符应用于每个近红外(NIR)眼部图像,然后将这些图像分割成 $20\times20$ 像素的区域(见图 5 的视觉表示)。进行这种分割是为了确保空间信息被包含在正在创建的特征向量中。为每个分割区域生成直方图,进行归一化处理,并将它们连接成一个单一的特征向量。为了在每个图像中提供一致的空间信息,对原始近红外眼部图像应用了几何对齐。选择的几何对齐参数与 [28] 提出的参数相似,并在第 IV-A 节中进行了讨论,如图 6 所示。
IV. DATASETS
IV. 数据集
Three separate datasets were used to conduct the experiments in this paper. The largest of the 3 datasets is the BioCOP2009 dataset. It is described in Section IV-A. Two other datasets were used for cross testing in order to demonstrate the general iz ability of the proposed method. Those datasets are the Cosmetic Contact dataset (see Section IV-B) and the GFI dataset (see Section IV-C). It is also important to note that the two datasets used for cross testing were collected at an entirely different location than the BioCOP2009 dataset. The BioCOP2009 dataset was collected at West Virginia University, while the Cosmetic Contact and GFI dataset were both collected at Notre Dame University. Cross testing on datasets collected at different locations greatly decreases the chance that they will contain the same subjects while introducing substantial variability in the images due to changes in factors such as lighting and sensors.
本文使用了三个独立的数据集进行实验。其中最大的数据集是 BioCOP2009 数据集,其描述见第 IV-A 节。另外两个数据集用于交叉测试,以展示所提出方法的泛化能力。这两个数据集分别是 Cosmetic Contact 数据集(见第 IV-B 节)和 GFI 数据集(见第 IV-C 节)。需要注意的是,用于交叉测试的两个数据集与 BioCOP2009 数据集是在完全不同的地点收集的。BioCOP2009 数据集是在西弗吉尼亚大学收集的,而 Cosmetic Contact 和 GFI 数据集则是在圣母大学收集的。在不同地点收集的数据集上进行交叉测试,大大降低了它们包含相同主体的可能性,同时由于光照和传感器等因素的变化,引入了显著的图像变异性。
A. BioCOP2009 Dataset
A. BioCOP2009 数据集
The BioCOP2009 dataset contains 43,810 NIR ocular images captured with 3 different sensors: the LG ICAM 4000, CrossMatch I SCAN2 and Aoptix Insight. The LG and Aoptix sensors captured NIR ocular images of size $640\times480$ , while the CrossMatch sensor produced images of size $480\times480$ Using a commercially available SDK, the images were preprocessed to find the coordinates of the iris center and the radius of the iris. During the preprocessing stage, 276 images were rejected as the software was unable to automatically locate those coordinates. In order to ensure that all images are spatially aligned, the images were geometrically adjusted using the method outlined in [28]. The geometric alignment centers the image, using the coordinates computed by the commercial SDK, and rescales the image, using bicubic interpolation, to a fixed size. Given that the CrossMatch sensor images were smaller than those in [28], all of the images were aligned to the smaller dimension size of $400\times340$ (as opposed to $440\times380$ in [28]). A diagram displaying the pixel measurements, as well as a sample geometrically aligned image, are shown in Figure 6. Images that did not contain sufficient border size after the geometric alignment were not used in the experiments (see Table V). The majority $(89%)$ of those images were from the CrossMatch sensor, of which the initial image size was smaller $480\times480)$ than the other two sensors $(640\times480)$ ; thereby making it more difficult to achieve the fixed border size.
BioCOP2009 数据集包含 43,810 张使用 3 种不同传感器捕获的近红外 (NIR) 眼部图像:LG ICAM 4000、CrossMatch I SCAN2 和 Aoptix Insight。LG 和 Aoptix 传感器捕获的近红外眼部图像尺寸为 $640\times480$,而 CrossMatch 传感器生成的图像尺寸为 $480\times480$。使用商业 SDK 对图像进行预处理,以找到虹膜中心的坐标和虹膜的半径。在预处理阶段,有 276 张图像被拒绝,因为软件无法自动定位这些坐标。为了确保所有图像在空间上对齐,使用 [28] 中概述的方法对图像进行几何调整。几何对齐使用商业 SDK 计算的坐标将图像居中,并使用双三次插值将图像重新缩放到固定尺寸。鉴于 CrossMatch 传感器图像比 [28] 中的图像小,所有图像都对齐到较小的尺寸 $400\times340$(与 [28] 中的 $440\times380$ 相对)。图 6 显示了像素测量值以及一个几何对齐的样本图像。在几何对齐后没有足够边框尺寸的图像未用于实验(见表 V)。这些图像中的大多数 $(89%)$ 来自 CrossMatch 传感器,其初始图像尺寸 $480\times480)$ 比其他两个传感器 $(640\times480)$ 小;因此更难达到固定的边框尺寸。
There are 1096 total subjects in the post processed BioCOP2009 dataset, for a total of 41,830 images. The Aoptix and LG ICAM sensors have a left eye image for every subject, while the CrossMatch sensor has 106 subjects with no left eye images. For the right eye, the LG ICAM has an image for every subject, the Aoptix has 2 subjects with no images and the CrossMatch has 103 subjects with no images. A summary of the sensor breakdown is shown in Table VI. Throughout the rest of the document, the post processed BioCOP2009 dataset will simply be referred to as the ‘BioCOP2009 dataset’.
在后期处理的 BioCOP2009 数据集中,共有 1096 个受试者,总计 41,830 张图像。Aoptix 和 LG ICAM 传感器为每个受试者提供了左眼图像,而 CrossMatch 传感器有 106 个受试者没有左眼图像。对于右眼,LG ICAM 为每个受试者提供了图像,Aoptix 有 2 个受试者没有图像,CrossMatch 有 103 个受试者没有图像。传感器的详细分类总结见表 VI。在本文档的其余部分,后期处理的 BioCOP2009 数据集将简称为“BioCOP2009 数据集”。
Five random subject-disjoint partitions of the BioCOP2009 dataset were created for both race and gender experiments. In each of those experiments, all of the images of a subject were used for either training or testing. Given some subjects have more images than others, the total number of training and testing images can fluctuate across the 5 random partitions. It is also important to note that the training and testing partitions contain images from all 3 sensors.
为种族和性别实验创建了BioCOP2009数据集的五个随机主题不相交分区。在每个实验中,一个主题的所有图像都用于训练或测试。由于某些主题的图像比其他主题多,训练和测试图像的总数在五个随机分区中可能会有所波动。同样重要的是,训练和测试分区包含来自所有3个传感器的图像。
B. Cosmetic Contact Dataset
B. 化妆品接触数据集
In order to perform cross dataset testing, we used the Cosmetic Contact Lens dataset assembled by researchers at Notre Dame [1]. The Cosmetic Contact Lens dataset contains images that are labeled with both race and gender labels. The dataset contains images collected by 2 separate sensors, the LG4000 and the AD100. For the LG4000 sensor, 3000 images were collected for training a classifier and 1200 images were collected for testing that classifier. For the AD100 sensor, 600 images were collected for training a classifier and 300 images were collected for testing that classifier. For the purposes of our experiments we only used the LG4000 sensor images. The rest of the paper will refer to the 3000 images collected from the LG4000 sensor as Cosmetic Contact Dataset One (CCD1)
为了进行跨数据集测试,我们使用了由圣母大学研究人员组装的化妆品隐形眼镜数据集 [1]。该数据集包含带有种族和性别标签的图像。数据集包含由两个独立传感器(LG4000 和 AD100)收集的图像。对于 LG4000 传感器,收集了 3000 张图像用于训练分类器,并收集了 1200 张图像用于测试该分类器。对于 AD100 传感器,收集了 600 张图像用于训练分类器,并收集了 300 张图像用于测试该分类器。在我们的实验中,我们仅使用了 LG4000 传感器的图像。本文的其余部分将把从 LG4000 传感器收集的 3000 张图像称为化妆品隐形眼镜数据集一 (CCD1)。
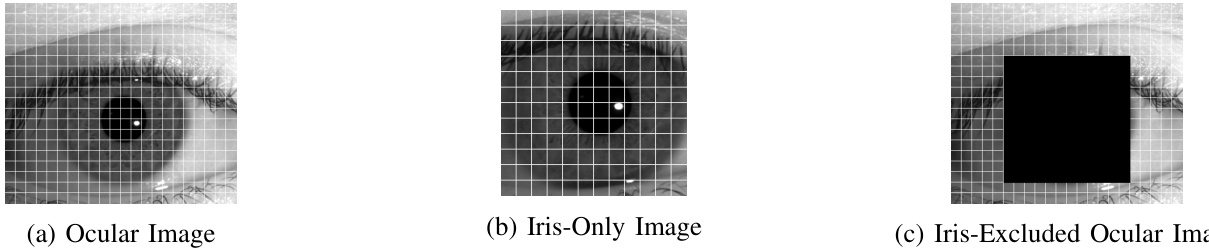
Fig. 5: Tessellations applied to the three image regions. The images are from [1].
图 5: 应用于三个图像区域的镶嵌图案。图像来自 [1]。
TABLE V: Statistics of the BioCOP2009 dataset. The first column denotes the number of images that were initially present in the BioCOP2009 dataset. The second column lists the number of images that were successfully pre processed by the COTS SDK in order to find the coordinates of the iris center and the iris radius. The third column presents the number of images that contained sufficient border pixels after the geometric alignment step.
表 V: BioCOP2009 数据集的统计信息。第一列表示 BioCOP2009 数据集中最初存在的图像数量。第二列列出了通过 COTS SDK 成功预处理的图像数量,以找到虹膜中心和虹膜半径的坐标。第三列展示了在几何对齐步骤后包含足够边界像素的图像数量。
TABLE VI: Statistics of the post processed BioCOP2009 dataset
表 VI: 后处理的 BioCOP2009 数据集统计
| 传感器 | 初始图像数量 | 后 SDK 预处理 | 后几何对齐 |
|---|---|---|---|
| LGICAM4000 | 21,940 | 21,912 | 21,871 |
| CrossMatchISCAN2 | 10,890 | 10,643 | 9,121 |
| Aoptix Insight | 10,980 | 10,838 | 10,838 |
| 总计 | 43,810 | 43,534 | 41,830 |
| 传感器 | 左图像受试者 | 左图像数量 | 右图像受试者 | 右图像数量 |
|---|---|---|---|---|
| Aoptix | 1096 | 5449 | 1094 | 5389 |
| CrossMatch | 990 | 4528 | 993 | 4593 |
| LGICAM | 1096 | 10,940 | 1096 | 10,931 |
| 总计 | 1096 | 20,917 | 1096 | 20,913 |
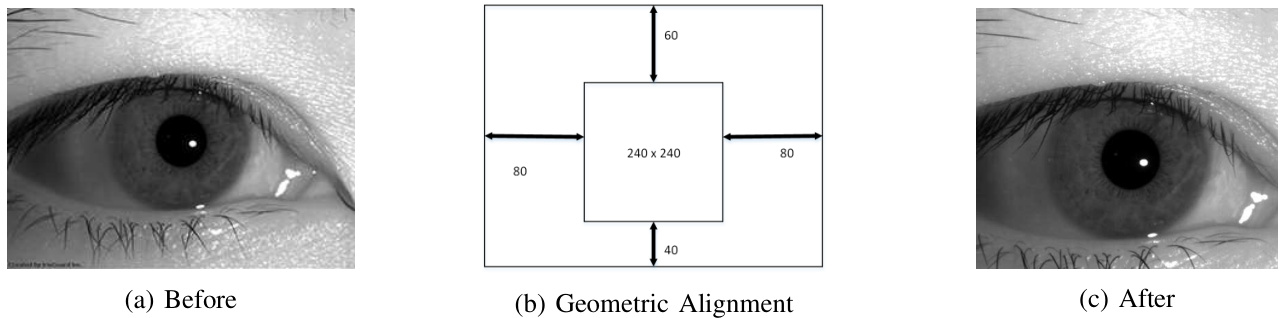
Fig. 6: Example of a geometrically adjusted image. The image in (a) is from [1].
图 6: 几何调整图像的示例。(a) 中的图像来自 [1]。
and the 1200 verification images as Cosmetic Contact Dataset Two (CCD2).
并将1200张验证图像作为Cosmetic Contact Dataset Two (CCD2)。
The geometric alignment process that was used for the BioCOP2009 dataset (see Figure 6) was applied to the CCD1 and CCD2 datasets. After the geometric alignment procedure, only 4 images from CCD2 were discarded due to insufficient border size and no images were discarded from CCD1. During cross dataset testing, these 2 datasets were tested using the 5 SVM class if i ers that were obtained from the 5 random partitions of the BioCOP2009 training set. Using the same SVM class if i ers allows for a fair comparison between the prediction accuracies of the intra-dataset and cross-dataset test scenarios.
应用于 BioCOP2009 数据集的几何对齐过程(见图 6)也被应用于 CCD1 和 CCD2 数据集。在几何对齐过程之后,由于边界尺寸不足,CCD2 中仅有 4 张图像被丢弃,而 CCD1 中没有图像被丢弃。在跨数据集测试期间,使用从 BioCOP2009 训练集的 5 个随机分区中获得的 5 个 SVM 分类器对这两个数据集进行测试。使用相同的 SVM 分类器可以在数据集内和跨数据集测试场景的预测准确性之间进行公平比较。
subjects and 1500 from female subjects. There are 750 right and 750 left images for each of the aforementioned categories. The dataset was first used in [40] but was discovered to contain multiple images from the same subjects (‘an average of about six images per subject’ [29]). The dataset was corrected and used again in [29] where it was stated to contain images from 1500 unique subjects, 750 males and 750 females. The images were captured with a LG 4000 sensor [29] and are labeled with the gender of the subject.
该数据集包含1500张男性受试者和1500张女性受试者的图像。上述每个类别中,有750张右眼图像和750张左眼图像。该数据集首次在[40]中使用,但被发现包含来自同一受试者的多张图像(“每个受试者平均约六张图像”[29])。数据集经过修正后再次在[29]中使用,其中提到包含来自1500个独特受试者的图像,750名男性和750名女性。图像使用LG 4000传感器捕获[29],并标注了受试者的性别。
An additional GFI validation dataset was also available (also collected by Notre Dame) containing 3 images per eye of 324 subjects for a total of 972 left and 972 right NIR ocular images [29].
还有一个额外的GFI验证数据集(同样由Notre Dame收集),包含324名受试者的每只眼睛3张图像,总计972张左眼和972张右眼近红外(NIR)眼部图像 [29]。
C. GFI Dataset
C. GFI 数据集
The GFI dataset is a publicly available dataset that was assembled by researchers at Notre Dame University. It contains $3000~\mathrm{NIR}$ ocular images, 1500 of which are from male
GFI 数据集是由圣母大学的研究人员组装的公开数据集。它包含 3000 张近红外 (NIR) 眼部图像,其中 1500 张来自男性。
V. EXPERIMENTS
V. 实验
A. Race
A. 种族
Of the 1096 subjects contained in the BioCOP2009 dataset, 849 of them were labeled as ‘Caucasian’, with the remaining
在 BioCOP2009 数据集中包含的 1096 名受试者中,849 名被标记为“高加索人”,其余
TABLE VII: Performance of the proposed race prediction method on the BioCOP2009 dataset: BSIF 8-bit $9\mathrm{x}9$ filter size, LBP, LPQ
表 VII: 所提出的种族预测方法在 BioCOP2009 数据集上的性能:BSIF 8-bit $9\mathrm{x}9$ 滤波器大小,LBP,LPQ
| 眼睛 | 区域 | BSIF | LBP | LPQ |
|---|---|---|---|---|
| 左眼 | 仅虹膜 | 88.9 ± 1.4 | 86.5 ± 1.5 | 86.9 ± 1.4 |
| 左眼 | 排除虹膜 | 82.6 ± 1.5 | 88.0 ± 1.5 | 79.6 ± 0.9 |
| 左眼 | 扩展眼部 | 89.8 ± 1.5 | 88.4 ± 1.7 | 87.6 ± 1.3 |
| 右眼 | 仅虹膜 | 88.6 ± 1.2 | 85.9 ± 0.8 | 87.1 ± 0.8 |
| 右眼 | 排除虹膜 | 82.7 ± 0.6 | 85.5 ± 0.8 | 79.2 ± 0.6 |
| 右眼 | 扩展眼部 | 88.9 ± 1.1 | 87.1 ± 0.9 | 87.5 ± 0.8 |
TABLE VIII: Performance of the proposed gender prediction method on the BioCOP2009 dataset: BSIF 8-bit $9\mathrm{x}9$ filter size, LBP, LPQ
表 VIII: 所提出的性别预测方法在 BioCOP2009 数据集上的性能:BSIF 8-bit $9\mathrm{x}9$ 滤波器大小,LBP,LPQ
| 眼睛 | 区域 | BSIF | LBP | LPQ |
|---|---|---|---|---|
| 左眼 | 仅虹膜 | 78.9±1.0 | 78.9±0.2 | 74.9±1.0 |
| 左眼 | 排除虹膜 | 82.2±1.4 | 82.9±0.9 | 81.8±0.8 |
| 左眼 | 扩展眼部 | 85.9±0.7 | 84.1±0.5 | 82.4±0.8 |
| 右眼 | 仅虹膜 | 79.2±0.8 | 79.8±1.1 | 74.9±1.2 |
| 右眼 | 排除虹膜 | 82.1±0.9 | 82.0±0.6 | 80.6±1.4 |
| 右眼 | 扩展眼部 | 85.2±1.1 | 84.0±0.7 | 81.4±1.2 |
247 labeled with a variety of other classes (i.e., Asian, Hispanic, African). In order to create an equal number of subjects in each of the classes, 247 of the 849 Caucasian subjects were randomly selected. The remaining 602 Caucasian subjects were not used in the race prediction experiments. $60%$ of the subjects were randomly selected to be in the training set while the remaining $40%$ were selected for the test set, resulting in 148 subjects for training and 99 subjects for testing. This random selection was repeated 5 times resulting in 5 subjectdisjoint training and testing sets. An SVM classifier was trained using the images from the 148 subjects selected for the training partition. Images from all 3 sensors were used during the training and testing stages. Over the 5 random iterations, there were $5656\pm34$ images in the training dataset and $3749\pm34$ images in the test set.11
247 个样本被标记为其他多种类别(即亚洲人、西班牙裔、非洲人)。为了在每个类别中创建相同数量的样本,从 849 个白人样本中随机选择了 247 个。剩下的 602 个白人样本未用于种族预测实验。$60%$ 的样本被随机选择为训练集,剩下的 $40%$ 被选择为测试集,结果得到 148 个训练样本和 99 个测试样本。这种随机选择重复了 5 次,生成了 5 个互不重叠的训练和测试集。使用从 148 个训练样本中选择的图像训练了一个 SVM 分类器。在训练和测试阶段使用了所有 3 个传感器的图像。在 5 次随机迭代中,训练数据集中有 $5656\pm34$ 张图像,测试集中有 $3749\pm34$ 张图像。
- BioCOP2009 Race Results: The 8-bit BSIF was used in this work as a compromise between prediction accuracy and computational processing time. While 9-bit or 10-bit BSIF may provide slightly better results, the increased requirement of memory and processing time to perform each experiment was quite substantial given the large size of the BioCOP2009 dataset. An SVM classifier was trained on each of the 5 training sets using the extracted BSIF features described in Section III. The test data was classified using each respective SVM model. The resulting prediction accuracy using filter sizes in the range of $3\times3$ to $17\times17$ is shown in Figure 7. The prediction accuracy varies slightly across each of the different filter sizes; however, there is no significant difference in performance across the filter sizes.
- BioCOP2009 比赛结果:在本工作中,8 位 BSIF 被用作预测精度和计算处理时间之间的折衷方案。虽然 9 位或 10 位 BSIF 可能会提供稍好的结果,但考虑到 BioCOP2009 数据集的大小,执行每个实验所需的内存和处理时间的增加相当大。使用第 III 节中描述的提取的 BSIF 特征,在每个训练集上训练了一个 SVM 分类器。使用每个相应的 SVM 模型对测试数据进行分类。使用 $3\times3$ 到 $17\times17$ 范围内的滤波器大小的预测精度如图 7 所示。不同滤波器大小的预测精度略有不同;然而,滤波器大小之间的性能没有显著差异。
- Iris-excluded Ocular Region vs. Iris-Only Region : Previous work in this field [40], [29] has predominantly focused on the iris-only portion of the captured NIR ocular images. Bobeldyk and Ross [28] showed, for gender prediction using BSIF, that the ocular region provides greater gender prediction accuracy than the iris-only region. We have performed a similar experiment in order to test the prediction accuracy of the iris-only and iris-excluded ocular image regions (see Figure 4). The results of these experiments are shown in Table XI. For race, the iris-only region provides a greater prediction accuracy using BSIF than the iris-excluded ocular region, while the opposite is true for gender prediction.
- 排除虹膜的眼部区域与仅虹膜区域的对比:该领域的先前工作 [40], [29] 主要集中在捕获的近红外 (NIR) 眼部图像的仅虹膜部分。Bobeldyk 和 Ross [28] 展示了在使用 BSIF 进行性别预测时,眼部区域比仅虹膜区域提供了更高的性别预测准确率。我们进行了类似的实验,以测试仅虹膜区域和排除虹膜的眼部图像区域的预测准确率(见图 4)。这些实验的结果如表 XI 所示。对于种族预测,使用 BSIF 时,仅虹膜区域比排除虹膜的眼部区域提供了更高的预测准确率,而在性别预测方面则相反。
- Cross Dataset Testing: It is not uncommon for a method to perform well when training and testing is conducted using the same dataset. In order to demonstrate the general iz ability of the proposed algorithm, we trained on the BioCOP2009 dataset and tested on the CCD1 and CCD2 datasets described earlier. The 5 trained SVM models that were generated using the BioCOP2009 dataset were used to classify the images in CCD1 and CCD2. It should be noted that subjects from the BioCOP2009 dataset were labeled as ‘Caucasian’ while those in the CCD1 and CCD2 datasets were labeled as ‘White’. Both the CCD1 and CCD2 datasets contain images of people with contacts, without contacts and with cosmetic contacts. CCD1 contains 500 left and 500 right eye images with no contacts, CCD2 contains 200 left and 200 right eye images with no contacts. Only the images without contacts were used in our experiments. The results are shown in Table XII. The resulting prediction accuracy of the cross dataset experiments is comparable to that of the same dataset experiments which supports the hypothesis that the proposed approach does generalize. Some images that were mis classified are shown in Figure 8.
- 跨数据集测试:当使用相同的数据集进行训练和测试时,方法表现良好并不罕见。为了证明所提出算法的泛化能力,我们在 BioCOP2009 数据集上进行了训练,并在之前描述的 CCD1 和 CCD2 数据集上进行了测试。使用 BioCOP2009 数据集生成的 5 个训练好的 SVM 模型被用于对 CCD1 和 CCD2 中的图像进行分类。需要注意的是,BioCOP2009 数据集中的受试者被标记为“Caucasian”,而 CCD1 和 CCD2 数据集中的受试者被标记为“White”。CCD1 和 CCD2 数据集都包含戴有隐形眼镜、未戴隐形眼镜以及戴有美容隐形眼镜的人眼图像。CCD1 包含 500 张未戴隐形眼镜的左眼和右眼图像,CCD2 包含 200 张未戴隐形眼镜的左眼和右眼图像。在我们的实验中仅使用了未戴隐形眼镜的图像。结果如表 XII 所示。跨数据集实验的预测准确性与同数据集实验的结果相当,这支持了所提出方法具有泛化能力的假设。一些被错误分类的图像如图 8 所示。
B. Gender
B. 性别
- BioCOP2009 Gender Results: Of the 1096 subjects contained in the BioCOP2009 dataset, 467 are labeled male and 629 are labeled female.13 In order to assign an equal number of
- BioCOP2009 性别结果:在 BioCOP2009 数据集中包含的 1096 名受试者中,467 名被标记为男性,629 名被标记为女性。为了分配相同数量的
12The lower prediction accuracy of the left eye could be attributed to the non symmetric composition of the subject pool between left and right eye images (of subjects that are not wearing contacts). If the contact lens images are also included, the prediction accuracy increases to $88.9%\pm1.2%$
左眼预测准确率较低可能归因于左眼和右眼图像(未佩戴隐形眼镜的受试者)之间的受试者群体构成不对称。如果包括隐形眼镜图像,预测准确率提高到 $88.9%\pm1.2%$。
$^{13}\mathrm{It}$ should be noted that societal and personal interpretation of gender may consider more than a simple ‘male’ and ‘female’ label. For example, at the time of this paper’s publication, Facebook has 71 gender options.
$^{13}\mathrm{需要注意的是}$,社会和个人对性别的理解可能不仅仅局限于简单的“男性”和“女性”标签。例如,在本文发表时,Facebook 提供了 71 种性别选项。

Fig. 7: Race prediction results using the extended ocular region (BioCOP2009 using 8-bit BSIF).
图 7: 使用扩展眼部区域的种族预测结果 (BioCOP2009 使用 8 位 BSIF)。
TABLE IX: Race prediction confusion matrix for the extended ocular region (BioCOP2009 using 8-bit BSIF with a $9\mathrm{x}9$ filter).
表 IX: 扩展眼部区域的种族预测混淆矩阵 (BioCOP2009 使用 8 位 BSIF 和 $9\mathrm{x}9$ 滤波器)。
| | | 左 | | 右 |
| | | 预测 | 预测 | 预测 | 预测 |
| 实际 高加索人 | 高加索人 | 非高加索人 | 高加索人 | 非高加索人 |
| | 91.7%±1.3% | 8.3%±1.3% | 90.5%±1.9% | 9.5%±1.9% |
| 实际 非高加索人 | 12.1%±2.8% | 87.9%±2.8% | 12.8%±2.7% | 87.2%±2.7% |
TABLE X: Gender prediction confusion matrix for the extended ocular region (BioCOP2009 using 8-bit BSIF with a $9\mathrm{x}9$ filter).
表 X: 扩展眼部区域的性别预测混淆矩阵 (BioCOP2009 使用 8 位 BSIF 和 $9\mathrm{x}9$ 滤波器)。
| Left | Left | Right | Right | |
|---|---|---|---|---|
| Predicted Female | Predicted Male | Predicted Female | Predicted Male | |
| ActualFemale | 83.2%±1.8% | 16.8%±1.8% | 82.2%±2.2% | 17.8%±2.2% |
| ActualMale | 11.4%±1.7% | 88.6%±1.7% | 11.8%±1.8% | 88.2%±1.8% |
TABLE XI: Race prediction using the iris-excluded, iris-only and extended ocular regions (BioCOP2009 using 8-bit BSIF with a $9\mathrm{x}9$ filter).
表 11: 使用排除虹膜、仅虹膜和扩展眼部区域进行种族预测 (BioCOP2009 使用 8 位 BSIF 和 $9\mathrm{x}9$ 滤波器)。
| 眼睛 | 仅虹膜准确率 (%) | 排除虹膜 (%) | 扩展 (%) |
|---|---|---|---|
| 左眼 | 88.9±1.4 | 82.6±1.5 | 89.8±1.5 |
| 右眼 | 88.6±1.2 | 82.7±0.6 | 89.9±1.1 |
TABLE XII: Race cross dataset testing (8-bit BSIF with a 9x9 filter).
表 XII: 种族交叉数据集测试 (使用 9x9 滤波器的 8 位 BSIF)。
| 种族 | 训练 | 测试 | 眼睛 | 预测准确率(%) |
|---|---|---|---|---|
| BioCOP2009 | CCD1 | 左 | 80.2±1.3 | |
| 右 | 90.3±1.7 | |||
| CCD2 | 左 | 87.3±4.5 | ||
| 右 | 90.8±1.6 |

Fig. 8: Mis classified images: (a) and (b) were classified as Caucasian, (c) and (d) were classified as Non-Caucasian. The images are from [1].
图 8: 错误分类的图像:(a) 和 (b) 被分类为高加索人,(c) 和 (d) 被分类为非高加索人。这些图像来自 [1]。
subjects to each class, 467 of the 629 available female subjects were randomly selected. The remaining 162 female subjects were not used for these experiments. $60%$ of the subjects were randomly chosen to be in the training set (280 subjects and their associated images) while the remaining $40%$ were placed in the test set (187 subjects and their associated images). This process of random selection was repeated 5 times, creating 5 different subject-disjoint sets for training and testing. An SVM classifier was trained on images from the training set. Images from all 3 sensors were pooled together during the training and testing process. Over the 5 random iterations for the left eye there were $10,727\pm3.4$ images used for training and $7,156\pm3.4$ images used for testing.14 For the right eye there were 10, $,720\pm11.3$ images used for training and 7, $159\pm11.3$ used for testing.15 The results of the experiments across all of the BSIF filter sizes are shown in Figure 9. The prediction accuracy only varies slightly across each of the different filter sizes.
从每个类别中随机选择467名可用女性受试者中的467名。剩余的162名女性受试者未用于这些实验。随机选择60%的受试者作为训练集(280名受试者及其相关图像),而剩余的40%则放入测试集(187名受试者及其相关图像)。此随机选择过程重复5次,创建了5个不同的受试者不相交的训练和测试集。在训练集图像上训练了一个SVM分类器。在训练和测试过程中,所有3个传感器的图像被汇集在一起。在左眼的5次随机迭代中,训练使用了$10,727\pm3.4$张图像,测试使用了$7,156\pm3.4$张图像。对于右眼,训练使用了$10,720\pm11.3$张图像,测试使用了$7,159\pm11.3$张图像。所有BSIF滤波器尺寸的实验结果如图9所示。预测准确率在不同滤波器尺寸之间仅有轻微变化。
- Iris-excluded Ocular versus Iris-Only: Previous literature has shown that the iris-excluded ocular region (as shown in Figure 4) provides greater sex discrimination than the iris region when the BSIF descriptor is used [28]. A separate feature vector was generated from each of the two regions: iris-excluded ocular and iris-only (see Figure 4). The results are shown in Table XIII and confirm the results found in [28].
- 排除虹膜的眼部区域与仅虹膜区域的对比:先前的研究表明,当使用 BSIF 描述符时,排除虹膜的眼部区域(如图 4 所示)比仅虹膜区域在性别区分上表现更好 [28]。我们从两个区域分别生成了特征向量:排除虹膜的眼部区域和仅虹膜区域(见图 4)。结果如表 XIII 所示,并证实了 [28] 中的发现。
- Cross Dataset Testing: In order to validate the proposed method and ensure general iz ability of the algorithm to images originating from outside of the BioCOP2009 dataset, we chose to cross test on the following datasets: CCD1, CCD2, GFI, and GFI-validation. Each of these datasets were made available by the researchers at Notre Dame [1]. It was important to choose a dataset originating from a separate location than where the BioCOP2009 dataset was collected 16 in order to reduce the chance of the same identity being included in both of the datasets. The CCD1 and CCD2 datasets provide both gender and race labels for each of the images, while the GFI and GFI-validation datasets provides only gender. The CCD1 and CCD2 datasets contains images of subjects with contacts, without contacts and with cosmetic contacts. CCD1 contains 500 left and 500 right eye images with no contacts, CCD2 contains 200 left and 200 right eye images with no contacts. Only the images of subjects without contacts were used in the experiments.
- 跨数据集测试:为了验证所提出的方法并确保算法对来自 BioCOP2009 数据集之外的图像具有泛化能力,我们选择在以下数据集上进行交叉测试:CCD1、CCD2、GFI 和 GFI-validation。这些数据集均由 Notre Dame 的研究人员提供 [1]。选择一个与 BioCOP2009 数据集采集地点不同的数据集非常重要,以减少两个数据集中包含相同身份的可能性。CCD1 和 CCD2 数据集为每张图像提供了性别和种族标签,而 GFI 和 GFI-validation 数据集仅提供性别标签。CCD1 和 CCD2 数据集包含有隐形眼镜、无隐形眼镜和化妆隐形眼镜的受试者图像。CCD1 包含 500 张左眼和 500 张右眼无隐形眼镜的图像,CCD2 包含 200 张左眼和 200 张右眼无隐形眼镜的图像。实验中仅使用了无隐形眼镜的受试者图像。
The 5 trained SVM models that were generated using the BioCOP2009 dataset were used to classify images in each of the 4 selected datasets (CCD1, CCD2, GFI, GFI-validation). The results are shown in Table XIV. The prediction accuracy for classification of images from CCD1 and CCD2 was about $10%$ less than that of the GFI and GFI-validation datasets. We believe this may be due to the increased number of images per subject in the cosmetic contact dataset. The images in the GFI dataset, on the other hand, contain only 1 image per subject. Some images that were mis classified are shown in Figure 10.
使用 BioCOP2009 数据集生成的 5 个训练好的 SVM 模型对 4 个选定数据集(CCD1、CCD2、GFI、GFI-validation)中的图像进行分类。结果如表 XIV 所示。CCD1 和 CCD2 图像分类的预测准确率比 GFI 和 GFI-validation 数据集低约 $10%$。我们认为这可能是由于化妆品接触数据集中每个受试者的图像数量增加所致。而 GFI 数据集中的图像每个受试者只有 1 张图像。图 10 展示了一些被错误分类的图像。
C. Race and Gender
C. 种族与性别
The following two subsections will analyze the impact of race on gender prediction and the impact of gender on race prediction. It should be noted that regardless of which experiment was performed, there was very little variation in prediction accuracy between the left and right eye images.
以下两小节将分析种族对性别预测的影响以及性别对种族预测的影响。需要注意的是,无论进行哪种实验,左右眼图像之间的预测准确率差异都非常小。
- Gender prediction: Caucasian versus Non-Caucasian Analysis: In order to determine if predicting gender is a more challenging problem for either Caucasians or Non-Caucasians, 4 additional experiments were performed: (a) training and testing on Caucasian subjects; (b) training on Caucasian subjects and testing on Non-Caucasian subjects; (c) training and testing on Non-Caucasian subjects; (d) training on Non-Caucasian subjects and testing on Caucasian subjects.
- 性别预测:白种人与非白种人分析:为了确定性别预测对白种人或非白种人是否更具挑战性,进行了4项额外实验:(a) 在白种人受试者上进行训练和测试;(b) 在白种人受试者上训练,在非白种人受试者上测试;(c) 在非白种人受试者上进行训练和测试;(d) 在非白种人受试者上训练,在白种人受试者上测试。
Training and testing on only the Caucasian class results in a ${\sim}6%$ increase in prediction accuracy when compared to training and testing on only the Non-Caucasian class. The decrease in prediction accuracy for the Non-Caucasian class could be attributed to the multiple race labels that were assigned to the Non-Caucasian class (see Section V-A). The results are shown in Table XV.
仅在高加索人种类别上进行训练和测试时,预测准确率比仅在非高加索人种类别上进行训练和测试时提高了约 6%。非高加索人种类别预测准确率的下降可能归因于该类别被分配了多个种族标签(见第 V-A 节)。结果如表 XV 所示。
Training on either race class and cross testing on the other race class results in an ${\sim}80%$ prediction accuracy. It can be observed that there is a slight increase in prediction accuracy when training on the Non-Caucasian class and testing on the Caucasian class $(\sim1-2%)$ . The results are shown in Table XV. 2) Race prediction: Male versus Female Analysis: In order to determine if predicting race was a more challenging problem for either males or females, 4 additional experiments were conducted: (a) training and testing on male subjects; (b) training and testing on female subjects; (c) training on male subjects and testing on females; and (d) training on females and testing on males.
在某一种族类别上进行训练并在另一种族类别上进行交叉测试,预测准确率约为 80%。可以观察到,在非白人类别上训练并在白人类别上测试时,预测准确率略有提高(约 1-2%)。结果如表 XV 所示。
- 种族预测:男性与女性分析:为了确定种族预测对男性或女性是否更具挑战性,进行了 4 项额外实验:(a) 在男性受试者上进行训练和测试;(b) 在女性受试者上进行训练和测试;(c) 在男性受试者上训练并在女性受试者上测试;(d) 在女性受试者上训练并在男性受试者上测试。
Training and testing on only male subjects results in a ${\sim}3{-}5%$ increase over training and testing on only female
仅在男性受试者上进行训练和测试的结果比仅在女性受试者上进行训练和测试的结果高出约 3-5%。

Fig. 9: Gender prediction results using the extended ocular region (BioCOP2009 using 8-bit BSIF).
图 9: 使用扩展眼部区域的性别预测结果(BioCOP2009 使用 8 位 BSIF)。
TABLE XIII: Gender prediction results using the iris-excluded, iris-only and extended ocular regions (BSIF 8bit $9\mathrm{x}9$ filter size)
表 XIII: 使用排除虹膜、仅虹膜和扩展眼部区域进行性别预测的结果 (BSIF 8bit $9\mathrm{x}9$ 滤波器大小)

Fig. 10: Mis classified images: (a) and (b) were classified as female, (c) and (d) were classified as male. The images are from [1].
图 10: 错误分类的图像:(a) 和 (b) 被分类为女性,(c) 和 (d) 被分类为男性。图像来自 [1]。
subjects.17 There was a significant decrease in prediction accuracy when training on male subjects and testing on female subjects $(\sim14%)$ . There was no decrease in prediction accuracy when training on female subjects and testing on male subjects. The absence or presence of makeup in the female images may make it more difficult for the male-only trained model to predict race from the female images, but additional research should be performed to fully explore the difference in prediction accuracies. The results are summarized in Table XVI.
在男性受试者上训练并在女性受试者上测试时,预测准确率显著下降 $(\sim14%)$ 。在女性受试者上训练并在男性受试者上测试时,预测准确率没有下降。女性图像中是否化妆可能使仅针对男性训练的模型更难从女性图像中预测种族,但应进行更多研究以全面探讨预测准确率的差异。结果总结在表 XVI 中。
D. Impact of Image Blur on Race and Gender Prediction
D. 图像模糊对种族和性别预测的影响
During the image acquisition process, ocular images may be captured out-of-focus. In order to determine the impact of out-of-focus images on both gender and race prediction, an additional experiment was performed. Out-of-focus images were simulated by ‘blurring’ the image. The blurring effect was generated by applying a Gaussian filter to each image in the test partition with different sigma values $\zeta\sigma=2$ , 4, 6, 8, 10). Only the images in the test partition were blurred, while the images in the training partition were not blurred. The same subject-disjoint experimental protocol used in the previous sections was followed (see Section V-B and V-A). The results are displayed in Table XVII.
在图像采集过程中,眼部图像可能会失焦。为了确定失焦图像对性别和种族预测的影响,我们进行了额外的实验。失焦图像通过“模糊”图像来模拟。模糊效果是通过对测试分区中的每个图像应用不同 sigma 值的高斯滤波器生成的($\zeta\sigma=2$,4,6,8,10)。只有测试分区中的图像被模糊,而训练分区中的图像未被模糊。遵循了前面章节中使用的相同的主体分离实验协议(见第 V-B 和 V-A 节)。结果如表 XVII 所示。
Results from the experiment indicate that race prediction accuracy degrades at a steeper rate than gender prediction accuracy as the blurriness (i.e., sigma level) increases. We can conclude from this that race cues are at a much finer level than gender cues.
实验结果表明,随着模糊度(即 sigma 水平)的增加,种族预测准确率的下降速度比性别预测准确率的下降速度更快。我们可以由此得出结论,种族线索比性别线索更为精细。
E. Impact of Eye Color on Race and Gender Prediction
E. 眼睛颜色对种族和性别预测的影响
Certain eye colors are predominant to specific races [21]; therefore, it is important to investigate the impact of eye color on both race and gender prediction. The breakdown of eye color18 by ethnicity and gender for the BioCOP2009 dataset is listed in Table XVIII. The gender and race prediction accuracies categorized by eye color are shown in Tables XIX and XX. Understanding the impact of eye color on race and gender prediction may help in designing a fusion model for attribute prediction.
某些眼睛颜色在特定种族中占主导地位 [21];因此,研究眼睛颜色对种族和性别预测的影响非常重要。BioCOP2009 数据集中按种族和性别划分的眼睛颜色分布列在表 XVIII 中。按眼睛颜色分类的性别和种族预测准确率分别显示在表 XIX 和表 XX 中。了解眼睛颜色对种族和性别预测的影响可能有助于设计用于属性预测的融合模型。
TABLE XIV: Gender prediction results in a cross-dataset scenario where training and testing are done on different datasets (BSIF 8bit $\mathrm{9x9}$ filter size).
表 XIV: 跨数据集场景下的性别预测结果,其中训练和测试在不同的数据集上进行(BSIF 8bit $\mathrm{9x9}$ 滤波器大小)。
| 训练数据集 | 测试眼睛 | 预测准确率 |
|---|---|---|
| BioCOP2009 | 左 CCD1 | 75.3±2.1 |
| 右 CCD1 | 76.8±2.9 | |
| 左 CCD2 | 72.3±4.0 | |
| 右 CCD2 | 77.8±4.1 | |
| 左 GFI | 84.4±0.8 | |
| 右 GFI | 84.3±0.5 | |
| 左 GFI- | 84.2±1.2 | |
| 右 GFI- | 82.6±1.3 |
TABLE XV: Gender prediction results for intra-race and inter-race training and testing (BioCOP2009 using 8-bit BSIF with a $9\mathrm{x}9$ filter).
表 XV: 种族内和跨种族训练与测试的性别预测结果(使用 8 位 BSIF 和 $9\mathrm{x}9$ 滤波器的 BioCOP2009)。
| 训练数据 | 测试数据 | 眼睛 | 预测准确率 |
|---|---|---|---|
| 白人 | 白人 | 左眼 | 87.9 ± 1.3 |
| 非白人 | 右眼 | 87.2 ± 1.1 | |
| 左眼 | 77.5 | ||
| 右眼 | 78.5 | ||
| 非白人 | 非白人 | 右眼 | 81.3 ± 2.5 |
| 左眼 | 81.2 ± 2.4 | ||
| 白人 | 左眼 | 79.6 | |
| 右眼 | 79.8 |
TABLE XVI: Race prediction results for intra-gender and inter-gender training and testing (BioCOP2009 using 8-bit BSIF with a $9\mathrm{x}9$ filter).
表 XVI: 性别内和跨性别训练和测试的种族预测结果 (BioCOP2009 使用 8 位 BSIF 和 $9\mathrm{x}9$ 滤波器)。
| 训练数据 | 测试数据 | 眼睛 | 预测准确率 |
|---|---|---|---|
| 男性 | 男性 | 左眼 | 92.9 ± 2.1 |
| 右眼 | 92.2 ± 1.0 | ||
| 女性 | 左眼 | 78.6 | |
| 右眼 | 78.7 | ||
| 女性 | 女性 | 右眼 | 87.0 ± 1.8 |
| 左眼 | 88.9 ± 2.0 | ||
| 男性 | 左眼 | 88.3 | |
| 右眼 | 88.3 |

Fig. 11: A sample ocular image that has been convolved with a Gaussian filter at different sigma values. The image in (a) is from [1].
图 11: 使用不同 sigma 值的高斯滤波器卷积后的眼部图像样本。(a) 中的图像来自 [1]。
The results shown in Table XIX suggest that eye color does not have a significant impact on gender prediction.
表 XIX 中的结果表明,眼睛颜色对性别预测没有显著影响。
Males slightly outperform females regardless of eye color as seen in Table X. However, for race prediction, Table XX suggests that eye color does impact accuracy. Caucasian eyes exhibit a higher race prediction accuracy when the eye color is not brown, while Non-Caucasians eyes exhibit a higher race prediction accuracy when the eye color is brown. This observation may be related to the high number of NonCaucasians with brown eyes in the dataset and limited number of Non-Caucasians with blue, green or hazel eye colors. Non-Caucasian subjects with light eye color is not just a characteristic of the BioCOP2009 dataset - Sturm and Larsson [21] have reported that light eye colors (blue, green, hazel) are found more frequently in Caucasians.
如表 X 所示,无论眼睛颜色如何,男性的表现略优于女性。然而,对于种族预测,表 XX 表明眼睛颜色确实会影响准确性。当眼睛颜色不是棕色时,白种人的种族预测准确率更高,而当眼睛颜色为棕色时,非白种人的种族预测准确率更高。这一观察结果可能与数据集中大量非白种人拥有棕色眼睛以及少数非白种人拥有蓝色、绿色或淡褐色眼睛有关。非白种人拥有浅色眼睛不仅仅是 BioCOP2009 数据集的特征——Sturm 和 Larsson [21] 报告称,浅色眼睛(蓝色、绿色、淡褐色)在白种人中更为常见。
TABLE XVII: Gender and race prediction accuracy on blurred ocular images (BioCOP2009 using 8-bit BSIF with a $9\mathrm{x}9$ filter). Training is done on the original images in the train partition, while testing is done on the blurred images on the test partition.
表 XVII: 在模糊眼部图像上的性别和种族预测准确率 (BioCOP2009 使用 8 位 BSIF 和 $9\mathrm{x}9$ 滤波器)。训练在训练分区的原始图像上进行,测试在测试分区的模糊图像上进行。
| 属性 | 未修改 | =2 | 0=4 | 0=6 | 0=8 | 0=10 |
|---|---|---|---|---|---|---|
| 性别 | 85.9 ± 0.7 | 83.1 ± 0.7 | 78.6 ± 1.1 | 75.3 ± 1.7 | 73.1 ± 2.6 | 70.8 ± 3.2 |
| 种族 | 89.8 ± 1.5 | 83.1 ± 1.5 | 64.8 ± 2.2 | 60.3 ± 2.5 | 58.4 ± 2.1 | 57.2 ± 2.0 |
$F.$ Texture Descriptor Comparison
F. 纹理描述符比较
In order to select a suitable texture descriptor for experiments in this work, three were first considered: BSIF, LBP and LPQ. Each of the three texture descriptors are described in Section III. Prediction accuracies were generated using the proposed methods from Section V-A and V-B for race and gender, respectively. The results of these experiments are shown in Tables VII and VIII. BSIF was selected as the primary texture descriptor based on it’s overall performance.
为了为本实验选择合适的纹理描述符,首先考虑了三种:BSIF、LBP 和 LPQ。这三种纹理描述符在第 III 节中进行了描述。使用第 V-A 和 V-B 节中提出的方法分别生成种族和性别的预测准确率。这些实验的结果如表 VII 和表 VIII 所示。基于其整体性能,BSIF 被选为主要纹理描述符。
VI. DISCUSSION
VI. 讨论
In this paper, a number of experiments were performed to provide insight into the problem of predicting race and gender from NIR ocular images. Our broad findings are summarized below:
在本文中,我们进行了多项实验,以深入了解从近红外(NIR)眼部图像预测种族和性别的问题。我们的主要发现总结如下:
displayed a higher prediction accuracy than Caucasians with brown eyes (see Table XX). For gender prediction there was no observable impact based on eye color (see Table XIX). • Impact of image blur on race and gender prediction: The prediction accuracy for race degrades at a much faster rate than gender as the $\sigma$ value of the Gaussian filter for blurring is increased (see Table XVII).
在预测准确性方面,棕色眼睛的亚洲人比棕色眼睛的白种人表现出更高的预测准确性(见表 XX)。在性别预测方面,没有观察到眼睛颜色对预测结果的影响(见表 XIX)。
- 图像模糊对种族和性别预测的影响:随着高斯模糊滤波器的 $\sigma$ 值增加,种族预测的准确性下降速度比性别预测快得多(见表 XVII)。
VII. FUTURE WORK
VII. 未来工作
In future work, the number of predicted attributes could be expanded beyond just race and gender. Age, eye color [31] and texture smoothness are just a few of the other attributes that could be explored. Investigating the correlations between these attributes would be essential in better understanding the relationship between them and their role in iris recognition performance.
在未来的工作中,预测属性的数量可以扩展到种族和性别之外。年龄、眼睛颜色 [31] 和纹理平滑度只是可以探索的其他属性中的几个。研究这些属性之间的相关性对于更好地理解它们之间的关系及其在虹膜识别性能中的作用至关重要。
Previous work has shown [6] that the fusion of soft biometric information with a traditional biometric recognition system can increase the overall recognition accuracy of the system. Developing such a fusion framework for iris recognition based on the extracted attributes may result in improved performance in non-ideal scenarios.
先前的研究表明 [6],将软生物特征信息与传统生物识别系统融合可以提高系统的整体识别准确率。基于提取的属性开发这种融合框架,可能会在非理想场景中提高虹膜识别的性能。
BSIF outperforms other texture descriptors in most of the experiments presented in this paper. Future research could explore why BSIF outperforms the other texture descriptors in many of these experiments. Fusing the outputs of multiple texture descriptors and/or a convolutional neural network may result in further improvement in performance. Specifically, utilizing different descriptors on different ocular regions may result in improved attribute prediction. Finally, it may be possible to fuse the BSIF feature vector with the iris code to increase recognition performance and attribute prediction, simultaneously.
BSIF 在本文展示的大多数实验中优于其他纹理描述符。未来的研究可以探讨为什么 BSIF 在许多实验中优于其他纹理描述符。融合多个纹理描述符和/或卷积神经网络的输出可能会进一步提高性能。具体而言,在不同眼部区域使用不同的描述符可能会改善属性预测。最后,将 BSIF 特征向量与虹膜代码融合可能会同时提高识别性能和属性预测。
TABLE XVIII: Eye color statistics by ethnicity and gender for the BioCOP 2009 dataset.
表 XVIII: BioCOP 2009 数据集中按种族和性别统计的眼睛颜色数据。
| 眼睛颜色 | 白人 | 非白人 | 男性 | 女性 |
|---|---|---|---|---|
| 受试者 | 图像 | 受试者 | 图像 | |
| 棕色 | 267 | 10,330 | 228 | 8,470 |
| 蓝色 | 294 | 11,157 | 2 | 87 |
| 绿色 | 137 | 5,251 | 6 | 226 |
| 淡褐色 | 130 | 5,055 | 6 | 226 |
| 灰色 | 8 | 294 | 0 | 0 |
| 其他 | 0 | 0 | 18 | 734 |
TABLE XIX: Impact of eye color on gender prediction (BioCOP2009 using 8-bit BSIF with a $9\mathrm{x}9$ filter).
表 XIX: 眼睛颜色对性别预测的影响 (BioCOP2009 使用 8-bit BSIF 和 $9\mathrm{x}9$ 滤波器)。
| 眼睛颜色 | 男性左眼 | 男性右眼 | 女性左眼 | 女性右眼 |
|---|---|---|---|---|
| 棕色 | 86.8±3.4 | 87.0±2.33 | 79.0±3.4 | 81.0±2.2 |
| 蓝色 | 92.2±1.1 | 84.6±1.60 | 84.7±3.9 | 85.2±1.5 |
| 绿色 | 93.0±1.1 | 91.2±2.15 | 84.7±3.5 | 88.9±2.4 |
| 淡褐色 | 87.1±2.5 | 85.0±3.9 | 91.0±2.6 | 85.7±2.8 |
TABLE XX: Impact of eye color on race prediction (BioCOP2009 using 8-bit BSIF with a $9\mathrm{x}9$ filter).
表 XX: 眼睛颜色对种族预测的影响 (BioCOP2009 使用 8 位 BSIF 和 $9\mathrm{x}9$ 滤波器)
| 眼睛颜色 | 左眼 | 右眼 | 左眼 | 右眼 |
|---|---|---|---|---|
| 种族预测准确率 (%) | 高加索人 | 高加索人 | 非高加索人 | 非高加索人 |
| 棕色 | 79.1±3.2 | 83.6±2.9 | 90.4±1.2 | 90.5±1.5 |
| 蓝色 | 98.5±1.1 | 95.5±0.6 | 0.0±0.0 | 1.8±2.2 |
| 绿色 | 99.6±0.3 | 90.2±3.1 | 20.4±11.7 | 6.0±10.8 |
| 淡褐色 | 90.1±2.7 | 90.5±3.6 | 64.1±45.6 | 46.4±34.2 |
REFERENCES
参考文献

D enton Bobeldyk received the B.S. degree in Computer Science from Calvin College, Grand Rapids, United States, in 1995, and the M.S. from Grand Valley State University, Allendale in 2004. In 2008 he accepted a job at Davenport University, where he is currently an Associate Professor. He worked on a team to develop their Computer Science undergraduate and graduate programs. In 2013, he joined the PhD program at Michigan State University and is currently studying under Dr. Arun Ross in the iProbe research lab. He is the recipient of the Davenport
Denton Bobeldyk 于1995年在美国大急流城加尔文学院获得计算机科学学士学位,2004年在阿伦代尔的格兰德谷州立大学获得硕士学位。2008年,他加入达文波特大学,目前担任副教授。他曾参与团队开发该校的计算机科学本科和研究生课程。2013年,他加入密歇根州立大学的博士项目,目前正在iProbe研究实验室的Arun Ross博士指导下进行研究。他是达文波特大学的获奖者。
University 2014 Excellence in Teaching Award and was a finalist for the same award in 2018.
2014年大学卓越教学奖,并于2018年成为该奖项的决赛入围者。

A run Ross received the B.E. (Hons.) degree in computer science from the Birla Institute of Technology and Science, Pilani, Inida, in 1996, and the M.S. and Ph.D. degrees in computer science and engineering from Michigan State University, East Lansing, in 1999 and 2003, respectively. He has authored the books Introduction to Biometrics: A Textbook and Handbook of Multi biometrics, and coedited the book Handbook of Biometrics. His research interests include pattern recognition, classifier fusion, computer vision, and biometrics. He is a recipient of the NSF’s
A run Ross 于 1996 年在印度皮拉尼的 Birla Institute of Technology and Science 获得计算机科学学士(荣誉)学位,并于 1999 年和 2003 年分别在密歇根州立大学东兰辛分校获得计算机科学与工程硕士和博士学位。他撰写了《生物识别导论:教科书》和《多生物识别手册》,并合编了《生物识别手册》。他的研究兴趣包括模式识别、分类器融合、计算机视觉和生物识别。他是 NSF 的获得者。
CAREER Award and was designated a Kavli Frontier Fellow by the National Academy of Sciences in 2006. He is currently a Professor with the Department of Computer Science and Engineering, Michigan State University. He is a senior area editor of the IEEE Transactions on Image Processing; associate editor of the Image and Vision Computing Journal and ACM Computing Surveys; and Area Editor of the Computer Vision and Image Understanding Journal.
CAREER奖,并于2006年被美国国家科学院指定为Kavli前沿研究员。他目前是密歇根州立大学计算机科学与工程系的教授。他是IEEE Transactions on Image Processing的高级区域编辑;Image and Vision Computing Journal和ACM Computing Surveys的副编辑;以及Computer Vision and Image Understanding Journal的区域编辑。