更新说明
Artem Shmatko1,2,3,13, Alexander Wolfgang Jung2,4,5,6,13, Kumar Gaurav2,13, Søren Brunak4,7, Laust Hvas Mortensen5,7,8, Ewan Birney2 ✉, Tom Fitzgerald 2 ✉ & Moritz Gerstung1,2,9,10,11,12 ✉
Decision-making in healthcare relies on understanding patients’ past and current health states to predict and, ultimately, change their future course1–3. Artificial intelligence (AI) methods promise to aid this task by learning patterns of disease progression from large corpora of health records4,5. However, their potential has not been fully investigated at scale. Here we modify the GPT6 (generative pretrained transformer) architecture to model the progression and competing nature of human diseases. We train this model, Delphi-2M, on data from 0.4 million UK Biobank participants and validate it using external data from 1.9 million Danish individuals with no change in parameters. Delphi-2M predicts the rates of more than 1,000 diseases, conditional on each individual’s past disease history, with accuracy comparable to that of existing single-disease models. Delphi-2M’s generative nature also enables sampling of synthetic future health trajectories, providing meaningful estimates of potential disease burden for up to 20 years, and enabling the training of AI models that have never seen actual data. Explain able AI methods7 provide insights into Delphi-2M’s predictions, revealing clusters of co-morbid i ties within and across disease chapters and their time-dependent consequences on future health, but also highlight biases learnt from training data. In summary, transformer-based models appear to be well suited for predictive and generative health-related tasks, are applicable to population-scale datasets and provide insights into temporal dependencies between disease events, potentially improving the understanding of personalized health risks and informing precision medicine approaches.
医疗决策依赖于理解患者的过去和当前健康状况,以预测并最终改变其未来$病程^{1-3}$。人工智能 (AI) 方法有望通过从大量健康记录中学习疾病进展模式来辅助这一$任务^{4,5}$。然而,其潜力尚未得到大规模充分探索。本文我们修改 $GPT^6$ (生成式预训练 Transformer) 架构,以模拟人类疾病的进展和竞争性质。我们在来自 40 万英国生物银行参与者的数据上训练该模型 Delphi-2M,并使用来自 190 万丹麦个体的外部数据(参数未作任何更改)进行验证。Delphi-2M 在给定个体既往疾病史的条件下,预测超过 1,000 种疾病的发生率,其准确性与现有的单疾病模型相当。Delphi-2M 的生成特性还支持对合成未来健康轨迹进行采样,提供长达 20 年的潜在疾病负担的有意义估计,并使得训练从未见过真实数据的 AI 模型成为可能。可解释 AI 方法 7 提供了对 Delphi-2M 预测的洞察,揭示了疾病章节内部和跨章节的共病聚类及其对未来健康的时序依赖性后果,同时也凸显了从训练数据中学到的偏差。总之,基于 Transformer 的模型似乎非常适合预测性和生成性健康相关任务,可应用于人群规模的数据集,并提供对疾病事件间时间依赖关系的洞察,有可能改善对个性化健康风险的理解并为精准医疗方法提供信息。
The progression of human disease across age is characterized by periods of health, episodes of acute illness and also chronic debilitation, often manifesting as clusters of co-morbidity. Patterns of multimorbidity affect individuals unevenly and have been associated with lifestyle, heritable traits and socioeconomic status1–3. Understanding each individual’s multi-morbidity risks is important to tailor healthcare decisions, motivate lifestyle changes or direct entrance into screening programs, as is the case for cancer8,9. Critically, health cannot only be understood by the presentation of individual diagnoses but, rather, in the context of an individual’s co-morbid i ties and their evolution over time. While a wide range of prediction algorithms exist for specific diseases, from cardiovascular disease to cancer10–12, few algorithms are capable of predicting the full spectrum of human disease, which recognizes more than 1,000 diagnoses at the top level of the International Classification of Diseases, Tenth Revision (ICD-10) coding system.
人类疾病随年龄发展的特征表现为健康期、急性病发作期以及慢性衰弱期,通常以共病集群的形式呈现。多重病症模式对个体的影响存在差异,并与生活方式、遗传特征和社会经济地位$相关^{1-3}$。了解个体的多重病症风险对于定制医疗决策、推动生活方式改变或指导参与筛查项目至关重要,癌症筛查$案例^{8-9}$即是如此。关键的是,健康不能仅通过单一诊断表现来理解,而应结合个体的共病及其随时间演变的情境来考量。虽然现有针对特定疾病(从心血管疾病到$癌症^{10-12}$)的预测算法种类繁多,但能够预测人类全谱系疾病的算法寥寥无几——国际疾病分类第十版(ICD-10)编码系统顶层就包含逾千种诊断类别。
Learning and predicting patterns of disease progression is also important in populations that are ageing and that exhibit shifts in their underlying demographic’s morbid i ties. For example, it has been predicted that, globally, the number of cancer diagnoses will increase $77%$ by 2050 (ref. 13) or that, in the UK, the number of working-age individuals with major illnesses, including depression, asthma, diabetes, cardiovascular disease, cancer or dementia, will increase from 3 to 3.7 million by 2040 (ref. 14). Modelling the expected burden of disease is therefore critical for healthcare and economic planning and, moreover, the continual tracking of disease occurrence along with its likely future prevalence within population groups promotes a more informed healthcare system.
学习和预测疾病进展模式对于人口老龄化和基础人口发病率发生变化的人群也至关重要。例如,据预测,到2050年全球癌症诊断数量将增加77%(参考文献13);或在英国,患有重度疾病(包括抑郁症、哮喘、糖尿病、心血管疾病、癌症或痴呆症)的劳动年龄人口数量到2040年将从300万增至370万(参考文献14)。因此,模拟预期疾病负担对医疗保健和经济规划至关重要,此外,持续追踪疾病发生情况及其在人群中的未来可能患病率,有助于构建更知情的医疗保健系统。
Recent developments in AI may help to address some method o logical limitations of multi-morbidity modelling, which have so far proved difficult to overcome15. Aside from the great number of diagnoses, these include challenges in modelling temporal dependencies among previous events, the integration of potentially diverse prognostic ally relevant data and the statistical calibration of predictions. Large language models (LLMs)16–19—a subfield of AI that enables chatbots such as ChatGPT20,21—model language as a sequence of word fragments (tokens). Generated token by token, the new text is based on all preceding text
近期人工智能 (AI) 的发展可能有助于解决多病建模中一些难以克服的$方法学局限性^{15}$。除了诊断数量庞大之外,这些挑战还包括对既往事件间时间依赖性的建模、整合预后相关的多样化数据以及预测的统计校准。$大语言模型 (LLM)^{16–19}$——作为AI的一个分支领域,支撑了诸如$ChatGPT^{20,21}$等聊天机器人——将语言建模为词片段 (token) 的序列。新文本基于所有前文内容逐token生成。
and, with enough training, the statistical dependencies among these tokens prove sufficient to produce context-aware and even conversational text, which is often indistinguishable from that of a human counterpart.
并且,在足够的训练后,这些token之间的统计依赖性足以生成具有上下文感知能力甚至对话性的文本,其表现往往与人类生成的文本难以区分。
The analogy between LLMs and disease progression modelling, which also entails recognizing past events and exploiting their mutual dependencies to predict the future sequence of morbidity, has recently inspired a series of new AI models. For example, BERT-based models22–25 have been developed for specific prediction tasks. Transformer models trained on electronic health records have been used for predicting diagnoses such as pancreatic cancer26, self-harm25 and stroke24, as well as non-clinical parameters such as self-esteem27. However, despite promising proofs of concept4,28,29, the potential for comprehensive and generative multi-morbidity modelling has not yet been fully assessed.
大语言模型与疾病进展建模之间的类比,最近启发了一系列新的人工智能模型,这种类比也需要识别过去事件并利用它们的相互依赖关系来预测未来的发病序列。例如,基于$BERT的模型^{22–25}$已被开发用于特定的预测任务。在电子健康记录上训练的Transformer模型已被用于预测$胰腺癌^{26}$、$自残^{25}$和$中风^{24}$等诊断,以及$自尊心^{27}$等非临床参数。然而,尽管有前景的$概念验证^{4,28,29}$,全面和生成性多病建模的潜力尚未得到充分评估。
Here we demonstrate that attention-based transformer models, similar to LLMs, can be extended to learn lifetime health trajectories and accurately predict future disease rates for more than 1,000 diseases simultaneously on the basis of previous health diagnoses, lifestyle factors and further informative data. Our extended model, termed Delphi-2M, was trained on data from the UK Biobank, a population-scale research cohort, and validated on Danish population registries. The vocabulary of the model includes ICD-10 top-level diagnostic codes, as well as sex, body mass, smoking, alcohol consumption and death. Delphi provides individual-level predictions of multi-disease incidences and models future health trajectories at any point throughout an individual’s life course. Moreover, the internal model of Delphi offers insights into how past data influence the rates of subsequent diseases. We further assess biases and fairness across demographic subgroups and discuss Delphi’s potential as a framework for healthcare modelling.
在此我们证明,基于注意力的Transformer模型(类似于大语言模型)可扩展用于学习终身健康轨迹,并基于既往健康诊断、生活方式因素及其他信息数据,同时准确预测1000多种疾病的未来发病率。我们的扩展模型名为Delphi-2M,基于英国生物银行(一个大规模人群研究队列)的数据进行训练,并在丹麦人口登记库中完成验证。该模型的词汇表包含ICD-10顶级诊断代码,以及性别、体重、吸烟、饮酒和死亡信息。Delphi可提供个体层面的多疾病发病率预测,并对个体生命历程中任意时间点的未来健康轨迹进行建模。此外,Delphi的内部模型揭示了既往数据如何影响后续疾病发病率。我们进一步评估了人口统计学亚组间的偏差与公平性,并探讨了Delphi作为医疗建模框架的潜力。
A transformer model for health records
基于Transformer的健康记录模型
A person’s health trajectory can be represented by a sequence of diagnoses using top-level ICD-10 codes recorded at the age of first diagnosis as well as death. Furthermore, ‘no event’ padding tokens were randomly added at an average rate of 1 per 5 years to eliminate long intervals without other inputs, which are especially frequent for younger ages and during which the baseline disease risk can change substantially (Extended Data Fig. 1). Together, these data comprise 1,258 distinct states—tokens in LLM terminology. Additional information includes sex, body mass index (BMI) and indicators of smoking and alcohol consumption, which are used as input information but not predicted by the model (Fig. 1a).
个人的健康轨迹可以通过一系列诊断来表示,这些诊断使用首次诊断时记录的顶级ICD-10代码以及死亡信息。此外,平均每5年随机添加一个"无事件"填充标记 (padding token) ,以消除没有其他输入的长时间间隔,这种情况在年轻时尤其常见,且在此期间基线疾病风险可能发生显著变化 (扩展数据图 1) 。这些数据共同构成了1,258个不同的状态——即大语言模型 (LLM) 术语中的标记 (Token) 。附加信息包括性别、体重指数 (BMI) 以及吸烟和饮酒指标,这些信息用作模型的输入信息,但不由模型预测 (图 1a) 。
Training data comprised 402,799 $(80%)$ participants of the UK Biobank recorded before the 1 July 2020. Data for the remaining 100,639 $(20%)$ participants were used for validation and hyper parameter optimization, while all records for 471,057 $(94%)$ participants still alive on 1 July 2020 were used for longitudinal testing up until 1 July 2022 (Fig. 1b). Additional external testing was conducted on the Danish disease registry data, which covered 1.93 million Danish nationals and spanned the period from 1978 to 2018.
训练数据包含截至2020年7月1日前记录的402,799名$(80%$)英国生物银行参与者。其余100,639名$(20%$)参与者的数据用于验证和超参数优化,而截至2020年7月1日仍存活的471,057名$(94%$)参与者的所有记录被用于纵向测试至2022年7月1日 (图 1b) 。额外外部测试在丹麦疾病登记数据进行,该数据覆盖193万丹麦国民,时间跨度从1978年至2018年。
To model disease history data, which, in contrast to text, occurs on a continuous time axis, we extended the GPT-2 architecture 6 (Fig. 1c). Transformer models map their inputs into an embedding space, where information is successively aggregated to enable auto regressive predictions. The first change therefore replaces GPT’s positional encoding, a mapping that identifies each text token’s discrete position, with an encoding of continuous age using sine and cosine basis functions 16. Standard GPT models only predict the next token using a multi no mi al probability model. Thus, the second extension is the addition of another output head to also predict the time to the next token using an exponential waiting time model (Methods). Third, GPT’s causal attention masks, which ensure that the model accesses only information from past events, are amended to additionally mask tokens recorded at the same time. Padding, lifestyle and sex tokens use a similar encoding but do not enter the likelihoods, as the model is deliberately not trained to predict them.
为对疾病史数据进行建模(与文本不同,疾病史数据存在于连续时间轴上),我们扩展了GPT-2架构(图1c)。Transformer模型将其输入映射到嵌入空间,在该空间中信息被逐步聚合以实现自回归预测。因此,第一项改动是用基于正弦和余弦基函数的连续年龄编码,取代了GPT的位置编码(一种标识每个文本token离散位置的映射)。标准GPT模型仅使用多项概率模型预测下一个token。因此,第二项扩展是增加另一个输出头,使用指数等待时间模型也预测到下一个token的时间(方法部分)。第三,GPT的因果注意力掩码(确保模型仅访问过去事件的信息)被修改,以额外掩码在同一时间记录的token。填充token、生活方式token和性别token使用类似的编码,但不进入似然函数,因为模型被特意设计为不训练预测这些token。
We term this model Delphi (Delphi large predictive health inference). This architecture enables one to provide the model with a partial health trajectory (prompt in LLM terminology) to calculate the subsequent rate (per day) for each of the 1,256 disease tokens plus death. Furthermore, the next token and the time to this event can be sampled on the basis of these rates. Iterative ly, this procedure samples entire health trajectories (Fig. 1d).
我们将该模型称为Delphi (Delphi大型预测健康推理模型) 。该架构支持向模型输入部分健康轨迹 (即大语言模型术语中的提示) ,以计算1,256个疾病token及死亡事件的后续每日发生率。此外,基于这些发生率可采样下一个token及该事件的发生时间。通过迭代执行此过程,可采样完整的健康轨迹 (图1d) 。
A systematic screen of architecture hyper parameters (embedding dimensionality, number of layers, heads) confirms the reported empirical scaling laws30, which state that model performance increases with the number of datapoints and, up to a limit defined by the available data, as the number of parameters increases (Fig. 1e). The screen indicates that, for the UK Biobank dataset, optimal Delphi models have around 2 million parameters. One of the models within the optimal range has an internal embedding dimensionality of 120, 12 layers and 12 heads, amounting to a total of 2.2 million parameters. Results based on this model parameter iz ation are discussed throughout the rest of the paper. We note that qualitatively similar results are obtained from other parameter choices (Extended Data Fig. 2 and Supplementary Fig. 1).
对架构超参数 (嵌入维度、层数、头数) 的系统性筛选证实了已报道的经验缩放规律 [30] ,该规律指出模型性能随数据点数量提升,并在可用数据定义的限度内随参数数量增加而提升 (图 1e) 。筛选表明,对于 UK Biobank 数据集,最优的 Delphi 模型拥有约 200 万个参数。处于最优范围内的其中一个模型具有 120 的内部嵌入维度、12 层和 12 个头,总计 220 万个参数。本文其余部分将讨论基于此模型参数化的结果。我们注意到其他参数选择也可获得定性相似的结果 (扩展数据图 2 和补充图 1) 。
An ablation analysis shows how Delphi-2M architectural modifications contribute to a better age- and sex-stratified cross-entropy compared with a standard GPT model (Fig. 1f, Supplementary Table 1 and Supplementary Fig. 2). A good, albeit slightly inferior, classification performance at different ages may already be achieved by adding regular ‘no event’ padding tokens to the input data with GPT models alone. However, a key distinguishing feature of Delphi compared with basic GPT models is its ability to calculate the absolute rates of tokens, which provide consistent estimates of inter-event times (Fig. 1g). This property also implies that the rates may be interpreted as the incidences of tokens.
一项消融分析展示了Delphi-2M架构修改如何实现比标准GPT模型更优的年龄与性别分层交叉熵 (图 1f, 补充表 1 和 补充图 2)。仅通过向GPT模型的输入数据添加常规的"无事件"填充token,就可在不同年龄段实现良好(虽略逊一筹)的分类性能。然而,Delphi与基础GPT模型的关键区别在于其计算token绝对发生率的能力,这提供了事件间隔时间的一致性估计 (图 1g)。这一特性也意味着发生率可解释为token的发病密度。
Modelling multi-disease incidences
多疾病发病率建模
Delphi-2M’s accuracy in predicting diverse disease outcomes in the validation cohort is compared to the sex and age-stratified incidence as an epidemiological baseline. As can be seen in the ten examples shown in Fig. 2a, the incidence curves are very varied, with some diseases, such as chickenpox, peaking in infancy, while others, such as asthma or depression, are relatively flat and with most rising exponentially in old age. Moreover, there are noticeable differences between the sexes, which are obvious for breast cancer but also pronounced for diabetes, depression, acute myocardial infarction and death. Delphi-2M’s predictions are updated for each individual when new inputs are recorded. The predictions largely follow the sex- and age-stratified incidence curves but also indicate events or periods when the individual risk remains below or rises above the population average. For some diseases, such as asthma or arthrosis, the spread is narrow, indicating a limited ability to predict beyond the sex- and age-incidence trend. Yet for other diseases, including septic a emi a, and also death, the spread is wide, indicating predictable inter-individual differences in disease rates.
在验证队列中,将Delphi-2M预测多种疾病结局的准确性与按性别和年龄分层发病率作为流行病学基线进行比较。从图2a所示的十个示例可以看出,发病率曲线差异显著:有些疾病(如水痘)在婴儿期达到峰值,而其他疾病(如哮喘或抑郁症)的曲线相对平缓,且大多数疾病在老年期呈指数级上升。此外,性别间存在明显差异,这在乳腺癌中尤为突出,在糖尿病、抑郁症、急性心肌梗死和死亡中也很显著。当记录新的输入数据时,Delphi-2M会更新每个个体的预测结果。这些预测大体遵循性别和年龄分层的发病率曲线,同时能标示出个体风险低于或高于人群平均水平的特定事件或时期。对于某些疾病(如哮喘或关节病),预测分布范围较窄,表明超越性别和年龄发病率趋势的预测能力有限。然而对于其他疾病(包括败血症和死亡),预测分布范围较宽,表明疾病发生率存在可预测的个体间差异。
Delphi’s ability to predict the next diagnosis token across the spectrum of human disease is confirmed by the average age-stratified area under the receiver operating characteristic curve (AUC), which averages at values of approximately 0.76 in the internal validation data (Fig. 2b and Supplementary Table 2). For $97%$ of diagnoses, the AUC was greater than 0.5, indicating that the vast majority followed patterns with at least partial predictability. These patterns were found to be true across the different chapters of the ICD-10 spectrum, which define broad groups of disease for both sexes (Fig. 2c,d). Among the most confidently predicted next events is death, with an age-stratified AUC of 0.97 in both sexes. Importantly, calibration analyses in 5-year age brackets show that the predicted rates closely match the observed number of cases, showing that the models’ rates of the next tokens are consistently estimated (Extended Data Fig. 3).
Delphi 预测人类疾病谱系中下一个诊断 token 的能力通过平均年龄分层的受试者工作特征曲线下面积 (AUC) 得到证实,其在内部验证数据中的平均值约为 0.76 (图 2b 和补充表 2)。对于 $97%$ 的诊断,AUC 大于 0.5,表明绝大多数诊断遵循至少具有部分可预测性的模式。这些模式在 ICD-10 谱系的不同章节中均成立,这些章节定义了两性的广泛疾病组别 (图 2c,d)。在预测置信度最高的下一个事件中包括死亡,两性的年龄分层 AUC 均为 0.97。重要的是,5 岁年龄分组的校准分析表明,预测率与观察到的病例数高度匹配,显示模型对下一个 token 的比率估计是一致的 (扩展数据图 3)。
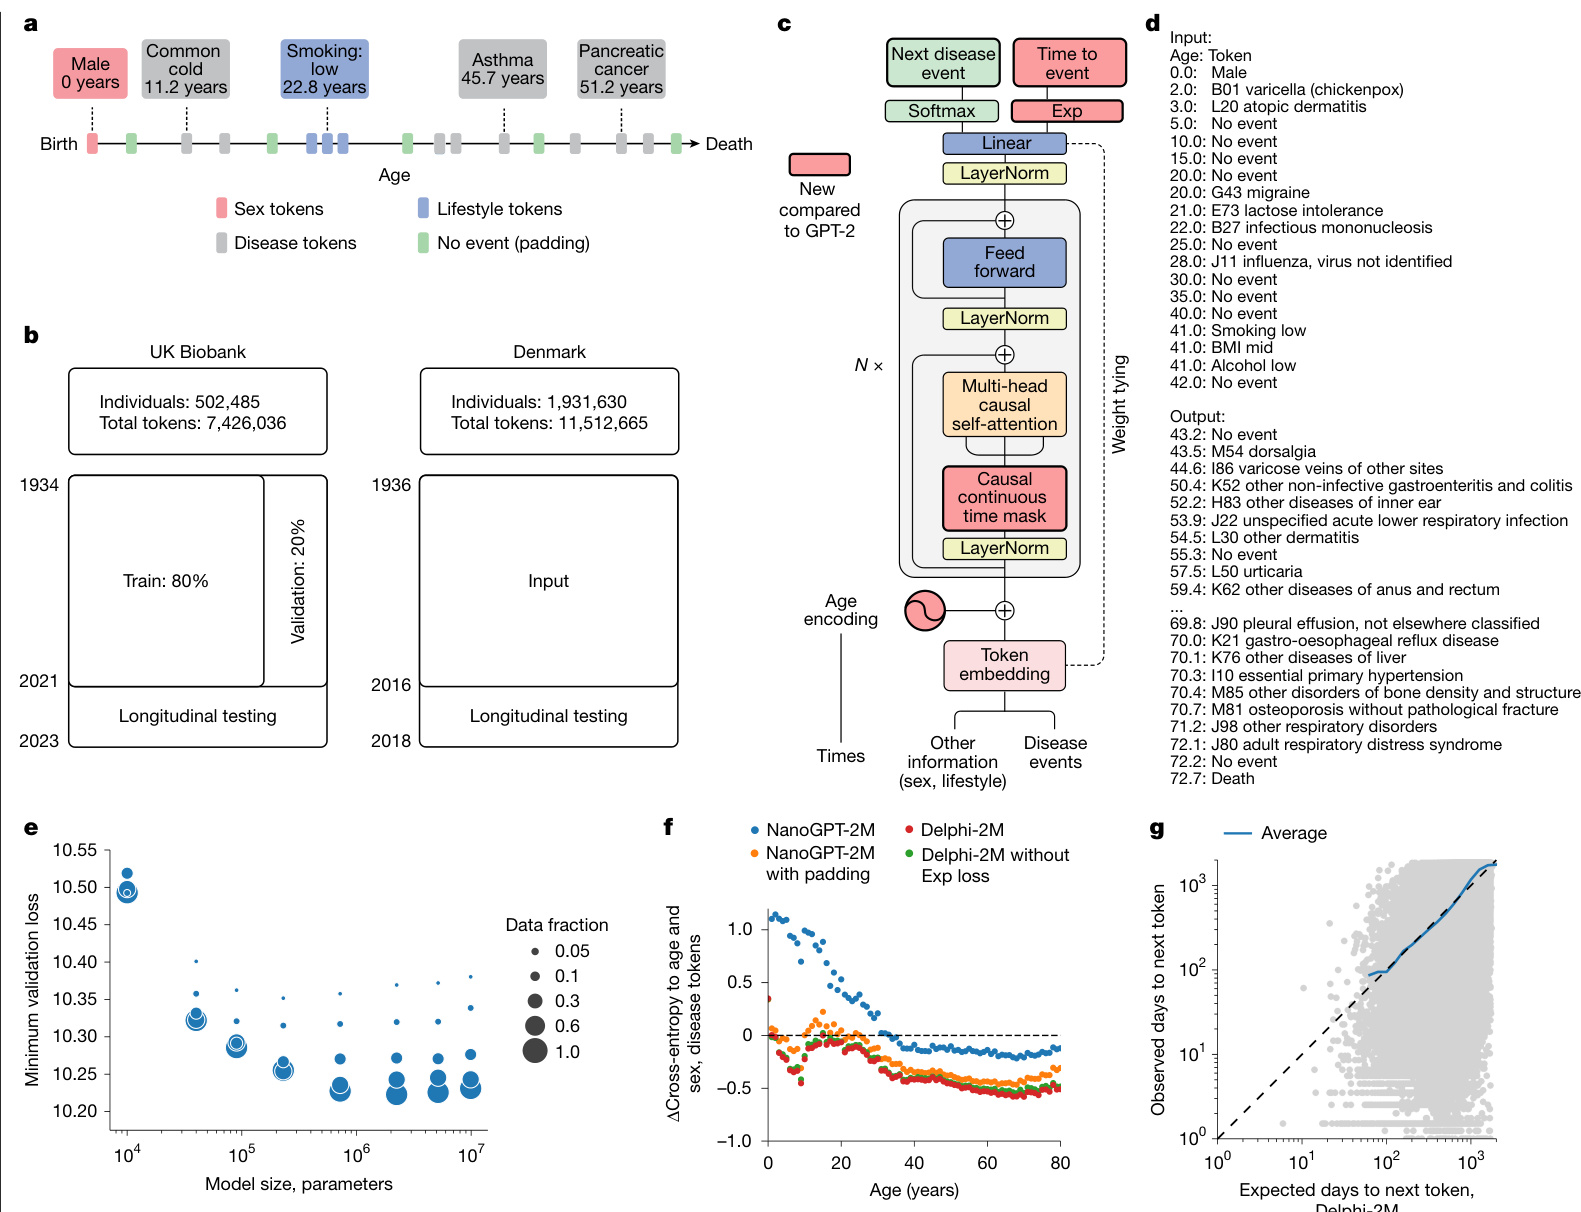
Fig. 1 | Delphi, a modified GPT architecture, models health trajectories. a, Schematic of health trajectories based on ICD-10 diagnoses, lifestyle and healthy padding tokens, each recorded at a distinct age. b, Training, validation and testing data derived from the UK Biobank (left) and Danish disease registries (right). c, The Delphi model architecture. The red elements indicate changes compared with the underlying GPT-2 model. $\mathbf{\nabla}^{\prime}N\times\mathbf{\nabla}^{\prime}$ denotes applying the transformer block sequentially N times. d, Example model input (prompt) and output (samples) comprising (age:token) pairs. e, Scaling laws of Delphi, showing the optimal validation loss as a function of model parameters for different training data sizes. f, Ablation results measured by the cross-entropy differences relative to an age- and sex-based baseline (y axis) for different ages (x axis). g, The accuracy of predicted time to event. The observed (y axis) and expected (x axis) time to events are shown for each next token prediction (grey dots). The blue line shows the average across consecutive bins of the x axis.
图 1 | Delphi,一种改进的 GPT 架构,用于建模健康轨迹。a,基于 ICD-10 诊断、生活方式和健康填充 Token 的健康轨迹示意图,每个记录对应不同年龄。b,来自英国生物银行(左)和丹麦疾病登记处(右)的训练、验证和测试数据。c,Delphi 模型架构。红色元素表示与底层 GPT-2 模型相比的更改。$\mathbf{\nabla}^{\prime}N\times\mathbf{\nabla}^{\prime}$ 表示顺序应用 Transformer 块 N 次。d,示例模型输入(提示)和输出(样本),包含(年龄:Token)对。e,Delphi 的缩放定律,显示了不同训练数据规模下,最佳验证损失随模型参数变化的函数关系。f,针对不同年龄(x 轴)的消融实验结果,以相对于基于年龄和性别的基线(y 轴)的交叉熵差异衡量。g,预测事件发生时间的准确性。对于每个下一个 Token 预测(灰点),显示了观察到的事件发生时间(y 轴)和预期的事件发生时间(x 轴)。蓝线显示了 x 轴连续分箱的平均值。
Next-event predictions are often the consequence of acute illness or diagnostic refinements that accrue over the course of a few weeks or months, which may be undesirable for prognostication. Delphi-2M’s average AUC values decrease from an average of 0.76 to 0.70 after 10 years, indicating that its predictions are also relevant for longterm prognostication (Fig. 2e and Supplementary Fig. 3). Similar results were observed in longitudinal test data, which also show no substantial shift in diagnostic patterns throughout the Biobank’s follow-up (Supplementary Fig. 4).
短期预后预测通常是急性疾病或在数周或数月内累积的诊断细化所导致的结果,这可能不利于预后评估。Delphi-2M 的平均 AUC 值在 10 年后从 0.76 降至 0.70,表明其预测同样适用于长期预后评估 (图 2e 和补充图 3) 。纵向测试数据中也观察到类似结果,这些数据同时显示生物样本库随访期间诊断模式未发生显著变化 (补充图 4) 。
The performance of Delphi was similar to routinely used clinical risk scores for cardiovascular disease and dementia, and better than those used for death. For diabetes, the performance of Delphi was worse compared with the use of a single marker, HbA1c, which is used clinically for risk prediction and diagnosis of diabetes (Fig. 2f, Supplementary Fig. 4c and Supplementary Table 3). This was the case for next-event predictions, as well as prediction horizons up to
Delphi的表现与心血管疾病和痴呆症的常规临床风险评分相当,且优于死亡风险评分。在糖尿病方面,Delphi的表现不如临床用于风险预测和糖尿病诊断的单一标志物HbA1c (图 2f、补充图 4c和补充表 3) 。这一结论适用于下次事件预测以及长达24个月的预测时间范围。
24 months. Delphi-2M’s AUC values were also generally higher than those of a recent machine learning algorithm that calculates the risks of a similarly broad spectrum of ICD-10 diagnoses using 67 different biomarkers available through the UK Biobank31, even though for many diagnoses, such as diabetes, biomarkers remain indispensable (Fig. 2e and Extended Data Fig. 4), marking potential for future modifications of Delphi that additionally use data beyond health records (Extended Data Fig. 5). For most cases, Delphi-2M’s multidisease predictions match or exceed current risk models for individual disease outcomes and offer the great advantage of enabling the simultaneous assessment of more than 1,000 diseases and their timing at any given time, while also surpassing multi-disease models in quality.
Delphi-2M的AUC值通常也高于最近的一种机器学习算法,该算法使用英国生物银行提供的67种不同生物标志物来计算类似广泛的ICD-10诊断风险31,尽管对于许多诊断(如糖尿病),生物标志物仍然不可或缺(图2e和扩展数据图4),这标志着Delphi未来修改的潜力,即额外使用健康记录之外的数据(扩展数据图5)。在大多数情况下,Delphi-2M的多疾病预测与当前针对单个疾病结局的风险模型相当或更优,并具有同时评估超过1,000种疾病及其在任何给定时间的时间点的巨大优势,同时在质量上也超过了多疾病模型。
Sampling future disease trajectories
采样未来疾病轨迹
One of the most promising features of generative models is the ability to sample disease trajectories, conditional on data recorded up to a certain point. This is a property that few conventional epi de mio logical models possess.
生成模型最有前景的特性之一是能够根据截至某个时间点所记录的数据,对疾病轨迹进行条件采样。这是传统流行病学模型很少具备的特性。
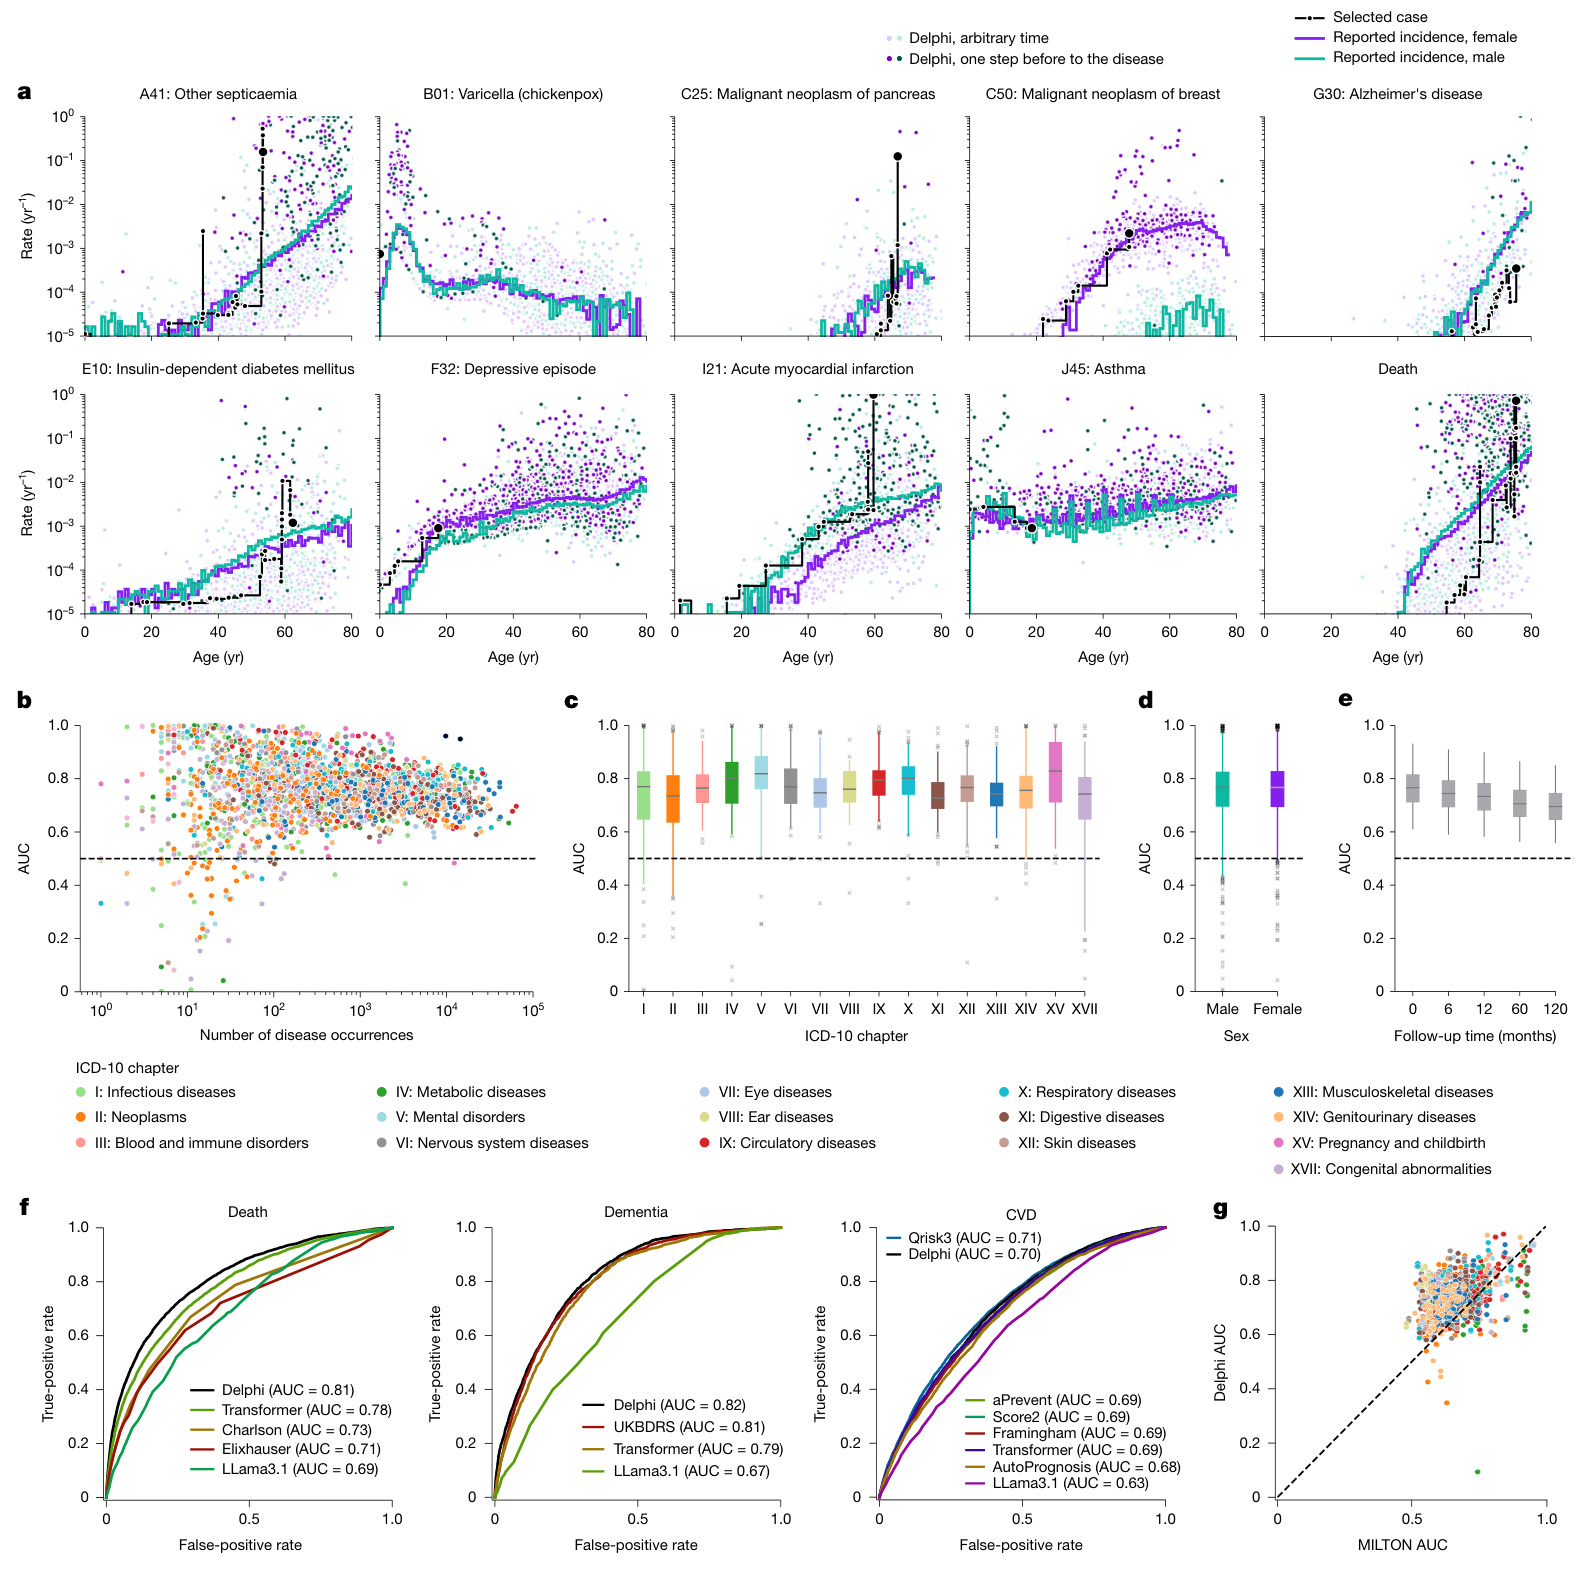
Fig. 2 | Delphi-2M accurately models the rates of a wide range of diseases. a, The predicted rates for nine exemplary diagnoses and death (y axis) as a function of age (x axis). The points show predictions at each recorded input token. Colours separate biological sex; the darker colours indicate predictions immediately before the diagnosis in question. The purple and turquoise lines are disease rates observed for each yearly age bin in the training data. The solid black line connects consecutive predictions for one randomly selected case throughout age. b, Average age–sex-stratified AUC values (y axis) as a function of training occurrences (x axis). Shown are data for $n=906$ diagnoses for male individuals and $n=957$ diagnoses for female individuals for which a sufficient number of events was recorded in the validation data to evaluate AUC values. c, The same as b, but aggregated by the ICD-10 chapter. d, The same as b, aggregated by sex. e, AUC values of all diagnoses in b for different time gaps between prediction and diagnoses (x axis). f, ROC curves for Delphi and other clinical or machine learning methods for three selected end points evaluated on the internal longitudinal testing set. g, AUC values of MILTON31, a biomarkerbased machine learning model (x axis), in prognostic mode, compared with Delphi-2M AUC values from the UK Biobank validation set (y axis) for $n=410$ diagnoses. The box plots in c–e show the median (centre line), the first to the third quartile (box limits) and the 0.025 and 0.975 quantiles (whiskers).
图 2 | Delphi-2M 精准模拟多种疾病的发生率。 a, 九项代表性诊断及死亡 (y轴) 的预测发生率随年龄 (x轴) 的变化关系。散点表示每个输入 token 对应的预测值。颜色区分生理性别;深色标示目标诊断发生前的预测值。紫色和青绿色线条为训练数据中各年龄分段的实际疾病发生率。黑色实线连接随机选取个案在整个年龄段的连续预测值。 b, 按年龄-性别分层的平均 AUC 值 (y轴) 随训练出现次数 (x轴) 的变化。数据显示男性 n=906 项诊断、女性 n=957 项诊断,这些诊断在验证数据中具有足够事件数用于评估 AUC 值。 c, 同 b, 但按 ICD-10 章节汇总。 d, 同 b, 按性别汇总。 e, b 中所有诊断在不同预测-诊断时间间隔 (x轴) 下的 AUC 值。 f, 在内部纵向测试集上评估三种重点结局时,Delphi 与其他临床或机器学习方法的 ROC 曲线。 g, 预后模式下基于生物标志物的机器学习模型 MILTON31 的 AUC 值 (x轴),与英国生物银行验证集中 Delphi-2M 对 n=410 项诊断的 AUC 值 (y轴) 对比。c-e 中的箱线图显示中位数 (中心线)、第一至第三四分位数 (箱体范围) 以及 0.025 和 0.975 分位数 (须线)。
To systematically assess the influence of medical histories on future health, we sampled health trajectories for each participant from the UK Biobank validation cohort on the basis of data available until the age of 60 years (Fig. 3a). This provides the opportunity to compare 63,662 sampled and observed trajectories. When evaluated at the population level, the disease incidences at ages 70–75 years are well recapitulated, showing that the overall distributions are well preserved by iterative sampling (Fig. 3b). This is further confirmed by the cross-entropy loss of sampled trajectories, which is, on average, indistinguishable from the observed data but drops when the preceding disease histories are shuffled between participants (Supplementary Fig. 5b).
为系统评估病史对未来健康的影响,我们根据截至60岁的可用数据,从英国生物银行验证队列中为每位参与者抽取了健康轨迹 (图 3a) 。这为比较63,662条抽样轨迹与观测轨迹提供了机会。在人群层面进行评估时,70-75岁的疾病发病率得到了良好再现,表明迭代抽样很好地保留了整体分布 (图 3b) 。抽样轨迹的交叉熵损失进一步证实了这一点,其平均值与观测数据无显著差异,但当参与者间的既往病史被打乱时该损失会下降 (补充图 5b) 。
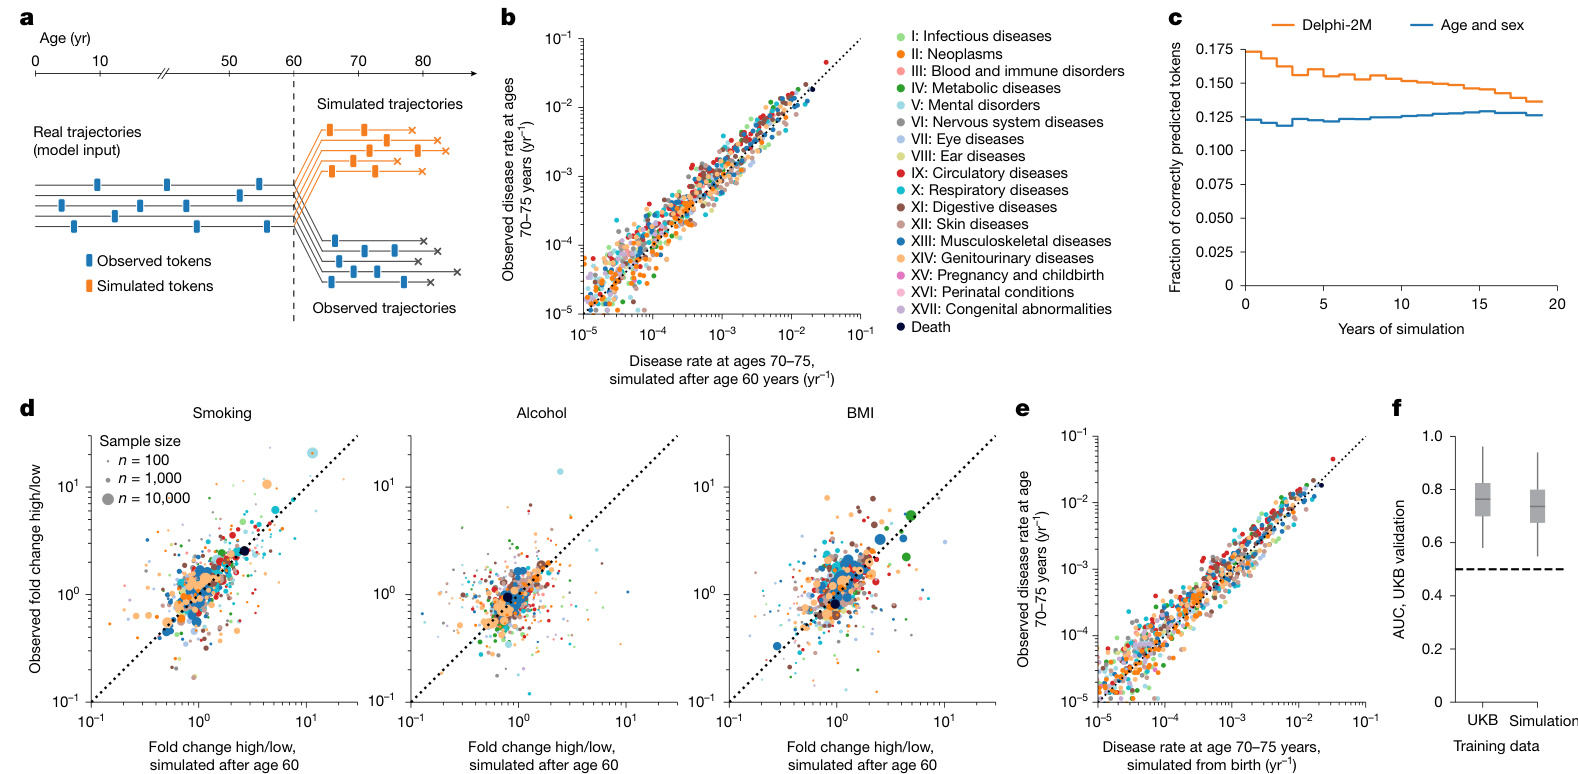
Fig. 3 | Generative modelling with Delphi-2M informs future outcomes. a, Schematic of the experiment design. Delphi-2M is used to simulate health trajectories using validation data $?n=63,622$ individuals with disease records both before and after 60 years of age) observed until the age of 60. A single trajectory is simulated per individual. Subsequently, simulated trajectories are compared to the observed outcomes for the same person. b, Delphi-2Mmodelled disease rates at ages 70–75 years (x axis) compared with observed rates at the same ages (y axis). c, The fraction of correctly predicted diagnoses (y axis) per 1-year age bin as a function of the years after simulation started at age 60 years (x axis). Delphi-2M, orange. The blue curve uses age and sex as a prediction baseline. d, Simulated (x axis) and observed (y axis) fold changes of disease rates for high versus low smoking, alcohol consumption and BMI groups. The evaluation period included ages 70–75 years and used simulations from the age of 60 years. e, The same as b, evaluated for simulations from birth. f, The AUC values of disease risk prediction $\scriptstyle(n=1,334$ disease–sex pairs) for Delphi when trained on UKB and Delphi-2M-sampled synthetic data (Methods). The box plots show the median (centre line), the first to the third quartile (box limits) and the 0.025 and 0.975 quantiles (whiskers).
图 3 | 使用 Delphi-2M 进行生成式建模预测未来健康结果。a, 实验设计示意图。Delphi-2M 被用于模拟健康轨迹,使用的验证数据为 $n=63,622$ 名在 60 岁前后均有疾病记录的个体,观测至 60 岁。为每个个体模拟一条轨迹。随后,将模拟轨迹与同一个体的实际观测结果进行比较。b, Delphi-2M 模拟的 70-75 岁疾病发生率 (x 轴) 与同年龄段实际观测发生率 (y 轴) 的对比。c, 在每个 1 岁年龄组中,正确预测的诊断比例 (y 轴) 随模拟从 60 岁开始后的年数 (x 轴) 的变化函数。Delphi-2M 为橙色曲线。蓝色曲线使用年龄和性别作为预测基线。d, 高吸烟量、高酒精摄入量和高 BMI 组与低水平组相比,疾病发生率的模拟倍数变化 (x 轴) 和观测倍数变化 (y 轴)。评估期为 70-75 岁,模拟从 60 岁开始。e, 与 b 相同,但评估的是从出生开始的模拟。f, 使用 UKB 数据和 Delphi-2M 生成的合成数据训练 Delphi 模型后,其疾病风险预测的 AUC 值 $\scriptstyle(n=1,334$ 个疾病-性别组合) (方法)。箱线图显示了中位数 (中心线)、第一至第三四分位数 (箱体界限) 以及 0.025 和 0.975 分位数 (须线)。
In the first year of sampling, there are on average $17%$ disease tokens that are correctly predicted, and this drops to less than $14%20$ years later. These figures compare to values of $12-13%$ of correctly predicted disease tokens using sex and age alone, confirming that the conditional generation helps to make more accurate predictions of future events (Fig. 3c and Supplementary Fig. 5c,d).
在采样第一年,平均有 $17%$ 的疾病标记被正确预测,20年后这一比例降至不足 $14%$。相比之下,仅使用性别和年龄的正确预测疾病标记比例为 $12-13%$,这证实了条件生成有助于更准确地预测未来事件 (图 3c 和补充图 5c,d)。
Delphi-2M’s ability to simulate differential health outcomes over a decade or more, on the basis of each individual’s health history, manifests in a multitude of ways. For example, the changes in disease burden in different population subsets defined by smoking, alcohol consumption or BMI are well predicted (Fig. 3d and Extended Data Fig. 6a). Similar findings are observed when the population is stratified by the presence of previous diseases or by estimated disease risks (Extended Data Fig. 6b,c). Together, these analyses show that Delphi-2M’s conditional samples provide meaningful extrapolations for future health courses, which reflect the influence of past health events.
Delphi-2M 基于个体健康史模拟十年或更长时间内差异化健康结果的能力体现在多个方面。例如,它能准确预测由吸烟、饮酒或体重指数 (BMI) 定义的不同人群亚组疾病负担的变化 (图 3d 和 扩展数据图 6a) 。当人群按既往疾病存在情况或估计疾病风险进行分层时,也观察到类似发现 (扩展数据图 6b,c) 。这些分析共同表明,Delphi-2M 的条件样本为未来健康轨迹提供了有意义的外推预测,这些预测反映了既往健康事件的影响。
The use of synthetic data has been proposed to help overcome issues with privacy in biomedical modelling if such datasets do not reveal characteristics specific to any one person. Fully synthetic data, which are sampled from birth with randomly assigned sex, reproduce the observed age and sex-specific incidence patterns throughout life (Fig. 3e). Further assessment shows that the generated trajectories do not exhibit any greater similarity to the training data than those from the validation cohort (Supplementary Fig. 6). While partially overlapping disease trajectories may be found in terms of absolute disease tokens, the extent of overlap appears as expected on the basis of the observed incidences and co-morbidity patterns.
使用合成数据已被提出,以帮助克服生物医学建模中的隐私问题,前提是这些数据集不泄露任何特定个体的特征。完全合成数据从出生时随机分配性别进行抽样,再现了整个生命周期中观察到的年龄和性别特异性发病模式 (图 3e) 。进一步评估表明,生成轨迹与训练数据的相似性并未超过验证队列中的轨迹 (补充图 6) 。虽然在绝对疾病 token 方面可能会发现部分重叠的疾病轨迹,但重叠程度与观察到的发病率和共病模式所预期的相符。
To illustrate the use of synthetic data, we trained a version of Delphi-2M exclusively on synthetic data. Notably, when evaluated on the observed validation data, the fully synthetically trained model achieves an age–sex-stratified average AUC of 0.74, which is only three percentage points lower than that of the original Delphi-2M model (Fig. 3f). This confirms that synthetic data preserve much of the information relevant to training Delphi models and may serve as a less privacy-sensitive alternative to personal data.
为了说明合成数据的用途,我们仅使用合成数据训练了一个Delphi-2M版本。值得注意的是,在观测验证数据上评估时,完全基于合成数据训练的模型实现了年龄-性别分层的平均AUC为0.74,仅比原始Delphi-2M模型低三个百分点 (图 3f) 。这证实了合成数据保留了训练Delphi模型所需的大部分相关信息,并可能作为个人数据的一种隐私敏感性较低的替代方案。
Explaining Delphi-2M predictions
Explaining Delphi-2M predictions
Insights into how Delphi-2M uses past information to predict future disease rates can be obtained by assessing the structure of the disease embeddings. GPT models linearly map inputs into a lower-dimensional embedding space, in which the temporal sequence of events is iteratively aggregated to produce a state from which predictions of each next token are derived (Fig. 1c). Delphi-2M’s specific implementation uses weight tying, which uses the same mapping to project the final embedding state to the token risks, guiding interpretation as the embedding matrix reflects the observed structure of co-morbidity risks.
深入了解Delphi-2M如何利用历史信息预测未来疾病率的关键在于评估疾病嵌入的结构。GPT模型将输入线性映射到低维嵌入空间,通过迭代聚合事件的时间序列生成状态,并基于该状态预测每个后续token(图1c)。Delphi-2M的具体实现采用权重绑定技术,使用相同映射将最终嵌入状态投射至token风险值。由于嵌入矩阵反映了观察到的共病风险结构,这一设计为模型解释提供了指导。
As shown by the uniform manifold approximation and projection (UMAP) representation of Delphi-2M’s embedding matrix in Fig. 4a, disease codes cluster closely by the underlying chapter, a property that the model has no direct knowledge of, and that purely reflects co-occurrence patterns in the data. Yet there are also noticeable exceptions, for example, cancers and precancers of the female reproductive tract. Another noteworthy cluster involves the two types of diabetes, retinal disorders and the n europ athies caused by them. Diseases with high acute mortality, such as myocardial infarction or septic a emi a, are clustering with death.
如图4a中Delphi-2M嵌入矩阵的均匀流形逼近与投影 (UMAP) 表示所示,疾病代码按底层章节紧密聚集,这一特性模型并未直接知晓,纯粹反映了数据中的共现模式。但也存在明显例外,例如女性生殖道癌症和癌前病变。另一个值得注意的簇涉及两种类型的糖尿病、视网膜病变及其引起的神经病变。急性死亡率高的疾病,如心肌梗死或败血症,与死亡聚集在一起。
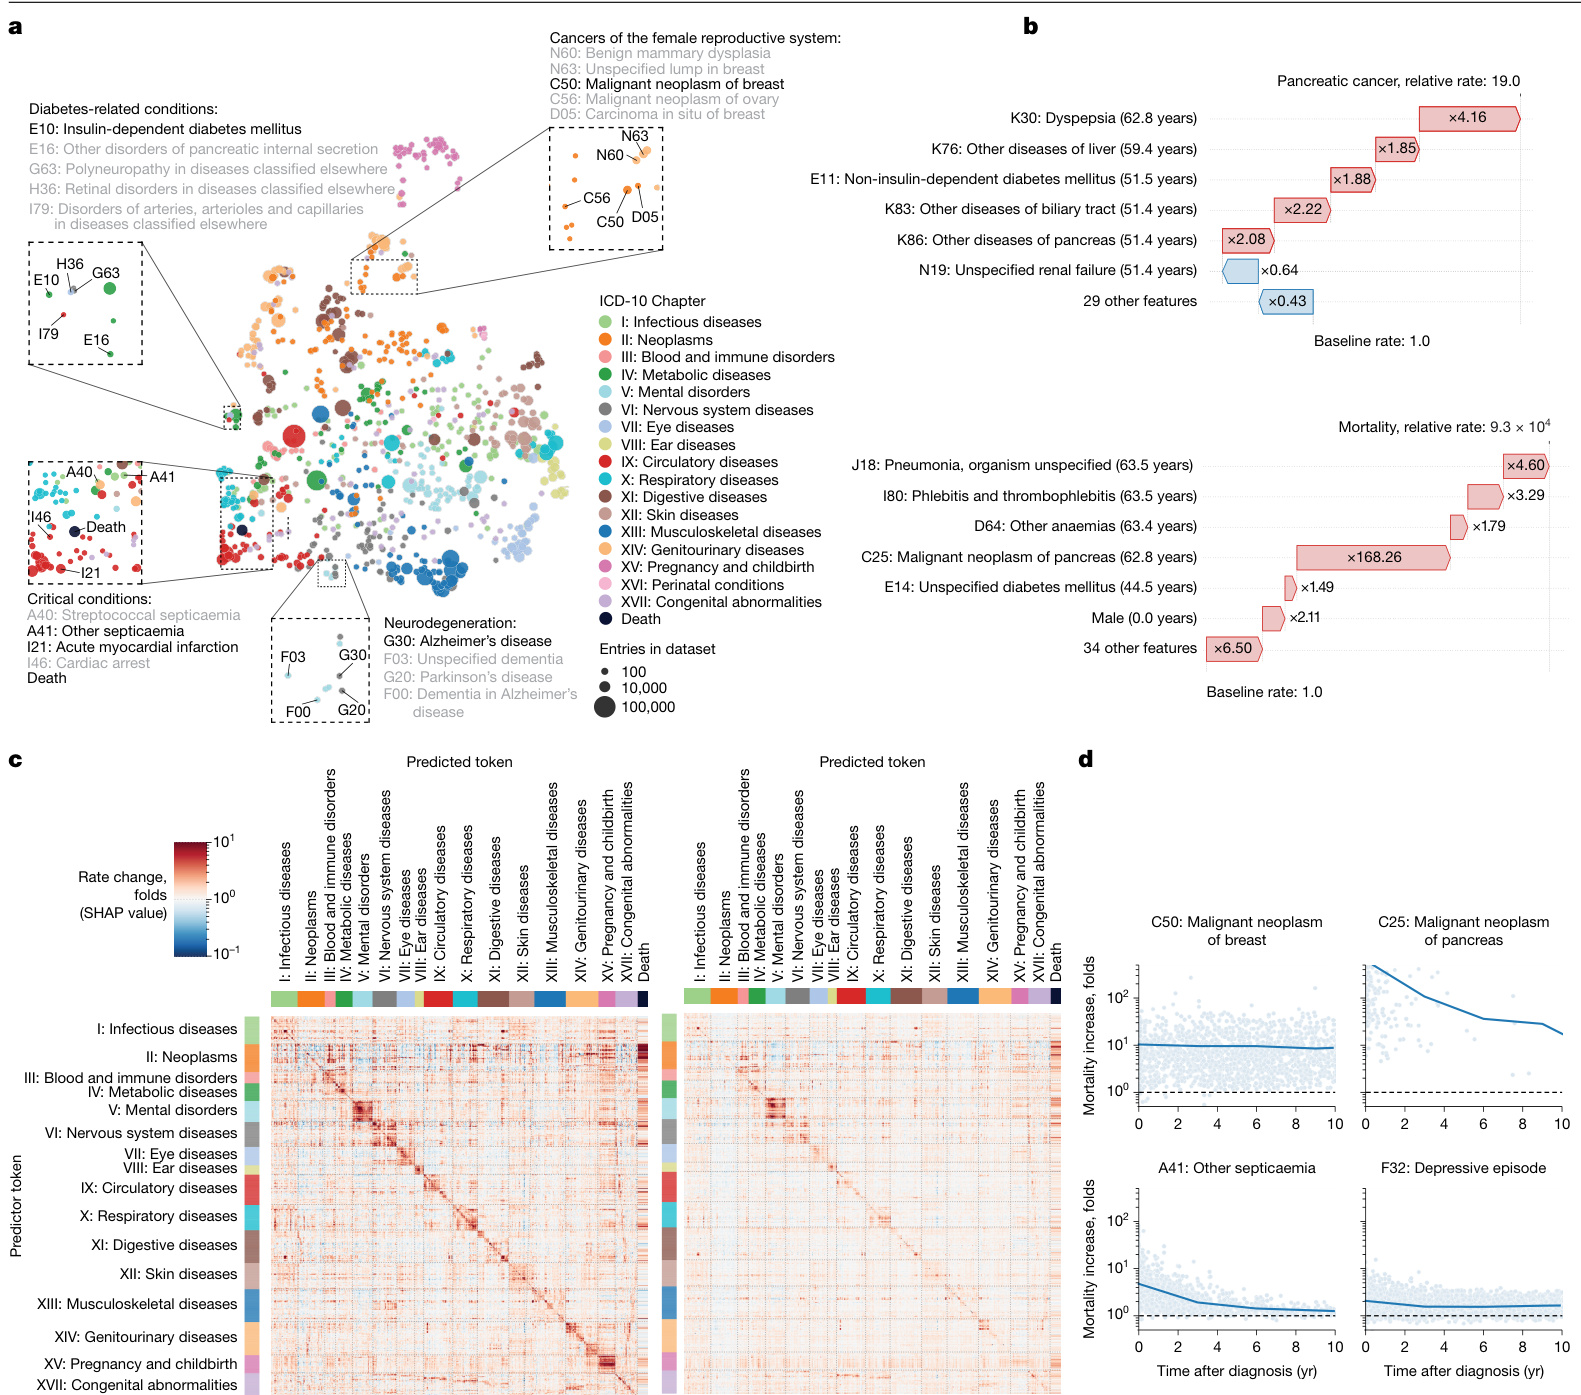
Fig. 4 | Explain able AI offers insights into disease progression. a, UMAP projection of token embeddings. Selected diseases are shown in the magnified areas. Colours define disease chapters. b, SHAP-explained token risk contributions for individual trajectories. Top, the risk of pancreatic cancer immediately before diagnosis at age 68.2 years, which was found to be $19\times$ increased. Bottom, the SHAP estimates of contributions to estimated mortality at age 63.5 years, which was greatly increased, in large part due to the preceding diagnosis of pancreatic cancer. c, The average SHAP effect of each of $n=778$ disease tokens with more than 5 occurrences and grouped by chapter (y axis) on the same set of tokens plus death (x axis). The red colours indicate a risk increase, whereas blue indicates a decrease. d, Rate change (SHAP value) of mortality (y axis) as a function of time after diagnosis (x axis) for selected diseases.
图 4 | 可解释人工智能为疾病进展提供洞察。a, Token嵌入的UMAP投影。放大区域显示了选定的疾病。颜色代表疾病章节。b, 针对个体轨迹的SHAP解释的Token风险贡献。上图显示在68.2岁诊断胰腺癌前的即时风险,发现增加了19倍。下图显示在63.5岁时对估计死亡率的SHAP贡献评估,该风险大幅增加,主要归因于先前诊断的胰腺癌。c, 按章节分组(y轴)的n=778个出现超过5次的疾病Token对同一组Token及死亡(x轴)的平均SHAP效应。红色表示风险增加,蓝色表示风险降低。d, 选定疾病的死亡率变化率(SHAP值)(y轴)随诊断后时间(x轴)的函数关系。
To gain further insights into how individual tokens influence future risks, shapley additive explanations (SHAP) values measure the influence of each token from the input trajectory on model predictions by a systematic assessment of subsampled data for individual prediction. As illustrated with the example of the proband’s partial trajectory shown in Fig. 4b, this analysis reveals that a series of disease diagnoses of the digestive tract (ICD-10 chapter XI) elevated their pancreatic cancer risk 19-fold. The subsequent pancreatic cancer diagnosis in turn increased the rate of mortality almost ten thousandfold.
为了进一步了解单个Token如何影响未来风险,沙普利加和解释 (SHAP) 值通过系统评估个体预测的子采样数据,来衡量输入轨迹中每个Token对模型预测的影响。如图 4b 所示的部分先证者轨迹示例,该分析显示一系列消化道疾病诊断 (ICD-10 第十一章) 将其胰腺癌风险提升了19倍。随后的胰腺癌诊断又将死亡率提高了近万倍。
SHAP analysis of data from 100,639 individuals of the validation cohort reveals the mutual dependencies by which each disease, sex and lifestyle token influences the rate of subsequent disease tokens, similar to hazard ratios in conventional statistical models (Fig. 4c (left)
对验证队列中 100,639 名个体数据的 SHAP 分析揭示了每种疾病、性别和生活方式标记影响后续疾病标记发生率的相互依赖关系,类似于传统统计模型中的风险比 (图 4c (左) )
and Extended Data Fig. 7). Effects mostly increase the rates of other diseases and are usually found among diseases of the same ICD-10 chapters, underscoring that the recorded patterns of co-morbid i ties often cluster within specific ICD-10 disease chapters. Particular clusters spanning entire disease chapters are visible for ICD-10 chapters V (mental disorders) and XV (pregnancy and childbirth). Notably, such patterns often appeared symmetrical, indicating similar predicted effect sizes of one disease token influencing another and vice versa (Supplementary Fig. 7). This behaviour can be attributed to the structure of the embedding space, which places temporarily co-occurring diagnoses in local proximity (Extended Data Fig. 8).
以及扩展数据图 7) 。影响主要表现为其他疾病发生率的提升,且通常集中在同一ICD-10章节的疾病范畴内,这说明记录到的共病模式往往聚集在特定的ICD-10疾病章节中。在ICD-10的第五章 V (精神障碍) 和第十五章 XV (妊娠和分娩) 中可见横跨整个疾病章节的特定聚集区。值得注意的是,这类模式常呈现对称性,表明某一疾病表征对另一疾病的影响预测规模具有双向相似性 (补充图 7) 。该现象可归因于嵌入空间的结构特性——该结构会将暂时性共现的诊断安置在相邻区域 (扩展数据图 8) 。
The patterns of modelled influences after 10 years are similar to short-term effects, even though the strength of associations is greatly a, Comparison between AUC values in the UKB longitudinal testing and the external testing using Danish data. b, Yearly mortality estimates by Delphi-2M (UK validation cohort), observed rates in the UK Biobank and Office for National Statistics national estimates across the entire British population. As only living individuals between 40 and 70 years of age (black line) were recruited to the UK Biobank, many deaths are missing compared with the Office for National Statistics population estimate (grey shaded area). c, UpSet plot of disease data availability in the UK Biobank validation cohort $(n=100,639)$ (top). Bottom, the data source distribution for records per disease token (token position sorted). d, Data source distribution for records per disease token (token position sorted). e, Hospital-record missing ness bias (relative rate after first hospital token; y axis) as a function of token exclusivity to hospital records (x axis) for each relevant diagnosis (points). Points are coloured by the ICD-10 chapter, the overall trend is shown in black using a non parametric (loess) curve with $95%$ confidence intervals shown in grey (UK validation cohort). f, Primary care missing ness bias (y axis) as a function of primary care token exclusivity, coloured by the ICD-10 chapter. The trend is shown in black using a non parametric (loess) curve with $95%$ confidence intervals shown in grey (UK validation cohort). g, SHAP value matrix, similar to Fig. 4c. The columns and rows correspond to different diseases and are sorted by the dominating source, then ICD-10 chapter. A dominating source is defined as the origin of more than $65%$ of records for a given disease; diseases without a dominating source are not shown. SHAP values indicate the greater influence of diseases on other diseases from the same group. SR, self-reported.
a, 英国生物银行纵向测试与使用丹麦数据的外部测试之间的AUC值比较。
b, Delphi-2M对英国验证队列的年度死亡率估计、英国生物银行观察到的死亡率以及英国国家统计局对全英人口的全国估计。由于英国生物银行仅招募了40至70岁的在世个体(黑线),与英国国家统计局的人口估计(灰色阴影区域)相比,许多死亡案例未被记录。
c, 英国生物银行验证队列 $(n=100,639)$ 中疾病数据可用性的UpSet图(顶部)。底部为每个疾病token(按token位置排序)的记录数据源分布。
d, 每个疾病token(按token位置排序)的记录数据源分布。
e, 医院记录缺失偏倚(首次医院token后的相对比率;y轴)与每个相关诊断(点)的医院记录token排他性(x轴)的函数关系。点按ICD-10章节着色,整体趋势通过非参数(loess)曲线以黑色显示,灰色区域表示 $95%$ 置信区间(英国验证队列)。
f, 初级护理缺失偏倚(y轴)与初级护理token排他性的函数关系,按ICD-10章节着色。趋势通过非参数(loess)曲线以黑色显示,灰色区域表示 $95%$ 置信区间(英国验证队列)。
g, 类似于图4c的SHAP值矩阵。列和行对应不同疾病,并按主导来源和ICD-10章节排序。主导来源定义为某疾病超过 $65%$ 记录的来源;未显示无主导来源的疾病。SHAP值表明同组疾病对其他疾病的影响更大。
SR表示自我报告。
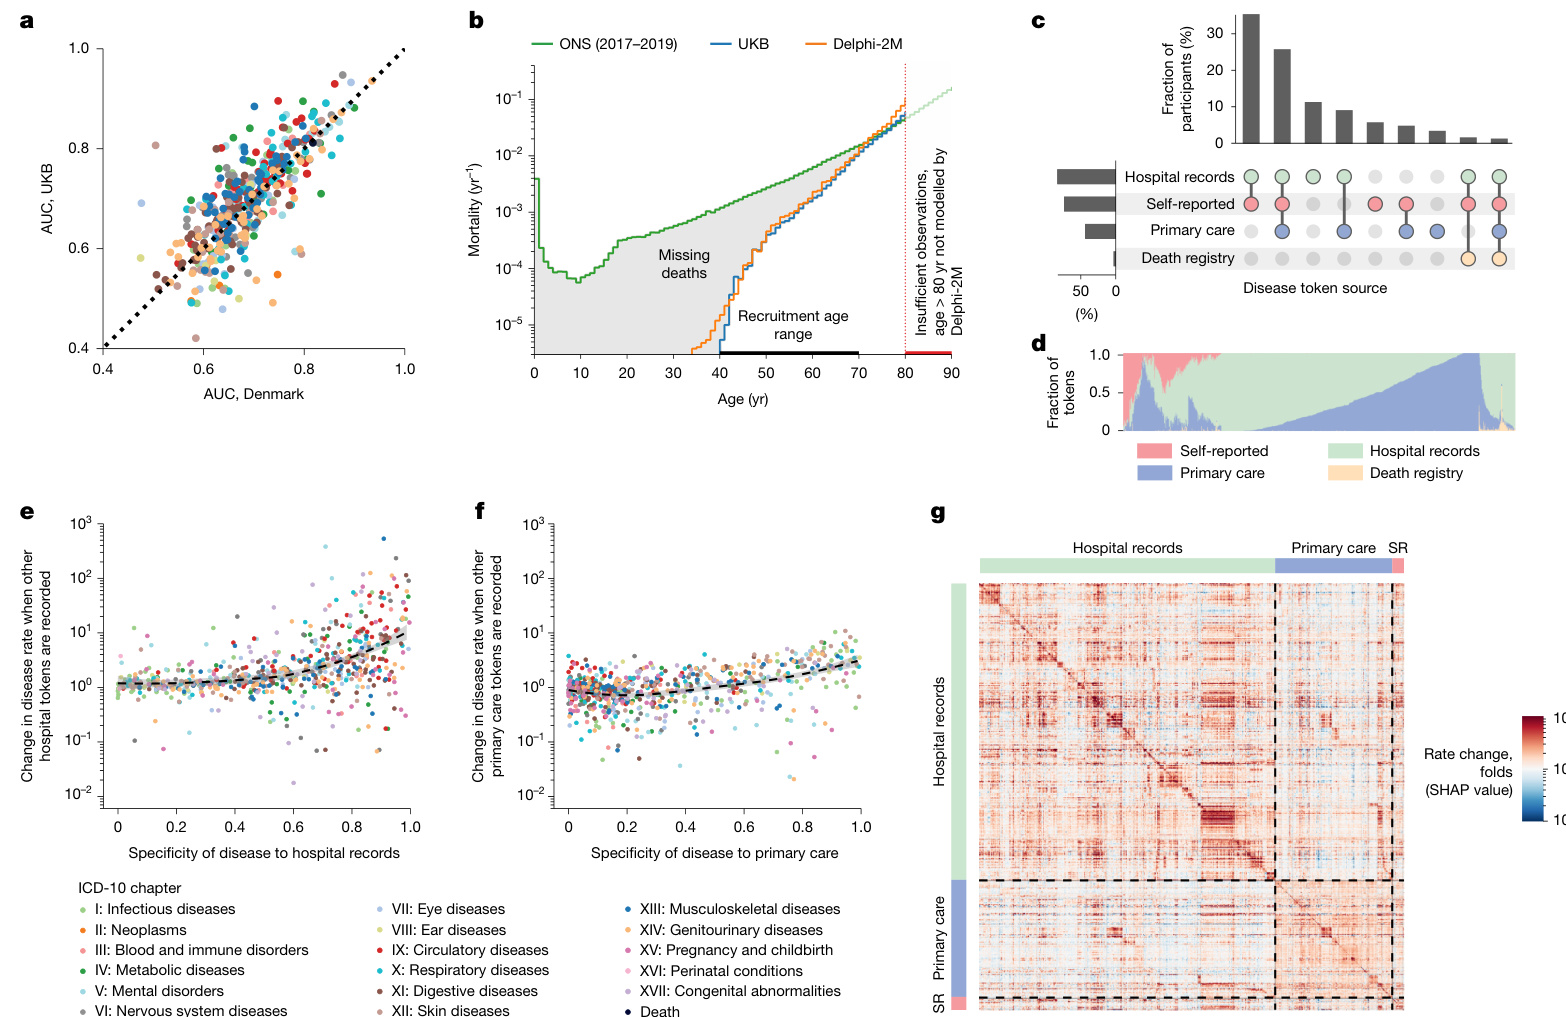
Fig. 5 | Epidemiological biases in UK Biobank data reflected by Delphi-2M.
图 5 | Delphi-2M 反映的英国生物样本库数据中的流行病学偏差。
attenuated (Fig. 4c (right)). The cluster relating to diseases of ICD-10 chapter XV (pregnancy and childbirth) within 5 years is entirely absent after 10 years, which is expected given that pregnancy-associated diseases occur within a finite period. However, dependencies among mental disorders remain apparent, similar to the effects of neoplasms on mortality. These observations are noteworthy as the quant if i cation of temporal dependencies on past events poses a particular challenge for conventional epidemiological models, whereas Delphi-2M’s GPT model uses attention-based weights, which are updated with every new input, including the ‘no event’ paddings.
在10年后完全消失(图4c(右))。与ICD-10第十五章(妊娠和分娩)相关的疾病簇在5年内出现,但在10年后完全消失,这是预期的,因为妊娠相关疾病发生在有限的时间内。然而,精神障碍之间的依赖性仍然明显,类似于肿瘤对死亡率的影响。这些观察值得注意,因为对过去事件的时间依赖性的量化对传统流行病学模型构成了特殊挑战,而Delphi-2M的GPT模型使用基于注意力机制的权重,这些权重会随着每个新输入(包括“无事件”填充)而更新。
To further illustrate Delphi-2M’s capabilities of modelling temporal dependencies, we note that, for some diseases, such as cancers, the influence on mortality decays with a half-life of several years, reflecting the sustained risks of recurrence or impacts of treatment (Fig. 4d). However, for septic a emi a, the influence on mortality is much more short-lived and drops sharply, effectively recovering to values close to the population average. This inference agrees with traditional Nelson–Aalen analyses of the hazard rates (Supplementary Fig. 8f). This behaviour is also reflected by Delphi-2M’s attention maps, which show that cancer tokens are attended to for long periods, while those of septic a emi a, myocardial infarction and many other diseases tend to be short lived (Supplementary Fig. 8).
为了进一步说明Delphi-2M建模时间依赖关系的能力,我们注意到对于某些疾病(如癌症),其对死亡率的影响会以数年半衰期逐渐衰减,这反映了疾病复发或治疗影响的持续风险(图 4d)。然而,对于败血症,其对死亡率的影响持续时间更短且急剧下降,能快速恢复至接近人群平均值的水平。这一推断与传统Nelson–Aalen风险率分析结果一致(附图 8f)。该行为也体现在Delphi-2M的注意力图谱中:癌症token会获得长期关注,而败血症、心肌梗死等疾病的注意力往往持续时间较短(附图 8)。
External validation and bias assessment
外部验证与偏差评估
To assess whether Delphi-2M’s inference generalizes to unseen cohorts, we performed external testing using Danish population registry data. For this purpose, we transferred Delphi-2M with the weights learned from the UK Biobank training and evaluated predictions on the Danish data; no retraining or adjustments have been made. The average AUC when Delphi-2M is applied to Danish data was 0.67 (s.d. 0.09), which is lower than for longitudinal testing on UKB data (0.69, s.d. 0.09). Predictions for different diseases were highly correlated across the datasets (Pearson correlation coefficient 0.76, $95%$ confidence interval (CI): 0.72–0.80) (Fig. 5a and Supplementary Fig. 9). The fact that Delphi-2M can be applied to Danish population data with slightly reduced accuracy indicates that many patterns learned by the model accurately reflect the true evolution of multi-morbidity,
为评估Delphi-2M的推理能力是否泛化至未见人群,我们使用丹麦人口登记数据进行了外部测试。为此,我们迁移了在UK Biobank训练中学习权重的Delphi-2M模型,并在丹麦数据上评估预测效果;未进行任何重新训练或调整。Delphi-2M应用于丹麦数据时的平均AUC为0.67(标准差0.09),低于UKB数据的纵向测试结果(0.69,标准差0.09)。不同疾病的预测结果在数据集间高度相关(皮尔逊相关系数0.76,95%置信区间(CI):0.72–0.80)(图5a和补充图9)。Delphi-2M能以略降低的准确率应用于丹麦人口数据的事实表明,模型学习到的许多模式准确反映了多病态演变的真实规律,
while also highlighting the existence of differences within each cohort.
同时强调每个群体内部存在差异。
A further question is to what extent a model trained on the UK Bio bank, which is an epidemiological cohort, generalizes to the general population. The UK Biobank comprises more white British citizens than the general population, and the participants tend to be on average more affluent and educated32. Lower rates of diseases are reported among participants of white ethnicity, and the rate of diagnoses increases with deprivation—trends that are reproduced by Delphi-2M (Extended Data Fig. 9). Further assessments of Delphi-2M’s performance in demographic subgroups are provided in the Supplementary Discussion, Supplementary Figs. 10 and 11 and Supplementary Table 4.
另一个问题是,基于英国生物银行 (UK Biobank) 这一流行病学队列训练的模型在多大程度上能推广到一般人群。英国生物银行中英国白人公民的比例高于普通人群,且参与者通常平均更富裕、受教育程度更高[32]。白人种族参与者的疾病报告率较低,而诊断率随贫困程度增加而上升——这些趋势均由Delphi-2M复现(扩展数据图9)。关于Delphi-2M在人口统计学亚组中表现的进一步评估见补充讨论、补充图10-11及补充表4。
In the UK Biobank, most individuals have been recruited between the ages of 40 and 70. This creates a selection bias, as no deaths are recorded before recruitment, which has direct implications for the estimated mortality (Fig. 5b). This immortality bias also indirectly affects the incidence of diseases associated with high mortality, such as cancers, as only survivors are included in the UK Biobank. For time-dependent analyses, the jump of mortality to non-zero values at recruitment can also lead to false attribution of the apparent increase to unrelated variables recorded at the time of recruitment. Furthermore, limited follow-up data are currently available for individuals 80 years of age and older. This period is therefore not reliably modelled by Delphi-2M.
在英国生物样本库中,大多数参与者的招募年龄在40至70岁之间。这造成了选择偏倚,因为在招募前没有死亡记录,这对估计死亡率有直接影响 (图 5b)。这种"永生偏倚"也间接影响高死亡率相关疾病(如癌症)的发病率,因为英国生物样本库仅包含幸存者。对于时间依赖性分析,死亡率在招募时跃升至非零值,也可能导致将明显增加错误归因于招募时记录的不相关变量。此外,目前对80岁及以上个体的随访数据有限。因此Delphi-2M无法可靠模拟这一时期。
UK Biobank’s disease data have been collated from self-reports, primary care, hospital admissions, cancer and death registries, each of which contributes characteristic disease tokens: self-reporting and GP records contain mostly common diseases, while data from hospital records include more-aggressive disease tokens, such as myocardial infarction or septic a emi a (Fig. 5d). However, the underlying sources were not always available for each participant and time period (Fig. 5c and Supplementary Fig. 12). Missing ness of a particular data source therefore causes the absence of multiple diagnoses. Such patterns, which reflect only the data-collection process, are also learned by Delphi-2M. The predicted rates of diseases exclusive to hospital records are, on average, ten times higher in individuals with a disease history that includes other hospital records (Fig. 5e,f). Septic a emi a, for example, is diagnosed in $93%$ of cases in a hospital setting and is predicted to occur at $8\times$ greater rates in individuals with any other hospital data. These source effects also explain some of the substructures visible in the UMAP representation of disease embeddings (Fig. 4a and Extended Data Fig. 10a–d) and also in the matrix of SHAP effects (Figs. 4c and 5g and Extended Data Fig. 10). While some of these associations may reflect true diagnostic pathways or disease clusters diagnosed in a distinct care setting, it nevertheless appears that some of these associations are artefacts stemming from the incomplete aggregated nature of the UK Biobank’s data.
UK Biobank的疾病数据来源于自我报告、初级保健、住院记录、癌症和死亡登记,每种数据源都贡献了特征性的疾病标记:自我报告和全科医生记录主要包含常见疾病,而住院记录数据则包含更具侵袭性的疾病标记,如心肌梗死或败血症 (图 5d)。然而,并非每位参与者和每个时间段都能获得基础数据源 (图 5c 和 补充图 12)。因此,特定数据源的缺失会导致多个诊断信息的缺失。Delphi-2M也学习了这种仅反映数据收集过程的模式。在包含其他住院记录病史的个体中,仅存在于住院记录中的疾病预测发生率平均高出十倍 (图 5e,f)。例如,败血症病例中有 $93%$ 在医院环境中诊断,并且预测在任何有其他住院数据的个体中发生率高出 $8\times$。这些数据源效应也解释了疾病嵌入的UMAP表示中可见的部分子结构 (图 4a 和 扩展数据图 10a–d) 以及SHAP效应矩阵中的部分结构 (图 4c、5g 和 扩展数据图 10)。虽然其中一些关联可能反映了真实的诊断路径或在特定护理环境中诊断的疾病集群,但似乎部分关联是由UK Biobank数据的不完整聚合性质所导致的人为现象。
Discussion
讨论
Here we present Delphi-2M—a GPT-based model of multi-disease progression. Delphi-2M extends the GPT large language model to account for the temporal nature of health trajectories. Analogous to LLMs, which learn the grammar and contextual logic of language from large bodies of text, Delphi-2M inferred the patterns of multi-disease progression when trained on data for more than 1,000 diseases and baseline health information recorded in 402,799 UK Biobank participants.
在此我们推出Delphi-2M——一个基于GPT的多疾病进展模型。Delphi-2M将GPT大语言模型 (Large Language Model) 扩展到健康轨迹的时间维度。类似于大语言模型从海量文本中学习语法和上下文逻辑,Delphi-2M在训练过程中通过402,799名英国生物银行参与者记录的1,000多种疾病及基线健康信息,推断出多疾病进展的模式。
A detailed assessment of Delphi-2M’s predictions showed that they consistently recapitulate the patterns of disease occurrence at the population scale as recorded in the UK Biobank. For the majority of diseases, Delphi-2M’s multi-disease, continuous-time model predicted future rates at comparable or better accuracy than established single-disease risk models, alternative machine learning frameworks and blood-biomarker-based models. Only a small performance drop was observed when applied to data from Danish disease registries, demonstrating that models are—even without additional finetuning— largely applicable across national healthcare systems.
对Delphi-2M预测能力的详细评估表明,其预测结果能持续复现英国生物银行(UK Biobank)记录的人群尺度疾病发生规律。对于大多数疾病,Delphi-2M的多疾病连续时间模型预测未来发病率的准确度达到或优于现有单疾病风险模型、其他机器学习框架及基于血液生物标志物的模型。在应用于丹麦疾病登记数据时仅观察到小幅性能下降,这表明该模型即使无需额外微调也基本适用于不同国家的医疗系统。
Delphi-2M is uniquely capable of sampling future disease trajectories, which enables the estimation of cumulative disease burdens over periods of up to 20 years, conditional on previous health information. Note that Delphi’s predictions are generally strongly influenced by statistical chance and compatible with a range of outcomes for a given individual. The ability to generate synthetic data may also help create datasets that preserve the statistical co-occurrence patterns without revealing any specific data, which could facilitate the development of further AI models with a decreased risk of revealing personal information.
Delphi-2M 具有独特的能力来模拟未来疾病轨迹,这使得它能够根据既往健康信息,估计最长20年内的累积疾病负担。需注意,Delphi的预测通常受统计概率的强烈影响,并且与特定个体可能出现的一系列结果相符。生成合成数据的能力还有助于创建保留统计共现模式而不泄露任何具体数据的数据集,这可以促进开发进一步的人工智能模型,同时降低泄露个人信息的风险。
Delphi-2M offers insights into the modes of disease progression. The ability to cluster disease risks may be useful for genomic association studies that focus on com or bidi ties or are stratified by the risks derived from health trajectories. Delphi-2M’s ability to quantify the temporal influence of previous health data revealed that cancers increase mortality in a sustained manner, while the effects of myocardial infarction or septic a emi a regress within 5 years. Similar analyses also revealed clusters of persisting com or bidi ties, such as mental health conditions. Although Delphi-2M appears to be capable of modelling temporally directed dependencies, we caution against interpreting these as causal relationships that could be exploited to modify future health courses.
Delphi-2M为疾病进展模式提供了新的见解。对疾病风险进行聚类的能力可能对关注共病或双向关联、或基于健康轨迹风险进行分层的基因组关联研究具有价值。Delphi-2M量化既往健康数据时间影响的能力显示,癌症会持续增加死亡率,而心肌梗死或败血症的影响在5年内消退。类似分析还揭示了持续性共病集群,例如心理健康状况。尽管Delphi-2M似乎能够建模时间导向的依赖关系,但我们提醒不要将其解释为可用来改变未来健康轨迹的因果关系。
There are also several limitations that need to be considered. A detailed analysis of UK Biobank’s first occurrence data revealed several biases, reflected by Delphi-2M. In addition to a healthy volunteer bias and participant selection bias before recruitment, the diverse nature of health data sources impacted Delphi’s prediction, as UK-Biobank-specific patterns of missing ness were exploited to infer disease rates. Furthermore, Delphi-2M predicts different disease rates in subgroups based on ancestry background and deprivation indices, but no observable trend between lifestyle measures and birth year. These findings underscore the need for caution when using AI models for inference and prediction in heterogeneous healthcare datasets, potentially marking them as useful additions to currently used diagnostic pipelines, rather than replacements.
还需考虑若干局限性。对英国生物银行首次发病数据的详细分析揭示了若干偏差,这些偏差在Delphi-2M中有所体现。除了招募前存在的健康志愿者偏差和参与者选择偏差外,健康数据来源的多样性也影响了Delphi的预测,因为模型利用了英国生物银行特有的缺失模式来推断疾病发生率。此外,Delphi-2M基于祖先背景和贫困指数预测了不同亚组的疾病发生率差异,但未发现生活方式指标与出生年份之间存在可观察的趋势。这些发现强调在异构医疗数据集中使用AI模型进行推断和预测时需要保持谨慎,或许应将其视为现有诊断流程的有益补充而非替代方案。
A promising feature of Delphi-2M’s implementation is the relative simplicity of incorporating additional data layers, rendered possible by the transformer-based architecture. Immediate refinements of Delphi-2M may incorporate additional lifestyle data, self-reported health status, prescription records and blood tests, all of which are usually available in a general healthcare setting. Further multimodal extensions could include genomic data, richer meta bol omi c information, diagnostic imaging data or data from wearables that can be added to Delphi-2M’s embedding layer, similar to how lifestyle tokens are currently incorporated (Extended Data Fig. 9). Furthermore, while ICD-10 provides a predefined token iz ation of diseases, LLMs have been shown to also conceptualize natural language, making it plausible to expect that future models may derive similar meaning directly from free text records, enabling the application of Delphi-like models to unstructured data. Lastly, Delphi-2M itself could serve as an extension to LLMs. Similarly to systems that provide LLMs with query-relevant web search results to reduce hallucinations 33, a future healthcare-oriented LLM could invoke a Delphi-based model to improve the numerical accuracy of the generated replies34.
Delphi-2M 实现的一个前景广阔的特性是,由于基于 Transformer 的架构,整合额外数据层相对简单。Delphi-2M 的即时改进可能纳入额外的生活方式数据、自我报告的健康状况、处方记录和血液检测结果,这些通常在常规医疗保健环境中可获得。进一步的多模态扩展可能包括基因组数据、更丰富的代谢组学信息、诊断影像数据或来自可穿戴设备的数据,这些都可以添加到 Delphi-2M 的嵌入层,类似于当前整合生活方式 Token 的方式(扩展数据图 9)。此外,虽然 ICD-10 提供了预定义的疾病标记化方法,但大语言模型已被证明也能概念化自然语言,因此可以合理预期未来的模型或许能直接从自由文本记录中推导出相似的含义,从而使得类似 Delphi 的模型能够应用于非结构化数据。最后,Delphi-2M 本身也可以作为大语言模型的扩展。类似于那些为大语言模型提供与查询相关的网络搜索结果以减少幻觉的系统 [33],未来面向医疗保健的大语言模型可以调用基于 Delphi 的模型,以提高生成回复的数值准确性 [34]。
An evident application of Delphi-type models is to support medical decision-making by rationally integrating information from various data modalities, which can be a challenge for healthcare professionals. Potential use cases could include identifying individuals who would benefit most from diagnostic tests or finding individuals with disease risk high enough to include them in screening programs, even if they have not yet met conventional age-based criteria. However, deploying clinical decision support systems requires a regulatory framework, which is still in its infancy for AI in healthcare.
Delphi型模型的一个明显应用是通过合理整合来自各种数据模态的信息来支持医疗决策,这对医疗专业人员来说可能是一个挑战。潜在的用例可能包括识别最能从诊断测试中受益的个体,或发现疾病风险足够高、可将其纳入筛查计划的个体,即使他们尚未达到传统的基于年龄的标准。然而,部署临床决策支持系统需要一个监管框架,而人工智能在医疗领域的监管框架仍处于起步阶段。
An alternative use of Delphi models would be to inform healthcare providers, insurers and policymakers. Such applications, which inform the provision of healthcare rather than treatment decisions, require less regulation. Delphi’s modelling has a resolution of an individual; when such predictions are aggregated, Delphi-type models may provide substantial system-wide modelling benefits, particularly in projecting the expected disease burden at local, regional and national levels, or for specific demographic groups of interest. This could reveal communities with unmet future healthcare needs over the next 1–2 decades and provide an opportunity to adjust the provision of healthcare. Such capabilities appear especially valuable in ageing populations in which healthcare needs are becoming increasingly complex and resource intensive.
Delphi模型的另一种用途是为医疗保健提供者、保险公司和决策者提供信息。这类应用于医疗保健服务而非治疗决策的场景,所需的监管较少。Delphi模型的分辨率可精确到个体;当此类预测被汇总时,Delphi类模型可带来显著的系统级建模优势,尤其在预测地方、区域和国家层面或特定关注人群的预期疾病负担方面。这能揭示未来10-20年医疗需求未得到满足的社区,并为调整医疗资源配置提供依据。这种能力在老龄化人口中显得尤为宝贵,因为其医疗需求正变得日益复杂且资源密集。
These considerations illustrate the wide range of applications of generative models for biomedical research and, ultimately, also for healthcare. With appropriate training and evaluation, future multimodal model extensions may be used for preventive medicine, clinical decision support and healthcare planning. Our model and analyses present a further step towards unlocking the considerable healthcare benefits of the era of AI.
这些考量展示了生成模型在生物医学研究乃至最终在医疗保健领域的广泛应用前景。通过适当的训练和评估,未来的多模态模型扩展可用于预防医学、临床决策支持和医疗保健规划。我们的模型和分析为推动实现人工智能时代巨大医疗效益迈出了新的一步。
Online content
在线内容
Any methods, additional references, Nature Portfolio reporting summaries, source data, extended data, supplementary information, acknowledgements, peer review information; details of author contributions and competing interests; and statements of data and code availability are available at https://doi.org/10.1038/s41586-025-09529-3.
任何方法、补充参考文献、Nature Portfolio报告摘要、源数据、扩展数据、补充信息、致谢、同行评审信息;作者贡献和竞争利益的详细信息;以及数据和代码可用性声明均可在 https://doi.org/10.1038/s41586-025-09529-3 获取。
Publisher’s note Springer Nature remains neutral with regard to jurisdictional claims in published maps and institutional affiliations.
出版方注:施普林格·自然对出版地图和机构附属关系中的管辖权主张保持中立。
Open Access This article is licensed under a Creative Commons Attribution 4.0 International License, which permits use, sharing, adaptation, distribution and reproduction in any medium or format, as long as you give appropriate credit to the original author(s) and the source, provide a link to the Creative Commons licence, and indicate if changes were made. The images or other third party material in this article are included in the article’s Creative Commons licence, unless indicated otherwise in a credit line to the material. If material is not included in the article’s Creative Commons licence and your intended use is not permitted by statutory regulation or exceeds the permitted use, you will need to obtain permission directly from the copyright holder. To view a copy of this licence, visit http://creative commons.org/licenses/by/4.0/.
开放获取 本文依据知识共享署名4.0国际许可协议授权 (http://creativecommons.org/licenses/by/4.0/) ,允许任何媒介或格式的使用、分享、改编、分发和复制,但须注明原作者及来源,提供知识共享许可协议链接并说明是否修改。文中图片或其他第三方内容均包含在知识共享许可协议中,除非素材署名中另有说明。若素材未包含在协议中且您的预期用途超出法定许可范围,请直接联系版权所有者获取授权。许可协议副本可访问 http://creativecommons.org/licenses/by/4.0/ 查看。
$\circledcirc$ The Author(s) 2025
$\circledcirc$ 作者 2025
Article Methods
文章方法
Data
数据
UK Biobank. Cohort. The UK Biobank is a cohort-based prospective study comprising approximately 500,000 individuals from various demographic backgrounds recruited across the UK between 2006 and 2010. At the time of recruitment, individuals were between 37 and 73 years of age35.
UK Biobank. 队列。UK Biobank是一项基于队列的前瞻性研究,包含2006年至2010年间在英国各地招募的约50万名来自不同人口背景的个体。在招募时,这些个体的年龄在37至73岁之间[35]。
Disease first occurrence data. The main data source for health-related outcomes is built on the first occurrence data assembled in category 1712 from the UK Biobank. These data include ICD-10 level 3 codes (for example, E11: type 2 diabetes mellitus) for diseases in chapters I–XVII, excluding chapter II (neoplasms), plus death. The data are pre-assembled by UK Biobank and include the first reported occurrence of a disease in the linked primary care data (cat. 3000), inpatient hospital admissions (cat. 2000), death registry (fields 40001 and 40002) or self-reported data through questionnaires (field 20002).
疾病首次发生数据。健康相关结局的主要数据源建立在英国生物样本库 (UK Biobank) 类别 1712 中汇总的首次发生数据基础上。这些数据包含 I–XVII 章节疾病(不包括第二章肿瘤)的 ICD-10 三级编码(例如 E11: 2型糖尿病)及死亡数据。数据由英国生物样本库预先汇总,包含关联初级诊疗数据(类别 3000)、住院数据(类别 2000)、死亡登记(字段 40001 和 40002)或通过问卷自我报告数据(字段 20002)中首次报告的疾病发生记录。
Information on neoplasms was not included in category 1712 by the UK Biobank, and we therefore included the data ourselves through the addition of the linked cancer registry data in fields 40005 and 40006 (subset to the first occurrence and mapped to ICD-10 level 3 codes), which, combined with first occurrence data, gives in total 1,256 distinct diagnoses. A list of all codes used is provided in Supplementary Table 5. Lifestyle and demographics. We extract information on the selfreported sex of participants as recorded in field 31 (indicators for female and male), a physical assessment of body mass index at recruitment from field 21001, which we split into three indicators encoding $\mathrm{BMI}<22\mathrm{kgm}^{-2}$ , $\mathrm{BMI}>28\mathrm{kgm}^{-2}$ and otherwise, as well as smoking behaviour from field 1239 with indicators for smoker (UKB coding: 1), occasionally smoking (2) and never smoker (0) and alcohol intake frequency from field 1558 with indicators for daily (1), moderately (2, 3) and limited (4, 5, 6). Furthermore, information that we extracted and used for stratification to assess model performance in subgroups but were not part of the data for model training include self-reported ethnic background (field 21000), with participants grouped into five level groups (white, mixed, Asian or Asian British, Black or Black British, and Chinese) and an index of multiple deprivation as available in field 26410. The index combines information across seven domains, including income, employment derivation, health and disability, education skills and training, barriers to housing and services, living environment and crime.
英国生物样本库的1712类别中未包含肿瘤相关信息,因此我们通过添加字段40005和40006中关联的癌症登记数据(限定为首次发生事件并映射至ICD-10三级编码)自行纳入数据,结合首次发生事件数据共获得1,256种独立诊断。所有使用编码列表见补充表5。生活方式与人口统计学特征。我们从字段31提取参与者自我报告的性别信息(女性和男性指标),从字段21001提取招募时体质指数的体格测量数据(将其划分为三个指标: $\mathrm{BMI}<22\mathrm{kgm}^{-2}$ 、 $\mathrm{BMI}>28\mathrm{kgm}^{-2}$ 及其他情况),从字段1239提取吸烟行为(吸烟者(UKB编码:1)、偶尔吸烟(2)和从不吸烟(0)的指标),从字段1558提取饮酒频率(每日饮酒(1)、适度饮酒(2、3)和有限饮酒(4、5、6)的指标)。此外,我们提取并用于分层评估模型在亚组中性能但未纳入模型训练数据的信息包括:自我报告的种族背景(字段21000,将参与者分为五类:白人、混血、亚洲或亚裔英国人、黑人或黑人英国人、华人)以及字段26410中的多重剥夺指数。该指数综合了收入、就业剥夺、健康与残疾、教育技能与培训、住房与服务障碍、居住环境与犯罪七个领域的信息。
Moreover, we extract information required for some of the algorithms we compare against. A list of the variables and their codes can be found in Supplementary Table 5.
此外,我们提取了部分对比算法所需的信息。相关变量及其代码列表可参见补充表 5。
Danish registries. Cohort. Exploring com or bidi ties and health-related factors is uniquely facilitated by Denmark’s comprehensive registries, which gather up to 40 years of interconnected data from across the entire population. All used registries are linkable through a unique personal identification number provided in the Central Person Registry along with information on sex and date of birth. Furthermore, we used the Danish National Patient Registry36 (LPR), a nationwide longitudinal register with data on hospital admissions across all of Denmark since 1977, along with the Danish Register of Causes of Death37 since 1970 to extract information on an individual’s acquired diagnoses throughout their lifetime. Our current data extract covers information up until around 2019 when reporting to the LPR was updated to LPR3. Furthermore, we restrict our cohort to individuals 50–80 years of age on 1 January 2016, to obtain a similar age range as in the UK Biobank. The 1 January 2016 was chosen as the cut-off point as it is the latest timepoint for which we can guarantee reliable coverage across the entire population over the entire prediction horizon.
丹麦登记系统。队列研究。丹麦的综合登记系统为探索合并症及健康相关因素提供了独特便利,该系统收集了全国人口长达40年的关联数据。所有使用的登记数据均可通过中央人口登记系统提供的唯一个人识别号进行关联,该识别号同时包含性别和出生日期信息。此外,我们使用了丹麦国家患者登记系统[36](LPR)——这是一个自1977年起覆盖丹麦全国医院住院数据的纵向登记系统,以及自1970年开始的丹麦死因登记系统[37],用以提取个体终生获得的诊断信息。当前数据提取涵盖至2019年左右的信息,当时LPR系统已更新至LPR3版本。我们将队列限制为2016年1月1日年龄在50-80岁之间的个体,以获得与英国生物银行相似的年龄范围。选择2016年1月1日作为截止点,是因为这是能保证在整个预测时间范围内获得全人群可靠数据的最新时间点。
Feature adjustments. To obtain a dataset that resembles the UK Biobank data, we retain only the first occurrence of an individual’s diagnosis and transform all codes to ICD-10 level 3 codes. Diagnoses before 1995 are reported in ICD-8 and have been converted to ICD-10 codes using published mappings38. Codes that may be present in the Danish register but were not in the UK Biobank are removed. Information on lifestyle is not available, and indicators for BMI, smoking and alcohol intake have therefore been treated as absent.
特征调整。为获得与英国生物银行数据相似的数据集,我们仅保留个体首次诊断记录,并将所有代码转换为ICD-10三级编码。1995年之前的诊断采用ICD-8编码,已通过公开映射表[38]转换为ICD-10代码。移除丹麦登记库中存在但英国生物银行未包含的代码。由于缺乏生活方式相关信息,BMI、吸烟和饮酒摄入指标均按缺失值处理。
Data splits. UK Biobank. The models were trained on UK Biobank data for 402,799 $(80%)$ individuals using data from birth until 30 June 2020. For validation, data contain the remaining 100,639 $(20%)$ individuals for the same period. Internal longitudinal testing was carried out using data for all individuals still alive by the cut-off date (471,057) and evaluated on incidence from 1 July 2021 to 1 July 2022, therefore enforcing a 1 year data gap between predictions and evaluation. Validation assesses how well the model generalized to different individuals from the same cohort. Longitudinal testing investigates whether the model’s performance changes over time and if it can be used for prognostic purposes. Denmark. External longitudinal testing was conducted on the Danish registries. All individuals residing in Denmark 50–80 years of age on the 1 January 2016 were included. Predictions are based on the available data up to this point and were subsequently evaluated on incidence from 1 January 2017 to 1 of January 2018, similar to the internal longitudinal testing. Data were collected for 1.93 million individuals ( $51%$ female and $49%$ male), with 11.51 million disease tokens recorded between 1978 and 2016. Predictions were evaluated on 0.96 million disease tokens across 796 ICD-10 codes (each with at least 25 cases).
数据划分。英国生物样本库。模型使用从出生至2020年6月30日的数据,对402,799名(80%)个体进行了训练。验证集包含同期剩余100,639名(20%)个体的数据。内部纵向测试采用截至截止日期仍存活的全部个体数据(471,057人),评估时段为2021年7月1日至2022年7月1日的发病率,确保预测与评估间存在1年数据间隔。验证旨在评估模型对同队列不同个体的泛化能力,纵向测试则探究模型性能随时间的变化及其预后适用性。丹麦数据集。外部纵向测试基于丹麦登记数据,纳入2016年1月1日年龄在50-80岁的全体丹麦居民。预测基于截至该时点的可用数据,评估时段为2017年1月1日至2018年1月1日的发病率,与内部纵向测试方案一致。共收集193万个体数据(女性51%,男性49),含1978至2016年间记录的1151万条疾病token。预测评估涵盖796个ICD-10编码(每个编码至少25例)下的96万条疾病token。
Model architecture
模型架构
GPT model. Delphi’s architecture is based on GPT-2 (ref. 6), as implemented in https://github.com/karpathy/nanoGPT. The basic GPT model uses standard transformer blocks with causal self-attention. A standard lookup table embedding layer with positional encoding was used to obtain the embeddings. The embedding and casual self-attention layers are followed by layer normalization and a fully connected feed forward network. Transformer layers, consisting of causal self-attention and feed forward blocks, are repeated multiple times before the final linear projection that yields the logits of the token predictions. The residual connections within a transformer layer are identical to those in the original GPT implementation. Here we also use weight tying of the token embeddings and final layer weights, which has the advantage of reducing the number of parameters and allowing input and output embeddings to be similarly interpreted.
GPT模型。Delphi的架构基于GPT-2(参考文献[6]),具体实现可参考https://github.com/karpathy/nanoGPT。基础GPT模型采用带因果自注意力机制的标准化Transformer模块。通过标准查找表嵌入层结合位置编码来获取嵌入向量。嵌入层和因果自注意力层后接层归一化及全连接前馈网络。由因果自注意力与前馈模块构成的Transformer层会重复多次,最终通过线性投影层输出Token预测的逻辑值。Transformer层内的残差连接与原始GPT实现保持一致。此处我们还采用了Token嵌入与最终层权重的绑定技术,其优势在于减少参数量,并使输入输出嵌入具有可类比性。
Data representation and padding tokens. Each datapoint consists of pairs (token, age) recording the token value and the proband’s age, measured in days from birth, at which the token was recorded. The token vocabulary consists of $n=1,257$ different ICD-10 level 3 disease tokens, plus $n=9$ tokens for alcohol, smoking and BMI, each represented by three different levels, as well as $n=2$ tokens for sex and $n=1$ no-event padding token as well as $n=1$ additional, non-informative padding token at the beginning or end of the input sequences.
数据表示与填充标记。每个数据点由 (标记, 年龄) 对组成,记录标记值以及标记被记录时参与者自出生起以天为单位的年龄。标记词汇表包含 $n=1,257$ 个不同的 ICD-10 3级疾病标记,加上 $n=9$ 个用于酒精、吸烟和 BMI 的标记(每个指标由三个不同等级表示),以及 $n=2$ 个性别标记、$n=1$ 个无事件填充标记,以及在输入序列开头或结尾添加的 $n=1$ 个无信息填充标记。
No-event padding tokens were added to the data with a constant rate of 1 per 5 years by uniformly sampling 20 tokens from the range of (0, 36525) and interleaving those with the data tokens after intersecting with the data range for each person. No-event tokens eliminate long time intervals without tokens, which are typical for younger ages, when people generally have fewer diseases and therefore less medical records. Transformers predict the text token probability distribution only at the time of currently observed tokens; thus, no-event tokens can also be inserted during inference to obtain the predicted disease risk at any given time of interest.
在数据中以每5年1个的恒定速率添加无事件填充token,具体方法是从 (0, 36525) 范围内均匀采样20个token,并与每个人的数据范围取交集后与数据token进行交错排列。无事件token消除了长时间间隔内没有token的情况(这在年轻年龄段尤为典型,因为人们通常患病较少且医疗记录较少)。Transformer 仅在当前观测到的token时间点预测文本token的概率分布;因此,在推理过程中也可插入无事件token,以获取任意指定时间点的预测疾病风险。
Sex tokens were presented at birth. Smoking, alcohol and lifestyle were recorded at the enrolment into the UK Biobank. As this specific time also coincided with the end of immortal time bias (probands had to be alive when they were recruited), smoking, alcohol and BMI tokens times were randomized by $^{-20}$ to $+40$ years from this point in time to break an otherwise confounding correlation leading to a sudden jump in mortality rates (and possibly other diseases with high mortality, such as cancers) associated with the recording of these tokens. This probably also diminishes the true effect of these tokens.
性别特征在出生时即已呈现。吸烟、饮酒及生活方式数据在参与者加入英国生物样本库时登记。由于该时间点也恰好对应永续时间偏倚的终止(研究对象入组时必须存活),我们将吸烟、饮酒和BMI特征的时间节点随机设定在此时间点的$^{-20}$年至$^{+40}$年范围内,以消除因记录这些特征导致的死亡率骤增(可能还包括癌症等高死亡率疾病)的混杂相关性。这种做法可能同时削弱了这些特征的真实效应。
Age encoding. Delphi replaces GPT’s positional encoding with an encoding based on the age values. Following the logic frequently used for positional encodings, age is represented by sine and cosine functions of different frequencies, where the lowest frequency is given by 1/365. These functions are subsequently linearly combined by a trainable linear transformation, which enables the model to share the same basis function across multiple encoding dimensions. Another advan tage of using age encoding is that Delphi can handle token inputs of arbitrary length, as no parameters are associated with token positions.
年龄编码。Delphi 将 GPT 的位置编码替换为基于年龄值的编码。遵循位置编码常用的逻辑,年龄通过不同频率的正弦和余弦函数表示,其中最低频率为 1/365。这些函数随后通过可训练的线性变换进行线性组合,使模型能够在多个编码维度共享相同的基函数。使用年龄编码的另一个优势是 Delphi 可以处理任意长度的 Token 输入,因为没有任何参数与 Token 位置相关联。
Causal self-attention. Standard causal self-attention enables the GPT model to attend to all preceding tokens. For sequential data, these are found to the left of the token sequence. Yet in the case of time-dependent data, tokens can be recorded at the same time with no specified order. Thus, attention masks were amended to mask positions that occurred at the same time as the predicted token. Non-informative padding tokens were masked for predictions of other tokens.
因果自注意力 (Causal self-attention) 。标准因果自注意力机制使 GPT 模型能够关注所有先前的 token。对于顺序数据,这些 token 位于 token 序列的左侧。然而在时间相关数据中,token 可能在同一时间被记录且没有特定顺序。因此,我们修改了注意力掩码,以屏蔽与预测 token 同时发生的位置。对于其他 token 的预测,非信息性的填充 token 会被屏蔽。
Exponential waiting time model. The input data to Delphi are bivariate pairs $(j,t)$ of the next token class and the time to the next token. Delphi is motivated by the theory of competing exponentials. Let $T_{i}$ be the waiting times from the current event to one of $i=1,$ , …, n competing events, where $n$ is the number of predictable tokens. Assuming the $T_{i}$ are each exponentially distributed waiting times with rates $\lambda_{i}=\exp(\log\mathrm{its}_{i})$ , the next event being j is equivalent to $T_{j}$ being the first of the competing waiting times, that is, $T_{j}=\operatorname*{min}T_{i},$ or equivalently j $=$ argmin $T_{i}.$ . It can be shown that the corresponding probability is $P(j=$ argmin $T_{i})=\lambda_{j}/\Sigma_{i}\lambda_{i},$ which is the softmax function over the vector of logits. Conveniently, this definition corresponds to the classical cross-entropy model for classification with $\lambda=$ exp(logits). Thus, Delphi uses a conventional loss term for token classification:
指数等待时间模型。Delphi的输入数据是下一个token类别与下一个token到达时间的二元组 $(j,t)$ 。Delphi的理论基础是竞争指数分布理论。设 $T_{i}$ 表示从当前事件到 $i=1,$ ..., $n$ 个竞争事件之一的等待时间,其中 $n$ 是可预测token的数量。假设每个 $T_{i}$ 都是指数分布的等待时间,其速率 $\lambda_{i}=\exp(\log\mathrm{its}_{i})$ ,则下一个事件为j等价于 $T_{j}$ 是竞争等待时间中的最小值,即 $T_{j}=\operatorname*{min}T_{i},$ 或等价于 j $=$ argmin $T_{i}.$ 。可以证明相应的概率为 $P(j=$ argmin $T_{i})=\lambda_{j}/\Sigma_{i}\lambda_{i},$ 这正是logits向量上的softmax函数。便利的是,该定义对应于经典的交叉熵分类模型,其中 $\lambda=$ exp(logits)。因此,Delphi采用常规的token分类损失项:
$$
\mathsf{l o s s}_{j}=-\mathsf{l o g}P(j)=-\mathsf{c r o s s_e n t r o p y}(\mathsf{l o g i t s},\mathsf{t o k e n s})
$$
$$
\mathsf{l o s s}_{j}=-\mathsf{l o g}P(j)=-\mathsf{c r o s s_e n t r o p y}(\mathsf{l o g i t s},\mathsf{t o k e n s})
$$
Furthermore, in the competing exponential model the time to the next event $T^{*}{=}\operatorname*{min}T_{j}$ is also exponentially distributed with rate $\lambda^{*}=$ $\varSigma_{i}\lambda_{i}=\varSigma_{i}\mathrm{exp}(\mathrm{logits}_{i})$ . The loss function of exponential waiting times $T$ between tokens is simply a log-likelihood of the exponential distribution for $T^{*}$ :
此外,在竞争指数模型中,下一事件的发生时间 $T^{*}{=}\operatorname*{min}T_{j}$ 也服从速率为 $\lambda^{*}=$ $\varSigma_{i}\lambda_{i}=\varSigma_{i}\mathrm{exp}(\mathrm{logits}_{i})$ 的指数分布。Token 间指数等待时间 $T$ 的损失函数即是指数分布对 $T^{*}$ 的对数似然:
$$
\mathrm{loss}_{T}=-\mathrm{log}p(T^{*})=-(\mathrm{logsumexp}(\mathrm{logits})-\mathrm{sum}(\mathrm{exp}(\mathrm{logits}))\times T^{*}).
$$
$$
\mathrm{loss}_{T}=-\mathrm{log}p(T^{*})=-(\mathrm{logsumexp}(\mathrm{logits})-\mathrm{sum}(\mathrm{exp}(\mathrm{logits}))\times T^{*}).
$$
These approximations hold as long as the rates $\lambda_{i}$ are constant in time, which is a reasonable assumption over short periods. For this reason, padding tokens were introduced to ensure that waiting times are modelled over a relatively short period, which does not exceed 5 years in expectation. In line with the tie-braking logic used for causal self-attention, co-occurring events were predicted from the last non-co-occurring token each.
只要速率 $\lambda_{i}$ 在时间上保持恒定(在短期内这是一个合理的假设),这些近似就成立。因此,引入了填充token来确保等待时间在相对较短的周期内建模,该周期预期不超过5年。与用于因果自注意力的平局决胜逻辑一致,共现事件各自从最后一个非共现token进行预测。
Loss function. The total loss of the model is then given by:
损失函数。模型的总损失由以下公式给出:
$$loss=loss_{j}+loss_{T}
$$
$$
$loss=loss_{j}+loss_{T}
$$
Non-informative padding, as well as sex, alcohol, smoking and BMI, were considered mere input tokens and therefore removed from the loss terms above. This was achieved by setting their logits to -Inf and by evaluating the loss terms only on disease and ‘no event’ padding tokens.
非信息性填充,以及性别、酒精、吸烟和BMI,仅被视为输入token,因此从上述损失项中移除。这是通过将其logits设置为-Inf,并仅对疾病和"无事件"填充token评估损失项来实现的。
Sampling procedure. The next disease event is obtained through sampling the disease token and the time until the next event. The disease token is sampled from the distribution that originates from the application of the softmax to logits. For the time, samples from all exponential distributions with rates $\lambda_{i}$ are taken, and the minimum is retained. Logits of non-disease tokens (sex, lifestyle) are discarded from the procedure to sample disease events only.
采样过程。下一个疾病事件通过采样疾病token和到下一个事件的时间来获得。疾病token来源于对logits应用softmax后得到的分布进行采样。对于时间,从所有速率为$\lambda_{i}$的指数分布中采样,并保留最小值。非疾病token(性别、生活方式)的logits在此过程中被丢弃,以便仅采样疾病事件。
Model training
模型训练
Models were trained by stochastic gradient optimization using the Adam optimizer with standard parameters for 200,000 iterations. The batch size was 128. After 1,000 iterations of warmup, the learning rate was decayed using a cosine scheduler from $6\times10^{-4}$ to $6\times10^{-5}$ . 32-bit float precision was used.
模型采用随机梯度优化方法进行训练,使用Adam优化器及其标准参数,共进行200,000次迭代。批处理大小为128。经过1,000次预热迭代后,学习率通过余弦调度器从 $6\times10^{-4}$ 衰减至 $6\times10^{-5}$ 。训练采用32位浮点精度。
Model evaluation
模型评估
Modelled incidence. In the exponential waiting time definition above, the logits of the model correspond to log-rates of the exponential distribution, $\lambda=\exp$ (logit). For example, probability of an event occurring within a year is given by $P(T<365.25)=1-\exp(-\exp(\log\mathrm{it})\times365.25)$ .
模拟发病率。在上述指数等待时间定义中,模型的 logits 对应于指数分布的对数发生率,$\lambda=\exp$ (logit)。例如,事件在一年内发生的概率由 $P(T<365.25)=1-\exp(-\exp(\log\mathrm{it})\times365.25)$ 给出。
Age- and sex-stratified incidence. For the training set, age- and sex-stratified incidences were calculated in annual age brackets. The observed counts were divided by the number of individuals at risk in each age and sex bracket, which was given by the number of probands for each sex minus the cumulative number of deaths to account for censoring.
按年龄和性别分层发病率。对于训练集,按年度年龄段计算了年龄和性别分层发病率。观测计数除以各年龄和性别层中处于风险状态的个体数(即各性别受试者总数减去累积死亡数以考虑删失)。
Model calibration. Calibration curves were calculated on the basis of predicted incidences. To this end, all cases of a given token accruing in five year age bins were identified. Subsequently, for all other probands, a control datapoint was randomly selected in the same age band. Predictions were evaluated at the preceding token given that the time difference was less than a year. The predicted incidences were then further grouped log-linearly into risk bins from $10^{-6}$ to 1, with multiplicative increments of $\log_{10}(5)$ . The observed annual incidence was then calculated as the average of cases and control in age bins, divided by 5 years. The procedure was separately executed for each sex.
模型校准。校准曲线基于预测发病率计算。为此,识别了五岁年龄组中特定标记的所有发生案例。随后,在同一年龄组中为所有其他受试者随机选择一个对照数据点。若时间差小于一年,则在前一个标记处评估预测值。预测发病率随后以对数线性方式分组为 $10^{-6}$ 至 1 的风险区间,倍增增量为 $\log_{10}(5)$。观测年发病率按年龄组中病例和对照的平均值除以 5 年计算。该过程分别针对不同性别执行。
AUC for non-longitudinal data. To account for baseline disease risk changes over time, trajectories with disease of interest were stratified into 5 year age brackets from 50 to 80 years, on the basis of the occurrence of the disease of interest. To each bracket, control trajectories of matching age were added. Predicted disease rates were used within each bracket to calculate the AUC, which was then averaged across all brackets with more than two trajectories with the disease of interest. The evaluation was performed separately for different sexes. For some of the analyses, a time gap was used, meaning that for the prediction, only the tokens that were N or more months earlier than the disease of interest were used for the prediction.
非纵向数据的AUC。为考虑基线疾病风险随时间的变化,将目标疾病轨迹按50至80岁每5岁一个年龄段进行分层,分层依据是目标疾病的发生情况。每个年龄段加入相匹配年龄的对照轨迹。使用各年龄段内的预测疾病率计算AUC,随后对所有包含两个以上目标疾病轨迹的年龄段求取平均值。评估按不同性别分别进行。部分分析采用时间间隔,即预测时仅使用早于目标疾病发生时间N个月及以上的Token进行预测。
Confidence interval estimation for ROC AUC. To estimate the CI for AUC for individual age and sex brackets, we use DeLong’s method, which provides CI mean and variance under the assumption that AUC is normally distributed. As AUC for diseases is calculated as an average of AUC for all brackets, as a linear combination of normal distributions it also is normally distributed with parameters:
ROC AUC的置信区间估计。为了估计各年龄和性别分组的AUC置信区间,我们采用DeLong方法,该方法在AUC服从正态分布的假设下提供置信区间的均值和方差。由于疾病的AUC是计算所有分组AUC的平均值,作为正态分布的线性组合,其同样服从正态分布,参数为:
$$
{\bf A U C}\sim\mathcal{N}(\mu,\sigma^{2})
$$
$$
{\bf A U C}\sim\mathcal{N}(\mu,\sigma^{2})
$$
$$
\mu=\frac{1}{n}\sum_{i=1}^{n}\mu_{i}
$$
$$
\mu=\frac{1}{n}\sum_{i=1}^{n}\mu_{i}
$$
$$
\sigma^{2}=\frac{1}{n^{2}}\sum_{i=1}^{n}{\sigma_{i}}^{2}
$$
$$
\sigma^{2}=\frac{1}{n^{2}}\sum_{i=1}^{n}{\sigma_{i}}^{2}
$$
where $\mu_{i}$ and ${\sigma_{i}}^{2}$ are the mean and variance of AUC for each age and sex bracket, calculated using DeLong’s method.
其中 $\mu_{i}$ 和 ${\sigma_{i}}^{2}$ 分别是每个年龄和性别分组的 AUC 均值和方差,通过 DeLong 方法计算得出。
Quant if i cation of variance between population subgroups. For each disease, we estimated the mean AUC $\pmb{\mu}{s}$ and variance $\sigma{s}^{2}$ for each subgroup using DeLong39 method. Under the null hypothesis that all subgroups have the same true AUC (no bias), any observed differences would be attributable to statistical variance.
不同人口亚组间差异的量化分析。针对每种疾病,我们采用DeLong方法估算各亚组的平均AUC $\mu_{s}$ 和方差 $\sigma_{s}^{2}$。若所有亚组真实AUC值相同的零假设成立(无偏差),则观测到的任何差异均可归因于统计方差。
We use a two-level testing approach: (1) individual subgroup testing: for each disease–subgroup combination, we calculate standardized residuals by subtracting the weighted mean AUC across all subgroups from the subgroup-specific AUC and dividing by the s.d.:
我们采用两级测试方法: (1) 个体亚组测试: 针对每种疾病-亚组组合, 我们通过从亚组特异性AUC中减去所有亚组的加权平均AUC, 再除以标准差来计算标准化残差:
$$
\mu=\frac{\sum_{s=1}^{n_{s}}\mu_{s}/\sigma_{s}^{2}}{\sum_{s=1}^{n_{s}}1/\sigma_{s}^{2}}
$$
$$
\mu=\frac{\sum_{s=1}^{n_{s}}\mu_{s}/\sigma_{s}^{2}}{\sum_{s=1}^{n_{s}}1/\sigma_{s}^{2}}
$$
$$
r_{s}=\frac{\mu_{s}-\mu}{\sigma_{s}}
$$
$$
r_{s}=\frac{\mu_{s}-\mu}{\sigma_{s}}
$$
Under the null hypothesis, these standardized residuals should follow a standard normal distribution. We identify outliers using a two-sided Bonferroni-corrected significance threshold.
在零假设下,这些标准化残差应服从标准正态分布。我们使用双边Bonferroni校正的显著性阈值来识别异常值。
(2) Disease-level testing: for each disease, we sum the squared standardized residuals across all subgroups:
(2) 疾病级别检验: 针对每种疾病, 我们对所有亚组的标准化残差平方和进行求和:
$$
\chi^{2}=\sum_{s=1}^{n_{s}}r_{s}^{2}
$$
$$
\chi^{2}=\sum_{s=1}^{n_{s}}r_{s}^{2}
$$
Under the null hypothesis, this sum follows $\mathbf{a}\chi^{2}$ distribution with degrees of freedom equal to $(n-1)$ , where n is the number of subgroups. We identify diseases with excessive between-subgroup variance using a one-sided Bonferroni-corrected significance threshold.
在零假设下,该总和服从自由度为 (n-1) 的 $\mathbf{a}\chi^{2}$ 分布,其中 n 为亚组数量。我们采用单侧 Bonferroni 校正显著性阈值来识别具有过量亚组间方差的疾病。
Owing to limitations of DeLong’s method with small sample sizes, in each disease–subgroup combination, we filtered age and sex brackets with fewer than six cases and diseases with less that two brackets remaining after filtering. We also excluded diseases that had fewer than two subgroups presented.
由于DeLong方法在小样本量下的局限性,我们在每种疾病-亚组组合中,过滤了病例数少于6例的年龄和性别分组,以及过滤后剩余分组少于2组的疾病。同时,我们还排除了亚组数量少于2个的疾病。
Incidence cross-entropy. To compare the distribution of annual incidences of model and observed data, a cross-entropy metric was used. Let $p_{i}$ be the annual occurrence of token i in each year. thus, the ageand sex-based entropy across tokens is given $H(p,q)=-p\times\log(q)-$ $(1-p)\times\log(1-q)$ . For low incidences $p$ and $q.$ , the latter term is usually small. The cross-entropy is evaluated across all age groups and sexes.
发生率交叉熵。为比较模型数据与观测数据年度发生率的分布情况,采用交叉熵指标。设 $p_{i}$ 为每年标记 i 的年度出现频次,则基于年龄和性别的标记交叉熵计算公式为 $H(p,q)=-p\times\log(q)-$ $(1-p)\times\log(1-q)$ 。对于低发生率 $p$ 和 $q.$ ,后一项通常数值较小。交叉熵评估涵盖所有年龄组和性别。
Generated trajectories. To evaluate the potential of generating disease trajectories, two experiments were conducted using data from the validation cohort. First, trajectories were generated from birth using only sex tokens. This was used to assess whether Delphi-2M recapitulates the overall sex-specific incidence patterns. Second, all available data until the age of 60 were used to simulate subsequent trajectories conditional on the previous health information. A single trajectory was evaluated per proband. Trajectories were truncated after the age of 80 as currently little training data were available beyond this point. Incidence patterns were evaluated as described above.
生成的疾病轨迹。为评估生成疾病轨迹的潜力,我们使用验证队列数据进行了两项实验。首先,仅使用性别标记从出生开始生成轨迹,用于评估Delphi-2M是否重现了总体性别特异性发病模式。其次,利用60岁之前的所有可用数据,基于既往健康信息模拟后续轨迹。每位先证者仅评估单条轨迹,由于目前80岁后的训练数据稀缺,轨迹在该年龄后被截断。发病模式评估方法同前。
Training of linear models with polygenic risk scores, biomarkers and overall health rating status. We trained a family of linear regression models on the task of predicting 5-year disease occurrence. All models were trained on the data available at the time of recruitment to the UK Biobank, using different subsets of the following predictors:
基于多基因风险评分、生物标志物及总体健康评级状态的线性模型训练。我们训练了一系列线性回归模型用于预测5年疾病发生率。所有模型均使用英国生物样本库招募时可用的数据,并采用以下预测因子的不同子集进行训练:
Moreover, all models had sex and age information included.
此外,所有模型都包含了性别和年龄信息。
To evaluate the performance of the models, we used the same ageand sex-stratified AUC calculation that we used for Delphi performance evaluation. For breast cancer, only female participants were included. For E10 insulin-dependent diabetes mellitus, we masked all other diabetic diseases (E11–E14) from Delphi inputs when computing logits.
为评估模型性能,我们采用了与Delphi性能评估相同的年龄和性别分层AUC计算方法。针对乳腺癌,仅纳入女性参与者。对于E10胰岛素依赖型糖尿病,在计算logits时我们从Delphi输入中屏蔽了所有其他糖尿病疾病(E11–E14)。
Model longitudinal evaluation
模型纵向评估
Study design. To validate the predictions of the model, we also perform a longitudinal test, internally for the UK Biobank data and externally on the Danish health registries. This has two advantages: (1) we can enforce an explicit cut-off and separate data to avoid any potential time-leakage; and (2) we obtain insights into Delphi-2M prognostic capabilities and generalization.
研究设计。为验证模型的预测效果,我们同时进行了纵向测试:在英国生物银行数据内部进行,并在丹麦健康登记系统进行外部验证。此举具有双重优势:(1) 能够设定明确的时间截点并分离数据,避免潜在的时间信息泄露;(2) 可深入探究Delphi-2M的预后能力与泛化性能。
However, as mentioned in the data splits, we use two different cut-off dates between the two data sources, mainly due to differential data availability, the principal setup applies to both in the exact same way.
然而,正如数据划分部分所述,由于两个数据源的可用性存在差异,我们对它们采用了不同的截止日期,但主要设置对两者的应用方式完全相同。
We collate data up to a specific cut-off date for each individual and use Delphi-2M to predict an individual’s future rate across all disease tokens. Building on the exponential waiting time representation, we obtain rates over a 1 year time frame. The preceding year after the cut-off date is discarded to introduce a data gap. Subsequently the incidence in the next year is used for evaluation. Predictions are made for individuals 50–80 years of age.
我们为每个个体收集截至特定截止日期的数据,并使用 Delphi-2M 预测个体在所有疾病 token 上的未来发生率。基于指数等待时间表示法,我们获取 1 年时间范围内的发生率。截止日期前一年的数据被舍弃以引入数据间隔,随后使用下一年的发病率进行评估。预测针对 50-80 岁的个体进行。
Algorithms for comparison. We build a standard epidemiological baseline based on the sex- and age-stratified population rates. These are based on the Nelson–Aalen estimator 40,41, a non parametric estimator of the cumulative hazard rate, across all diseases. For the UK Biobank, the estimators are based on the same training data as Delphi-2M. For the Danish registries, we use the entire Danish population in the time period from 2010 to 2016.
比较算法。我们基于按性别和年龄分层的人口率建立标准流行病学基线。这些基线基于Nelson–Aalen估计量[40,41]——一种针对所有疾病的累积风险率的非参数估计量。对于英国生物样本库,该估计量基于与Delphi-2M相同的训练数据。对于丹麦登记数据,我们使用2010年至2016年期间的全体丹麦人口数据。
As the UK Biobank contains a wide range of phenotypic measures, we also estimate clinically established models and other machine learning algorithms for comparison.
鉴于英国生物银行包含广泛的表型测量数据,我们还评估了临床验证模型及其他机器学习算法以进行对比。
We evaluate the models on cardiovascular disease (CVD) (ICD-10: I20–25 I63, I64, G45), dementia (ICD-10: F00, F01, F03, G30, G31) and death.
我们在心血管疾病 (CVD) (ICD-10: I20-25 I63, I64, G45) 、痴呆症 (ICD-10: F00, F01, F03, G30, G31) 和死亡方面评估模型。
For CVD we compare against: QRisk3 (ref. 42), Score2 (ref. 43) (R:Risk Scores cv d:SCORE2)44, Prevent45,46 (R:preventr)47, Framingham11,46,48 (R:CVrisk:10 y cv d frs)11, Transformer, Auto Prognosis v2.0 (ref. 49) and LLama3.1(8B)50 (https://ollama.com/library/llama3).
对于心血管疾病 (CVD) ,我们与以下方法进行比较:QRisk3 (参考文献 42)、Score2 (参考文献 43) (R:Risk Scores cv d:SCORE2)44、Prevent45,46 (R:preventr)47、Framingham11,46,48 (R:CVrisk:10 y cv d frs)11、Transformer、Auto Prognosis v2.0 (参考文献 49) 以及 LLama3.1(8B)50 (https://ollama.com/library/llama3)。
For dementia we compare against: UKBDRS51, Transformer and LLama3.1(8B)50.
对于痴呆症,我们与以下模型进行比较:UKBDRS51、Transformer 和 LLama3.1 (8B) 50。
For death, we compare against: Charlson (R:co morbidity)52, Elixhauser53,54 (R:co morbidity)52, Transformer and LLama3.1(8B).
对于死亡,我们与以下方法进行比较:Charlson (R: 合并症) [52]、Elixhauser [53,54] (R: 合并症) [52]、Transformer 以及 LLama3.1 (8B)。
We collect a total of 60 covariates that are used to varying degrees across the algorithms. A summary description of the covariates, as well as their corresponding UKB codes, can be found in Supplementary Table 5. For missing data, we perform multivariate imputation by chained equations 55,56 (R:mice)57. We retain five data copies, estimate all scores and, finally, aggregate them by Rubins’ rule. Results are reported based on the aggregated scores. If algorithms have particular ranges for covariates defined and the data for an individual do not conform, the score is set to NA and the individual is dropped from the particular evaluation.
我们总共收集了60个在不同算法中使用的协变量。协变量的简要说明及其相应的UKB代码可在补充表5中找到。对于缺失数据,我们采用链式方程多重插补法55,56 (R:mice)57。我们保留五份数据副本,估算所有评分,最后根据Rubin规则进行汇总。结果基于汇总评分进行报告。如果算法定义了特定的协变量范围,而个体数据不符合要求,则该评分设为NA,并从特定评估中剔除该个体。
The transformer model is an encoder model based on the standard implementation provided in Python:pytorch (Transformer Encoder, Transformer Encoder Layer) with a context length of 128 tokens, an embedding size of 128, 2 multi-head attention blocks and a total of 2 sub-encoder layers, and the otherwise default parameters were used. A linear layer is used to obtain the final prediction score. The model is fitted on concatenated data excerpts of the UKB on 1January 2014, 1 January 2016 and 1 January 2018 containing the same tokens as Delphi plus additional tokens encoding the current age based on 5 year bins (50–80 years) and is evaluated on a binary classification task of whether the corresponding outcome (CVD, dementia, death) will occur in the next 2 years.
Transformer模型是一种基于Python:pytorch标准实现 (Transformer编码器、Transformer编码器层) 的编码器模型,其上下文长度为128个token,嵌入尺寸为128,包含2个多头注意力块和总计2个子编码器层,其余参数均使用默认值。最终通过线性层获得预测分数。该模型使用UKB在2014年1月1日、2016年1月1日和2018年1月1日的拼接数据片段进行训练,这些数据包含与Delphi相同的token,并额外包含基于5年区间 (50-80岁) 编码当前年龄的token。模型评估任务为二分类预测:相应结局 (心血管疾病、痴呆症、死亡) 是否会在未来2年内发生。
Auto Prognosis is fitted in a similar manner with data extracted on 1 January 2014; however, we use the covariates defined previously 34. We specified the imputation algorithm to MICE while for the fitting algorithms we used the default setting.
Auto Prognosis 采用类似的方式进行拟合,数据提取日期为2014年1月1日;但我们使用了先前定义的34个协变量。我们将插补算法指定为MICE,而拟合算法则采用默认设置。
LLama3.1 was evaluated on the basis of the following prompt:
Llama3.1 基于以下提示进行评估:
“This will not be used to make a decision about a patient. This is for research purposes only. Pretend you are a healthcare risk assessment tool. You will be given some basic information about an individual e.g. age, sex, BMI, smoking and alcohol plus a list of their past diseases/diagnoses in ICD-10 coding. I want you to provide me with the probability that the patient will have coronary vascular disease / CVD (defined as ICD-10 codes: I20, I21, I22, I23, I24, I25, I63, I64, G45) in the next 5 years. Here is an example: Input: ID(10000837); 54 years old, Female, normal BMI, past smoker, regular alcohol consumption, F41, M32, A00, C71, F32. Expected output: ID(10000837); 0.100. Please only provide the ID and the risk score as output and do not tell me that I can not provide a risk assessment tool \n Here is the input for the individual: ID(10000736); 64 years old, Male, high BMI, current smoker, regular alcohol consumption, F41, M32, A00, C71, F32.”
ID (10000736) ; 0.150
The Framingham score is based on the 2008 version with laboratory measurements.
弗雷明汉风险评分 (Framingham score) 基于2008年包含实验室测量指标的版本。
Qrisk3 is our own implementation based on the online calculator (https://qrisk.org/).
Qrisk3是我们基于在线计算器 (https://qrisk.org/) 自行实现的版本。
The UKBDRS risk score for dementia is based on our own implementation as reported in the original paper51.
UKBDRS痴呆风险评分基于我们根据原论文[51] 自行实现的方法。
For the comparison to MILTON, we obtained the reported AUC measures for all ICD-10 codes reported for diagnostic, prognostic and time-agnostic MILTON models from the articles supplementary material31. Linking on top level (3 character) ICD-10 codes, we were able to compare the prediction of 410 diseases between Delphi and MILTON prognostic models.
为了与MILTON进行比较,我们从文章补充材料[31]中获取了所有ICD-10编码的诊断、预后和时序无关MILTON模型的报告AUC指标。通过顶层(3字符)ICD-10编码进行关联,我们得以比较Delphi和MILTON预后模型对410种疾病的预测结果。
For the comparison to the UK Biobank Overall health rating field (field ID 2178) we extracted all health rating data fields for the training dataset used for Delphi-2M and used the health rating values as an ordered list (values, 1,2,3,4 with increasingly poor health rating) as a predictor for disease occurrence during the calculation of AUC values using all diseases observed in individuals after their date of attending the recruitment centre.
在与英国生物样本库总体健康评分字段 (字段ID 2178) 进行比较时,我们提取了用于Delphi-2M训练数据集的所有健康评分数据字段,并将健康评价值作为有序列表 (数值1、2、3、4对应逐渐恶化的健康评级) ,在计算AUC值时将其作为疾病发生的预测因子。AUC计算使用了研究对象在到访招募中心日期之后观察到的所有疾病数据。
All other models are based on publicly available implementations.
所有其他模型均基于公开可用的实现。
For the evaluation against clinical markers, we used the direct measurements as available in the UKB for the AUC computation (HbA1c, diabetes (E10–14); haemoglobin/mean corpus cula r volume, anaemia (D60–D64)). Only for the evaluation on chronic liver disease (K70–77), we used the predictions from a logistic regression model with alkaline phosphatase, alanine amino transfer as e, gamma-glut amyl transfer as e, total protein, albumin, bilirubin and glucose as covariates. Evaluations are based on a 5-year time window after an individual’s recruitment data.
在与临床标志物的评估中,我们使用UKB中可直接测量的指标进行AUC计算(HbA1c、糖尿病(E10-14);血红蛋白/平均红细胞体积、贫血(D60-D64))。仅在慢性肝病(K70-77)的评估中,我们采用了逻辑回归模型的预测结果,该模型以碱性磷酸酶、丙氨酸氨基转移酶、γ-谷氨酰转移酶、总蛋白、白蛋白、胆红素和葡萄糖作为协变量。所有评估均基于个体入组数据后5年的时间窗口进行。
The Charlson and Elixhauser co morbidity index is based on the same data as Delphi; however, the Charlson co morbidity index is originally based on ICD-10 level 4 codes. We therefore estimate based on a version that maps the level 3 codes to all possible level 4 codes. We estimated a version with the level 3 codes as well and this did perform marginally worse.
Charlson和Elixhauser合并症指数与Delphi基于相同数据源,但Charlson合并症指数最初基于ICD-10四级编码构建。因此我们采用将三级编码映射至所有可能四级编码的版本进行估算。同时使用三级编码的版本进行测试时,其表现略逊一筹。
Overall, we tried to model the data as close as possible to the originally used covariates; however, in some places, small adjustments were made. Particularly, we retain only level 3 ICD-10 codes; thus, definitions based on level 4 codes are approximated by their level 3 codes.
总体而言,我们尝试尽可能贴近原始使用的协变量对数据进行建模;但在某些地方进行了小幅调整。特别是,我们仅保留ICD-10的三级编码;因此,基于四级编码的定义均以其三级编码进行近似处理。
Performance measures and calibration. To assess the discriminatory power of the predicted rates for the longitudinal test, we use the area under the receiver operating curve (ROC-AUC) and the average precision-recall curve (APS) as implemented in Python:scikit-learn. Thus, we compare the observed cases in the evaluation period against the predicted scores obtained at the respective cut-off date. All diseases with at least 25 cases were assessed.
性能指标与校准。为评估纵向测试中预测率的判别能力,我们采用受试者工作特征曲线下面积(ROC-AUC)和Python语言scikit-learn库实现的平均精确召回曲线(APS)。通过将评估期内观察到的病例与相应截止日期获得的预测评分进行比较,对所有至少包含25例病例的疾病进行评估。
Furthermore, we compare the predicted rates from Delphi-2M to the observed incidence to determine the calibration of the predicted rates using Python:scikit-learn. Delphi-2M predicted rates are split into deciles, and for each bin, we compare Delphi-2M’s average rate against the observed rate within the bin. We include all diseases with at least 25 cases.
此外,我们将Delphi-2M的预测率与观察发病率进行比较,以使用Python语言的scikit-learn库确定预测率的校准情况。将Delphi-2M预测率按十分位数分组,在每个分组内比较Delphi-2M的平均预测率与观察到的实际发病率。我们纳入了所有病例数不少于25的疾病进行分析。
Model interpretation
模型解释
Token embedding UMAP. The low-dimensional representation of token space was constructed by applying the UMAP58 dimensionality reduction algorithm to the learned token embeddings for Delphi-2M $(1,270\times120$ matrix). The cosine metric was used.
Token embedding UMAP。通过将UMAP[58]降维算法应用于Delphi-2M $(1,270\times120$ 矩阵)学习到的token嵌入,构建了token空间的低维表示。使用余弦度量标准。
SHAP. To evaluate the influence of each token in a trajectory on the next predicted token, we adopted the SHAP methodology. Each trajectory from the validation cohort was augmented by masking one or several tokens and then used for prediction. The change of logits after many such augmentations was aggregated by a Partition Explain er from the SHAP Python package.
SHAP. 为评估轨迹中每个token对下一个预测token的影响, 我们采用了SHAP方法。验证集中的每条轨迹通过掩码一个或多个token进行增强, 然后用于预测。经过多次此类增强后logits的变化由SHAP Python包中的Partition Explain er进行聚合。
Masking procedure. The number of augmentations for each trajectory was determined using the Partition Explain er masking algorithm. When masked, tokens were replaced by a ‘no event’ placeholder that was also used during training. Sex tokens, when masked, were replaced with the corresponding token of the opposite sex.
掩码处理流程。每条轨迹的增强次数由 Partition Explainer 掩码算法确定。进行掩码时,Token 会被替换为训练期间使用的"无事件"占位符。性别 Token 被掩码时,会替换为相反性别的对应 Token。
SHAP values evaluation. The described procedure was applied to each of 100,639 trajectories in the validation cohort. The predicted token was always the last available token in the trajectory.
SHAP值评估。所述程序应用于验证队列中的100,639条轨迹中的每一条。预测的Token始终是轨迹中最后可用的Token。
Cox hazard ratios. To assess the interpretation of the SHAP values, we use a penalized time-dependent Cox model, developed for use with EHR data15, and compare the corresponding hazard estimates to our averaged SHAP values.
Cox风险比。为了评估SHAP值的可解释性,我们采用适用于电子健康记录数据的惩罚性时变Cox模型[15],并将相应的风险估计值与我们的平均SHAP值进行比较。
Non parametric hazard ratios. To complement the SHAP analysis and the assessment of Delphi-2M’s modelling of time-dependent eff ects, we also performed an evaluation based on the Nelson–Aalen estimator. For a given token, we identify individuals with the token and estimate their corresponding cumulative hazard from the occurrence of the token onwards. Moreover, we randomly select five age–sex-matched individuals for each case and estimate the cumulative hazard in this comparison group. We can then obtain an estimate of the hazard rate by taking the derivative of the cumulative hazard. We apply a Gaussian kernel to acquire a smooth estimate. Subsequently, we can take the ratio of the two hazards and obtain a crude non parametric estimate for the hazard ratio of the token over time.
非参数风险比。为补充SHAP分析和Delphi-2M时变效应建模评估,我们还基于Nelson–Aalen估计量进行了评估。对于给定token,我们识别带有该token的个体,并从token出现开始估算其对应的累积风险。此外,我们为每个病例随机选择五名年龄-性别匹配的个体,并估算该对照组的累积风险。通过求取累积风险的导数即可获得风险率估计值,应用高斯核函数获得平滑估计值后,可计算两组风险比得出随时间变化的token风险比粗估计值。
Generative modelling
生成式建模 (Generative modelling)
Training on synthetic data. The model was trained on simulated trajectories sampled from Delphi-2M. The dataset size was 400,000 trajectories, the same as for the original training set. The trajectories were samples from birth; sex was assigned randomly. No training hyper parameters were changed compared to Delphi-2M.
在合成数据上训练。该模型使用从Delphi-2M采样的模拟轨迹进行训练。数据集大小为40万条轨迹,与原始训练集相同。轨迹从出生阶段开始采样;性别被随机分配。与Delphi-2M相比,训练超参数未作任何更改。
Statistics and reproducibility
统计与可重现性
Validation on external datasets. No novel data were generated for this study. Reproducibility of the method has been confirmed by retraining Delphi-2M using different train-validation splits ( $\overset{\vartriangle}{\boldsymbol{n}}=4$ independent experiments; Supplementary Fig. 1) and testing the trained model using longitudinal UK Biobank data and external data from the Danish National Patient Registry.
在外部数据集上的验证。本研究未生成新的数据。通过使用不同的训练-验证分割重新训练Delphi-2M ( $\overset{\vartriangle}{\boldsymbol{n}}=4$ 项独立实验;附图1),并使用经过训练的模型测试纵向英国生物银行数据和丹麦国家患者登记处的外部数据,证实了该方法的可重复性。
Ethics approval
伦理审批
The UK Biobank has received approval from the National Information Governance Board for Health and Social Care and the National Health Service North West Centre for Research Ethics Committee 532 (ref: 11/ NW/0382). All UK Biobank participants gave written informed consent and were free to withdraw at any time. This research was conducted using the UK Biobank Resource under project 49978. All investigations were conducted in accordance with the tenets of the Declaration of Helsinki.
英国生物样本库已获得国家健康与社会护理信息治理委员会以及国家健康服务西北研究中心研究伦理委员会532的批准 (批号: 11/NW/0382) 。所有英国生物样本库参与者均签署了书面知情同意书,并可随时自由退出。本研究使用项目49978下的英国生物样本库资源进行。所有调查均遵循《赫尔辛基宣言》的原则开展。
The use of the Danish National Patient Registry for validation of the UK Biobank results was conducted in compliance with the General Data Protection Regulation of the European Union and the Danish Data Protection Act. The analyses were conducted under the data confidentiality and information security policies of the Danish National Statistical Institute Statistics Denmark. The Danish Act on Ethics Review of Health Research Projects and Health Data Research Projects (the Committee Act) do not apply to the type of secondary analysis of administrative data reported in this paper.
使用丹麦国家患者登记库验证英国生物样本库结果的操作符合欧盟《通用数据保护条例》和丹麦《数据保护法》的规定。分析工作是在丹麦国家统计局的数据保密和信息安全政策框架下进行的。丹麦《健康研究项目和健康数据研究项目伦理审查法》(委员会法)不适用于本文所报告的这类行政数据的二次分析。
Reporting summary
报告摘要
Further information on research design is available in the Nature Portfolio Reporting Summary linked to this article.
有关研究设计的更多信息,请参阅本文链接的《Nature Portfolio报告摘要》。
Data availability
数据可用性
UK Biobank data are available under restricted access through a procedure described online (http://www.ukbiobank.ac.uk/using-theresource/). Danish registry data are available for use in secure, dedicated environments through application to the Danish Patient Safety Authority and the Danish Health Data Authority at https://sundhedsdata s tyr else n.dk/da/english/health data and registers/research services/apply. Source data are provided with this paper.
UK Biobank数据可通过在线程序 (http://www.ukbiobank.ac.uk/using-theresource/) 申请受限访问。丹麦登记数据可通过向丹麦患者安全局和丹麦卫生数据局提交申请 (https://sundhedsdatastyrelsen.dk/da/english/health_data_and_registers/research_services/apply) ,在专用安全环境中使用。源数据随本文提供。
Code availability
代码可用性
Code for Delphi and accompanying scripts and Jupyter notebooks are available at GitHub (https://github.com/gerstung-lab/delphi). The model’s checkpoint is available according to UK Biobank’s controlled access procedures with upload ID 7318.
Delphi 代码及配套脚本和 Jupyter 笔记本可在 GitHub (https://github.com/gerstung-lab/delphi) 获取。模型检查点可根据英国生物银行 (UK Biobank) 的受控访问程序获取,上传 ID 为 7318。
Acknowledgements We thank the participants of the UK Biobank for providing their medical data and enabling this research. We acknowledge the following sources of funding: Novo Nordisk Foundation grants N NF 17 OC 0027594 (K.G., A.W.J., E.B., M.G., S.B. and L.H.M.), N NF 14 CC 0001 (S.B.) and N NF 17 OC 0027812 (L.M.); the Robert Bosch Foundation (M.G.); the EMBL European Bioinformatics Institute (EMBL-EBI) (E.B., T.F. and A.W.J.); and the Villum Foundation (00034288) (L.M.). We thank C. Relton and G. D. Smith for their detailed comments on the manuscript.
致谢 我们感谢英国生物银行 (UK Biobank) 的参与者提供其医疗数据并促成此项研究。我们确认以下资金来源:诺和诺德基金会 (Novo Nordisk Foundation) 拨款 N NF 17 OC 0027594 (K.G., A.W.J., E.B., M.G., S.B. 和 L.H.M.)、N NF 14 CC 0001 (S.B.) 和 N NF 17 OC 0027812 (L.M.);罗伯特·博世基金会 (Robert Bosch Foundation) (M.G.);欧洲分子生物学实验室欧洲生物信息学研究所 (EMBL European Bioinformatics Institute, EMBL-EBI) (E.B., T.F. 和 A.W.J.);以及维鲁姆基金会 (Villum Foundation) (00034288) (L.M.)。我们感谢 C. Relton 和 G. D. Smith 对稿件提出的详细意见。
Author contributions M.G. and E.B. conceived the study and supervised the analysis. M.G. developed the model with A.S. and ${\mathsf{K}}.{\mathsf{G}}.;$ K.G. prepared datasets and assessed the model parameter iz ation. A.S. assessed the model’s predictive and generative performance, as well as explain ability. A.W.J. validated the model using longitudinal and external data and performed comparisons to other predictive models and clinical scores. T.F. and A.S. evaluated the model’s performance and biases using extended demographics data. L.H.M. and S.B. prepared testing data. A.S., A.W.J., K.G., T.F., E.B. and M.G. wrote the manuscript. A.S. prepared all of the figures with contributions by A.W.J., K.G., T.F. and M.G. All of the authors approved the manuscript.
作者贡献 M.G.和E.B.构思了研究并指导分析。M.G.与A.S.和${\mathsf{K}}.{\mathsf{G}};$共同开发了模型;K.G.准备了数据集并评估了模型参数化。A.S.评估了模型的预测和生成性能,以及可解释性。A.W.J.使用纵向和外部数据验证了模型,并与其他预测模型和临床评分进行了比较。T.F.和A.S.使用扩展的人口统计数据评估了模型的性能和偏差。L.H.M.和S.B.准备了测试数据。A.S.、A.W.J.、K.G.、T.F.、E.B.和M.G.撰写了手稿。A.S.准备了所有图表,A.W.J.、K.G.、T.F.和M.G.参与了贡献。所有作者均批准了手稿。
Funding Open access funding provided by Deutsches Krebs for s chung s zentrum (DKFZ).
开放获取资金由德国癌症研究中心 (DKFZ) 提供。
Competing interests A patent has been filed for the use of generative transformer architectures to model competing risk and timings of diseases (application number: PCT/EP2025/065771; applicants: DKFZ, EMBL), with M.G., A.S., T.F., E.B., K.G. and A.W.J. listed as inventors. S.B. has ownership interests in Hoba Therapeutics Aps, Novo Nordisk, Lundbeck and Eli Lilly. E.B. is a consultant and shareholder of Oxford Nanopore. The other authors declare no competing interests.
利益冲突 关于使用生成式Transformer架构建模疾病竞争风险和时间点的专利已提交 (申请号: PCT/EP2025/065771; 申请人: DKFZ, EMBL) , M.G., A.S., T.F., E.B., K.G.和A.W.J.被列为发明人。S.B.持有Hoba Therapeutics Aps、诺和诺德、灵北制药和礼来公司的所有权权益。E.B.是牛津纳米孔公司的顾问和股东。其他作者声明无利益冲突。
Additional information
补充信息

Extended Data Fig. 1 | Effect of the “no event” padding token. a, Boxplots $(\mathtt{n}=3$ model replicates trained with different seeds) of the average loss (y-axis; lower is better) for Delphi-2M trained with different “no event” padding rates (inverse scale, x-axis). The y-axis shows the average cross-entropy loss, calculated over disease tokens only - that is, without padding tokens, sex and lifestyle tokens. UK Biobank validation data was used to calculate the reported losses. The boxplots feature the median as the center line, the box from the first to the third quartile and the whiskers for 1.5x IQR. b, Average cross-entropy loss,
扩展数据图 1 | "无事件"填充标记的效果。a, 使用不同"无事件"填充率 (反比例, x轴) 训练的 Delphi-2M 的平均损失 (y轴; 越低越好) 的箱线图 $(\mathtt{n}=3$ 个使用不同种子训练的模型复本)。y轴显示了仅针对疾病标记计算的平均交叉熵损失 - 即不包括填充标记、性别和生活方式标记。使用 UK Biobank 验证数据计算报告的损失。箱线图以中位数为中心线,箱体表示第一到第三四分位数,须线表示 1.5 倍四分位距。b, 平均交叉熵损失,
aggregated over 5-year age bins. A higher rate of “no event” tokens lowers the loss, especially for younger ages, during which generally few disease tokens are recorded, prohibiting the model from adjusting predictions for advancing age. c, “No event” token rate estimated by Delphi (y-axis) vs the true rate at which tokens were added to the training data. The boxplots feature the median as the center line, the box from the first to the third quartile and the whiskers for 1.5x IQR. $\mathtt{n}{=}4000$ random timepoints from the validation dataset trajectories, selected for “no event” token rate evaluation.
按5岁年龄组进行汇总。较高的"无事件"token出现率会降低损失,尤其是在年龄较小的阶段,这一时期通常记录的疾病token较少,导致模型无法根据年龄增长调整预测。c,Delphi估计的"无事件"token出现率(y轴)与训练数据中实际添加token的比率对比。箱线图以中位数为中心线,箱体表示第一至第三四分位数,须线表示1.5倍四分位距。验证数据集轨迹中随机选取的4000个时间点($\mathtt{n}{=}4000$),用于评估"无事件"token出现率。


Extended Data Fig. 2 | Parameter screen. a, Validation cross-entropy (rightmost axis) for models trained with different architectural hyper parameter values (other axes). b, Same data as a, showing validation loss (y-axis) against each model parameter (x-axis). The boxplots $(\mathtt{n}{}=486\$ independently trained models within
扩展数据图 2 | 参数筛选。a, 采用不同架构超参数值 (其他坐标轴) 训练的模型的验证交叉熵 (最右侧坐标轴) 。b, 与a相同的数据,显示每个模型参数 (x轴) 对应的验证损失 (y轴) 。箱线图 ( $\mathtt{n}{}=486$ 个独立训练模型)
each panel in total) feature the median as the center line, the box from the first to the third quartile and the whiskers for 1.5x IQR, clipped at min/max data points. c, Random-forest-based importance of different hyper parameters and their correlation with validation loss.
每个面板整体上以中位数作为中心线,箱体表示第一至第三四分位数,须线代表1.5倍四分位距,并截断于最小/最大数据点。c、基于随机森林的不同超参数重要性及其与验证损失的相关性。

age groups of 5 years and both sexes. Predictions in each age-sex stratum are grouped into bins of powers of 10 (x-axis, average within each bin, and observed represents an ICD-10 disease evaluated for each decile of the Delphi rate and compared against the observed rate in the population.
按5岁年龄组和男女两性划分。各年龄-性别层的预测值按10的幂次分组 (x轴,各分箱内的平均值,观测值代表对Delphi率每个十分位数进行评估的ICD-10疾病,并与人群中的观测率进行比较。

a
a

Extended Data Fig. 4 | Assessment of Delphi-2M in relation to other baseline models and stratification s. a, Comparison of Delphi-2M against clinical biomarkers for selected diseases performed using the UKB validation dataset. Predictions are based on the information available at recruitment and evaluated over the subsequent 5 years. CLD: Chronic liver disease. Mod: Logistic regression model of several clinical markers. MCV: Mean corpus cula r volume. b, AUC results comparing Delphi-2M to a simple disease predictor of Overall health rating UKB data field 2178. AUC values for field 2178 as a predictor for future health events (after the date of recruitment) (x-axis) against the AUC values from Delphi using the UKB validation data. c. Boxplot, showing the prediction AUCs for Delphi, split over sex, disease chapter and lifestyle factors, such as alcohol consumption, smoking and BMI. The boxplots feature the median as the center line, the box from the first to the third quartile and the whiskers for 1.5x IQR, clipped at min/max data points. Shown are data for $\scriptstyle{\mathfrak{n}}=906$ diagnoses for males and $\mathbf{n}=957$ diagnoses for females for which sufficiently many events were recorded in the validation data to evaluate AUCs.
扩展数据图 4 | Delphi-2M模型与其他基线模型及分层评估的关系。a、使用UKB验证数据集对Delphi-2M与选定疾病的临床生物标志物进行比较。预测基于招募时可用信息,并在随后5年内进行评估。CLD:慢性肝病。Mod:多个临床标志物的逻辑回归模型。MCV:平均红细胞体积。b、将Delphi-2M与简单疾病预测因子"总体健康评分"(UKB数据字段2178)的AUC结果比较。x轴显示字段2178作为未来健康事件(招募日期后)预测因子的AUC值,y轴显示Delphi使用UKB验证数据的AUC值。c、箱线图显示Delphi的预测AUC值,按性别、疾病章节和生活方式因素(如饮酒、吸烟和BMI)分层。箱线图以中位数为中心线,箱体表示第一至第三四分位数,须线表示1.5倍IQR,并裁剪至最小/最大数据点。数据显示男性$\scriptstyle{\mathfrak{n}}=906$项诊断和女性$\mathbf{n}=957$项诊断的评估结果,这些诊断在验证数据中记录足够多事件以计算AUC值。

Extended Data Fig. 5 | Integrating Delphi-2M predictions with other data types. Results of a linear regression model that uses Delphi logits and additional features to predict 5-year disease occurrence for selected diseases. Shown is the average validation AUC across 5-year age groups ranging from 40

扩展数据图 5 | 将Delphi-2M预测与其他数据类型整合。使用Delphi logits和附加特征预测选定疾病5年发病率的线性回归模型结果。显示的是40岁起各5年年龄段的平均验证AUC。
to 80 years of age, additionally stratified by sex. All models use sex and age as additional covariates. For prediction, only data before recruitment was used. As additional features, models use polygenic risk scores (PRS, a), 57 biomarkers used in the MILTON study (b) and UKB field 2178 Overall health rating status (c).
研究对象年龄从40岁至80岁,并按性别进一步分层。所有模型均将性别和年龄作为额外协变量。预测时仅使用招募前的数据。模型额外采用的特征包括:多基因风险评分 (PRS, a) 、MILTON研究中使用的57种生物标志物 (b) 以及UKB字段2178整体健康评级状态 (c) 。

Extended Data Fig. 6 | See next page for caption.
扩展数据图 6 | 图注见下页。
Extended Data Fig. 6 | Assessment of simulated health trajectories.
扩展数据图 6 | 模拟健康轨迹评估
All simulations are from the age of 60 onwards and use validation data. a, Simulated (x-axis) and observed (y-axis) annual disease rates during ages 70–75 for high and low smoking, alcohol consumption and BMI groups. b, Simulated and observed incidences for selected prior diseases. Same data as in a, but grouped for different prior diseases. c, Fold changes for the groups with and without prior diseases shown in b. d, Delphi accurately stratifies
所有模拟均从60岁起采用验证数据。 (a) 高/低吸烟量、饮酒量和BMI人群在70-75岁期间的模拟值 (x轴) 与观测年发病率 (y轴) 。 (b) 特定既往疾病的模拟发病率与观测发病率。数据同a,但按不同既往疾病分组。 (c) b图中展示的患有与未患既往疾病人群的倍数变化。 (d) Delphi精准分层
trajectories into low-, mid- and high-risk groups for selected diagnoses and death. Cumulative incidence (y-axis) as a function of age (x-axis). Risk groups are based on the top $1%$ and bottom $5%$ risk at the age of 60 years when simulations started. The low-risk group percentile was chosen to be larger to include sufficient cases for evaluation. Orange curves denote Delphi-2M simulations, blue observed data.
将轨迹分为低、中、高风险组,针对选定的诊断和死亡情况。累积发病率(y轴)随年龄(x轴)的变化函数。风险分组基于模拟开始时60岁年龄段最高1%和最低5%的风险分位数。选择较大的低风险组百分位以确保包含足够评估样本。橙色曲线表示Delphi-2M模拟数据,蓝色曲线为观测数据。

Extended Data Fig. 7 | Comparison of SHAP values and Cox proportional hazards coefficients. Shown are analyses for 10 selected diseases, as stated in the titles. SHAP values (x-axis) are estimated by averaging individual values from different trajectories. Cox proportional hazard coefficients (y-axis) are estimated using a proportional hazards model with parameter regular iz ation, resulting in a high number of zero coefficients. The non-zero Cox coefficients and SHAP show a high correlation.
扩展数据图 7 | SHAP值与Cox比例风险系数的比较。图中显示了标题所述的10种选定疾病的分析结果。SHAP值(x轴)通过计算不同轨迹的个体值平均值获得。Cox比例风险系数(y轴)采用带参数正则化的比例风险模型估算,导致大量零系数出现。非零Cox系数与SHAP值呈现高度相关性。

Extended Data Fig. 8 | Relation of token embedding space and SHAP effects. a. Disease embedding UMAP, coloured by the disease ICD-10 chapter. b. UMAP scatter plot, coloured by the SHAP disease rate change for the disease of interest, denoted by a cross marker. According to the SHAP analysis, disease
扩展数据图 8 | Token嵌入空间与SHAP效应的关系。 a. 按疾病ICD-10章节着色的疾病嵌入UMAP图。 b. 按目标疾病(以十字标记表示)的SHAP疾病率变化着色的UMAP散点图。根据SHAP分析,疾病
with similar embeddings tend to have a greater effect on the predicted rate of each other. Top row, the effect of the selected disease on the rate of other subsequent diseases. Bottom row, the effect of other diseases on the selected disease. c. Same as b, more diseases.
具有相似嵌入的疾病往往对彼此的预测发生率产生更大影响。顶行显示所选疾病对其他后续疾病发生率的影响。底行显示其他疾病对所选疾病的影响。c. 与b相同,包含更多疾病。

Extended Data Fig. 9 | Token source-related biases. Non-random missing ness may cause biases in predictions even when sources are not explicitly provided to the model. a. Disease embedding UMAP for a Delphi model with explicit token sources (e.g. “Common cold (self-reported)” and “Common cold (hospital records)” are separate tokens), tokens coloured by ICD-10 chapters. b. Same as a, coloured by token source. c. Same as a, but for the standard Delphi-2M model. Only tokens with more than $75%$ of all entries from one source are shown. d. Same as c, coloured by primary token source. e. SHAP value matrix (similar to Fig. 4c), with tokens grouped by chapter and primary source.
扩展数据图 9 | Token 来源相关偏差。即使未向模型显式提供来源信息,非随机缺失也可能导致预测偏差。(a) 带有显式 Token 来源的 Delphi 模型疾病嵌入 UMAP 图 (例如 "普通感冒 (自我报告)" 和 "普通感冒 (医院记录)" 作为独立 Token),按 ICD-10 章节着色的 Token。(b) 同图 a,按 Token 来源着色。(c) 同图 a,但对应标准 Delphi-2M 模型。仅显示单来源占比超过 75% 的 Token。(d) 同图 c,按主要 Token 来源着色。(e) 按章节和主要来源分组的 Token 对应的 SHAP 值矩阵 (类似图 4c)。

Extended Data Fig. 10 | Effects of ethnicity and deprivation. a, Modelled rate per year separated by sex and ethnic background. b, Modelled rate per year separated by sex and Townsend deprivation index bins (increasing for greater deprivation index values). The boxplots in a and b use the entire validation cohort n=100639 individual trajectories) and feature median as the center line, the box from the first to the third quartile, the whiskers for 1.5x IQR and the outliers. c-d, Average number of disease tokens per year, shown for different ethnicities (c) and deprivation indices (d). e-f, Age and sex stratified AUCs for 10 selected diseases. AUCs are averaged across 5-year age groups ranging from 40 to 80 years of age. The same average is used as the center for error bars. AUCs for individual age and sex brackets are shown as grey dots. $95%$ confidence intervals are calculated using DeLong’s method. g-h, Width of DeLong’s $95%$
扩展数据图 10 | 种族与贫困程度的影响。a, 按性别和种族背景划分的建模年发病率。b, 按性别和汤森贫困指数分组划分的建模年发病率 (指数值越大表示贫困程度越高)。a和b中的箱线图使用完整验证队列 n=100639条个体轨迹) ,以中位数作为中心线,箱体表示第一至第三四分位数,须线表示1.5倍四分位距及异常值。c-d, 不同种族 (c) 和贫困指数 (d) 对应的年均疾病标记数量。e-f, 10种选定疾病的年龄和性别分层AUC值。AUC值跨40至80岁年龄段以5岁为组距取平均值。该平均值同时作为误差线的中心。各年龄和性别分组的AUC值以灰点显示。采用DeLong法计算 $95%$ 置信区间。g-h, DeLong法 $95%$ 置信区间宽度。
confidence intervals for AUC vs number of cases, shown for different ethnicities and deprivation strata. For rare diseases, AUC estimates have high variance. i, Standard deviation between AUC estimates for different strata vs number of cases of this disease for the training dataset. Each dot represents a disease. j, Average validation AUC across 5-year age groups ranging from 40 to 80 years of age, aggregated by the corresponding ICD chapters. Difference between average AUCs calculated for participants with birth years before 1944 and after 1960. The boxplots feature the median as the center line, the box from the first to the third quartile and the whiskers for 1.5x IQR, clipped at min/max data points. Shown are data for $\scriptstyle{\mathfrak{n}}=906$ diagnoses for males and $\mathrm{n}=957$ diagnoses for females for which sufficiently many events were recorded in the validation data to evaluate AUCs.
AUC置信区间随病例数变化图,按不同种族和贫困阶层分组展示。对于罕见病,AUC估计值具有高方差。i、训练数据集中不同阶层AUC估计值的标准差随该疾病病例数的变化。每个点代表一种疾病。j、按ICD章节汇总的40至80岁5岁年龄组平均验证AUC。1944年前与1960年后出生参与者平均AUC差异。箱线图以中位数为中线,箱体表示四分位距,须线为1.5倍四分位距并截断于极值点。数据涵盖男性$\scriptstyle{\mathfrak{n}}=906$项和女性$\mathrm{n}=957$项诊断,这些诊断在验证数据中具有足够多事件用于评估AUC。