Integrating single-cell RNA and T cell/B cell receptor sequencing with mass cytometry reveals dynamic trajectories of human peripheral immune cells from birthtoold ag
整合单细胞RNA与T细胞/B细胞受体测序及质谱流式技术揭示人类外周免疫细胞从出生到老年的动态轨迹
Check for updates
检查更新
A comprehensive understanding of the evolution of the immune landscape in humans across the entire lifespan at single-cell transcriptional and protein levels, during development, maturation and senescence is currently lacking. We recruited atotal of 220 healthy volunteers from the Shanghai Pudong Cohort (NC T 05206643), spanning 13 age groups from 0 to over 90 years, and profiled their peripheral immune cells through single-cell RNA-sequencing coupled with single T cell and B cell receptor sequencing, high-throughput mass cytometry, bulk RNA-sequencing and flow cytometry validation experiments. We revealed that T cells were the most strongly affected by age and experienced the most intensive rewiring in cell-cell interactions during specific age. Different T cell subsets displayed different aging patterns in both transcript ome s and immune repertoires; examples included GNLY+CD8+ effector memory T cells, which exhibited the highest clonal expansion among all T cell subsets and displayed distinct functional signatures in children and theelderly; and $\mathbf{CD8}^{+}$ MAIT cells,which reached their peaks of relative abundance, clonal diversity and antibacterial capability in adolescents and then gradually tapered off. Interestingly, we identified and experimentally verified a previously unrecognized'cytotoxic' B cell subset that was enriched in children. Finally, an immune age prediction model was developed based on lifecycle-wide single-cell data that can evaluate the immune status of healthy individuals and identify those with disturbed immune functions. Our work provides both valuable insights and resources for further understanding the aging of the immune system across the whole human lifespan.
目前尚缺乏对人类整个生命周期(从发育、成熟到衰老)中免疫景观在单细胞转录和蛋白质水平上演变的全面理解。我们从上海浦东队列(NCT05206643)招募了220名健康志愿者,覆盖0岁至90岁以上共13个年龄组,通过单细胞RNA测序结合单T细胞和B细胞受体测序、高通量质谱流式、批量RNA测序及流式细胞术验证实验,对其外周免疫细胞进行了系统分析。研究发现T细胞受年龄影响最为显著,并在特定年龄段经历最剧烈的细胞间互作重构。不同T细胞亚群在转录组和免疫受体库中呈现差异化衰老模式:例如GNLY+CD8+效应记忆T细胞在所有T细胞亚群中克隆扩增程度最高,且在儿童与老年群体中表现出截然不同的功能特征;而$\mathbf{CD8}^{+}$MAIT细胞在青少年时期达到相对丰度、克隆多样性和抗菌能力的峰值后逐渐衰减。值得注意的是,我们鉴定并通过实验验证了一个在儿童群体中富集的、此前未被认识的"细胞毒性"B细胞亚群。最后,基于全生命周期单细胞数据开发的免疫年龄预测模型,可评估健康个体的免疫状态并识别免疫功能紊乱者。该研究为深入理解人类全生命周期免疫系统衰老提供了重要见解和资源。
Development and aging run throughout human life, accompanied by gradual maturation and inevitable degeneration of the immune system12. After birth, the immune system gradually matures and provides better protection against foreign pathogens'. Conversely, immune aging leads to higher incidences of infection,cardiovascular diseases+ and cancers'. Moreover, it was recently reported that aged immune cells drive the aging of solid organs, such as the heart and liver, which is a probable cause of systemic senescence°. However, it remains unclear when and how the immune system changes during human aging, which typically spans nearly 90 years and encompasses development, maturation and senescence across the entire lifespan.
发育与衰老贯穿人类生命始终,伴随免疫系统的逐步成熟与不可避免的退化[12]。出生后,免疫系统逐渐成熟,能更有效抵御外来病原体侵袭;反之,免疫衰老会导致感染、心血管疾病和癌症发病率升高。最新研究发现,衰老的免疫细胞会驱动心脏、肝脏等实体器官衰老,这可能是全身性衰老的原因之一。然而,人类免疫系统在长达近90年的生命周期中,究竟何时以及如何经历发育、成熟到衰老的转变,目前仍未阐明。
Human peripheral blood mono nuclear cells(PBMCs)area diverse mixture of highly specialized immune cells that are critical components of the immune system. Previous omics studies of human PBMCs have demonstrated their involvement in immune path o logie s (for example, immuno sen esc en ce',autoimmune disorders*and infectious diseases°)
人外周血单个核细胞 (PBMCs) 是高度特化的免疫细胞组成的多样化混合物,是免疫系统的关键组成部分。先前对人类 PBMCs 的组学研究已证明其参与免疫病理过程 (例如免疫衰老、自身免疫性疾病和感染性疾病)。
and in diseases of solid organs1o.1. Significant age-related changes in P BMC composition and function in healthy individuals have been demonstrated by flow cytometry and bulk sequencing analyses12,13. Recently, single-cell RNA sequencing (scRNA-seq) and single-cell T cell receptor (TCR) and B cell receptor (BCR) sequencing (scTCR/BCR-seq),as well as single-cell mass cyto me try (cyto me try by time-of-flight, CyTOF) protein profiling have provided opportunities to comprehensively identify previously undefined celltypes at single-cell resolution 14-16 Several scRNA-seq studies on peripheral immune cells at specific ages have yielded valuable findings17-21. Although they provide valuable insights into age-related changes in immune cells at a single-cell resolution, these scRNA-seq studies involved limited age groups and did not cover the full temporal span of human aging.Moreover,none ofthescRNA-seq studies provided single-cell protein validation, and human immune-aging datasets across the entire lifespan at single-cell protein levels are currently lacking.
在健康个体中,流式细胞术和批量测序分析已证实P BMC(外周血单个核细胞)组成和功能存在显著的年龄相关变化[12,13]。近年来,单细胞RNA测序(scRNA-seq)、单细胞T细胞受体(TCR)和B细胞受体(BCR)测序(scTCR/BCR-seq),以及单细胞质谱流式(飞行时间质谱流式,CyTOF)蛋白质分析技术,为全面鉴定单细胞分辨率下未定义的细胞类型提供了新机遇[14-16]。针对特定年龄段外周免疫细胞的若干scRNA-seq研究已取得重要发现[17-21]。尽管这些研究以单细胞分辨率提供了免疫细胞年龄相关变化的宝贵见解,但涉及的年龄组别有限,未能覆盖人类衰老的完整时间跨度。此外,现有scRNA-seq研究均未提供单细胞蛋白质验证数据,目前尚缺乏涵盖全生命周期的单细胞蛋白质水平人类免疫衰老数据集。
Here, through combined scRNA-seq, scTCR/BCR-seq and CyTOF analyses, we investigated the temporal dynamics ofthe cell type compositions, transcriptional and protein profiles, cell-cell interactions (CCls) and immune repertoires of peripheral immune cells during development, maturation and senescence in humans throughout the entire lifespan, using PBMCs from healthy participants aged O to ${\ge}90$ years, spanning 13 age groups. Using this unique lifecycle-wide dataset, we developed asingle-cell immune age (siAge) prediction modelto assess an individual's immune age and describe the immune status in health anddisease.Our work provides a rich resource for understanding the evolution of peripheral immune cells during human development, maturation and aging across the whole lifespan. The data are publicly available in a web portal for easy exploration (https://pu-lab.sjtu.edu. cn/shiny/lifespan) and through the preprint version ofour data ( www.biorxiv.0rg/content/10.1101/2022.07.11.498621v2).
通过整合单细胞RNA测序(scRNA-seq)、单细胞TCR/BCR测序(scTCR/BCR-seq)和飞行时间质谱流式(CyTOF)分析技术,我们利用从0岁到${\ge}90$岁健康参与者(涵盖13个年龄组)的外周血单个核细胞(PBMCs),研究了人类整个生命周期中发育、成熟和衰老阶段外周免疫细胞的细胞类型组成、转录与蛋白质谱、细胞间相互作用(CCls)以及免疫组库的时序动态变化。基于这一独特的全生命周期数据集,我们开发了单细胞免疫年龄(siAge)预测模型,用于评估个体免疫年龄并描述健康与疾病状态下的免疫特征。本研究为理解人类全生命周期中外周免疫细胞的演变提供了丰富资源,数据已通过网页门户(https://pu-lab.sjtu.edu.cn/shiny/lifespan)和预印本平台(https://www.biorxiv.org/content/10.1101/2022.07.11.498621v2)公开。
Results
结果
A single-cell atlas of peripheral immune cells across the human lifespan
人类生命周期外周免疫细胞的单细胞图谱
A totalof 309 participants from both internal and external cohorts were included in this study. To characterize the dynamics of peripheral immune cell composition and function throughout the human lifespan, 220 healthy volunteers aged 0 years (neonates) to ${\ge}90$ years (nonagenarians) were recruited from the Shanghai Pudong Cohort (NC T 05206643) (Fig. 1a and Supplementary Table 1). The partic i pants spanned the entire human lifespan and were partitioned into 13 age groups (0-,1-,2-,6-,12-,18-,30-,40-,50-,60-,70-,80-and ${\tt>}90$ -year-olds)22-24. We further developed an siAge prediction model based on this lifecycle-wide single-cell dataset and validated the siAge model with an external cohort of 89 additional individuals, including 33 healthy individuals and 56 with a disturbed immune function (Supplementary Table 2).ForscRNA-seq analyses,after filtering out low-quality droplets, atotal of538,266 cells were obtained. According to unsupervised clustering and the expression of signature genes for each subset (Supplementary Table 3), 25 distinct PBMC subsets were identified and visualized by uniform manifold approximation and projection (UMAP) (Fig. 1b and Extended Data Fig. la; details in the Methods). The representative signature genes of the cell subsets and expression levels along with the numberof detected genes and unique molecular identifiers (UMis) for each subset are shown in heatmaps, feature plots and violin plots (Fig. 1c, Extended Data Fig. 1b-e and Supplementary Table3).
本研究共纳入来自内部和外部队列的309名参与者。为表征人类生命周期中外周免疫细胞组成和功能的动态变化,我们从上海浦东队列(NC T 05206643)招募了220名年龄从0岁(新生儿)到${\ge}90$岁(九旬老人)的健康志愿者(图1a和补充表1)。这些参与者覆盖了人类整个生命周期,并被划分为13个年龄组(0岁、1岁、2岁、6岁、12岁、18岁、30岁、40岁、50岁、60岁、70岁、80岁和${\tt>}90$岁)[22-24]。基于这一全生命周期的单细胞数据集,我们进一步开发了siAge预测模型,并使用包含33名健康个体和56名免疫功能紊乱个体的外部队列(共89人)对该模型进行了验证(补充表2)。
在单细胞RNA测序(scRNA-seq)分析中,经过滤除低质量液滴后,共获得538,266个细胞。根据无监督聚类和各亚群的特征基因表达(补充表3),我们鉴定出25个不同的外周血单个核细胞(PBMC)亚群,并通过均匀流形近似与投影(UMAP)进行可视化(图1b和扩展数据图1a;具体方法见"方法"部分)。各细胞亚群的代表性特征基因及其表达水平,以及检测到的基因数和唯一分子标识符(UMIs)数量,通过热图、特征图和小提琴图展示(图1c、扩展数据图1b-e和补充表3)。
Fig.1/Overview of single-cell transcript ome s of peripheral immune cells across each stage of the human lifespan.a,Work flow of the overall experimental design of this study. Panel a created in BioRender. Huang, T. (2024) https:/BioRender.com/a58r007.b,UMAP plot illustrating the peripheral immune cell subsets identified within PBMCs from 61 samples.c, Heatmaps showingthe expression of signature genes in each cellsubset. d, Dot plot showing the age-related variations in proportion of the 25immune cell subsets
图 1: 人类生命周期各阶段外周免疫细胞的单细胞转录组概览
a) 本研究整体实验设计的工作流程。本图使用 BioRender 制作 (Huang, T. (2024) https://BioRender.com/a58r007
b) UMAP 图展示 61 个样本 PBMC 中鉴定的外周免疫细胞亚群
c) 热图显示各细胞亚群特征基因的表达情况
d) 点图展示 25 种免疫细胞亚群比例的年龄相关性变化
Given that cell-type-specific aging analyses largely depend on accurate cell-type annotation, we took multiple approaches to ensure the reliability of our annotation. The cell subset annotation derived from scRNA-seq was first validated at the single-cell protein level using high-throughput CyTOF analyses with a panel of metal isotope-tagged protein markers(Supplementary Table4) and demonstrated good agreement between the two measures (Extended Data Fig. 2a-f).Additional validations were performed usingtwo other approaches,the automatic annotation tool Azimuth2s (Extended Data Fig. 2g) and gene set enrichment analysis(Extended Data Fig.2h), with both showing good agreement.
鉴于细胞类型特异性衰老分析在很大程度上依赖于准确的细胞类型注释,我们采用了多种方法来确保注释的可靠性。首先通过高通量CyTOF分析结合一组金属同位素标记的蛋白标志物(补充表4),在单细胞蛋白水平验证了源自scRNA-seq的细胞亚群注释,结果显示两种测量方法具有良好的一致性(扩展数据图2a-f)。我们还使用了另外两种方法进行额外验证:自动注释工具Azimuth2s(扩展数据图2g)和基因集富集分析(扩展数据图2h),两者均显示出良好的一致性。
Peripheral immune cell composition dynamics across the lifespan
外周免疫细胞组成在生命周期中的动态变化
To obtain a global view ofthe dynamics of PBMC composition, the proportion ofeach ofthe 25 cell subsets in total PB MCs was calculated for each sample from the 13 age groups(Extended Data Fig.3a).Ofthe 25 cell subsets,22 exhibited significant differences in proportions among different age groups (Fig.1d and Extended Data Fig.3a) (Kruskal-Wallis test, false discovery rate $(\mathrm{FDR})<0.05)$ .A proportion ofcertain cell subsets were positively correlated with age, such as CD 4 TEM GN LY cells and CD 8 TEM GN LY cells (Extended Data Fig. 3b) and others were negatively correlated with age,such as CD 4 Naive C CR 7 cells, CD 8 Naive LEF 1 cells, NK CD 56 high cells and B_Naive cells (Extended Data Fig. 3c). Several cell subsets exhibited enrichment in certain age groups. For example, $\mathbf{CD14^{+}}$ monocyte cells were enriched in the umbilical cord blood group, plasma cells were enriched in children (peaking in the 6-year-old group) and CD 8 MA IT S LC 4 A 10 cells were enriched in adolescents (peaking in the 18-year-old group) (Extended Data Fig. 3d). Three cell subsets did not show significant changes in proportion with respect to age (forexample, natural killer (NK) proliferating, CD16+ monocytes and plasma cyto id dendritic cells), suggesting that they are relatively stable across the human lifespan (Kruskal-Wallis test, $\mathrm{FDR}>0.05 $ .Cell composition dynamics were further analyzed at the single-cell protein level using high-throughput CyTOF and showed good agreement (Extended Data Fig. These results demonstrate differential correlations of different PBMC subsets with age at single-cell resolution.
为全面了解PBMC组成的动态变化,我们计算了13个年龄组样本中25种细胞亚群在总PBMC中的占比(扩展数据图3a)。其中22种细胞亚群的比例在不同年龄组间存在显著差异(图1d和扩展数据图3a)(Kruskal-Wallis检验,错误发现率(FDR)<0.05)。部分细胞亚群比例与年龄呈正相关,如CD4 TEM GNLY细胞和CD8 TEM GNLY细胞(扩展数据图3b);而CD4 Naive CCR7细胞、CD8 Naive LEF1细胞、NK CD56 high细胞和B_Naive细胞等则呈负相关(扩展数据图3c)。若干细胞亚群在特定年龄组富集,例如CD14+单核细胞在脐带血组富集,浆细胞在儿童组富集(6岁组达峰值),CD8 MAIT SLC4A10细胞在青少年组富集(18岁组达峰值)(扩展数据图3d)。NK增殖细胞、CD16+单核细胞和浆细胞样树突状细胞等3种亚群的比例未随年龄发生显著变化(Kruskal-Wallis检验,FDR>0.05),提示这些细胞在人类生命周期中保持相对稳定。通过高通量CyTOF技术在单细胞蛋白层面的进一步分析显示一致结果(扩展数据图3e-g),这些发现以单细胞分辨率揭示了不同PBMC亚群与年龄的差异化关联规律。
Peripheral immune cell transcriptional dynamics across the lifespan
外周免疫细胞转录动态的终身变化
To systematically investigate the transcript ome dynamics of PBMC subsets over the entire lifespan, we ranked the 25 PBMC subsets bythe number of differential ly expressed genes (DEGs) (Fig. 2a). The top ten cell subsets with the highest DEG numbers all belonged to lymphoid lineage cell subsets (that is, T cell, NK cell and B cell types), indicating that these cell subsets were the most strongly affected by age.Among the top ten cell subsets, eight were T cells, and marked differences in the numbers of DEGs were observed among different Tcell subsets (Fig. 2a). No myeloid lineage (that is, monocytes, dendritic cells (DCs) and mega kary o cyte s)had ${\tt z l00}$ DEGs.
为系统研究外周血单个核细胞 (PBMC) 亚群在整个生命周期中的转录组动态变化,我们根据差异表达基因 (DEGs) 数量对25个PBMC亚群进行了排序 (图 2a)。DEG数量最高的前十种细胞亚群均属于淋巴系细胞亚群 (即T细胞、NK细胞和B细胞类型),表明这些细胞亚群受年龄影响最为显著。在前十种细胞亚群中,有八种是T细胞,且不同T细胞亚群间的DEG数量存在显著差异 (图 2a)。髓系细胞 (即单核细胞、树突状细胞 (DCs) 和巨核细胞) 未出现 ${\tt z l00}$ 个DEGs。
To explore the functional dynamics ofPBMC subsets across the lifespan,the DEGsinthe 25 subsets were subjected to functional enrichment analyses separately.DEGs were enriched in biological processes including pathways related to positive regulation of cell activation (24 cell subsets), lymphocyte-mediated immunity (23 cell subsets), regulation of leukocyte cell-cell adhesion (22 cell subsets) and type Il interferon production (22 cell subsets) (Fig. 2b).We then focused on age-related genes that were monotonically correlated with age across 13 age groups.Kruskal-Wallis one-way analysis was used to identify cell subsets with significant differences across age groups. FDR correction was applied to account for multiple testing and the values are shown above the dot plot. Horizontal dashed line marks the threshold for FDR significance $\langle\mathrm{FDR}<0.05\rangle$ .mDCs, myeloid dendritic cells; pDCs, plasma cyto id dendritic cells; UMAP, uniform manifold approximation and projection; y, years.
为探究PBMC亚群在生命周期中的功能动态变化,我们对25个亚群的差异表达基因(DEG)分别进行了功能富集分析。这些DEG显著富集于以下生物学过程:细胞活化正调控(24个细胞亚群)、淋巴细胞介导的免疫反应(23个细胞亚群)、白细胞间黏附调控(22个细胞亚群)以及II型干扰素产生(22个细胞亚群)(图2b)。随后我们聚焦于在13个年龄组中与年龄呈单调相关性的基因。采用Kruskal-Wallis单因素方差分析鉴定不同年龄组间存在显著差异的细胞亚群,并通过FDR校正进行多重假设检验,校正后p值显示于点图上方。水平虚线表示FDR显著性阈值$\langle\mathrm{FDR}<0.05\rangle$。mDCs指髓系树突状细胞;pDCs为浆细胞样树突状细胞;UMAP表示均匀流形近似与投影;y代表年份。
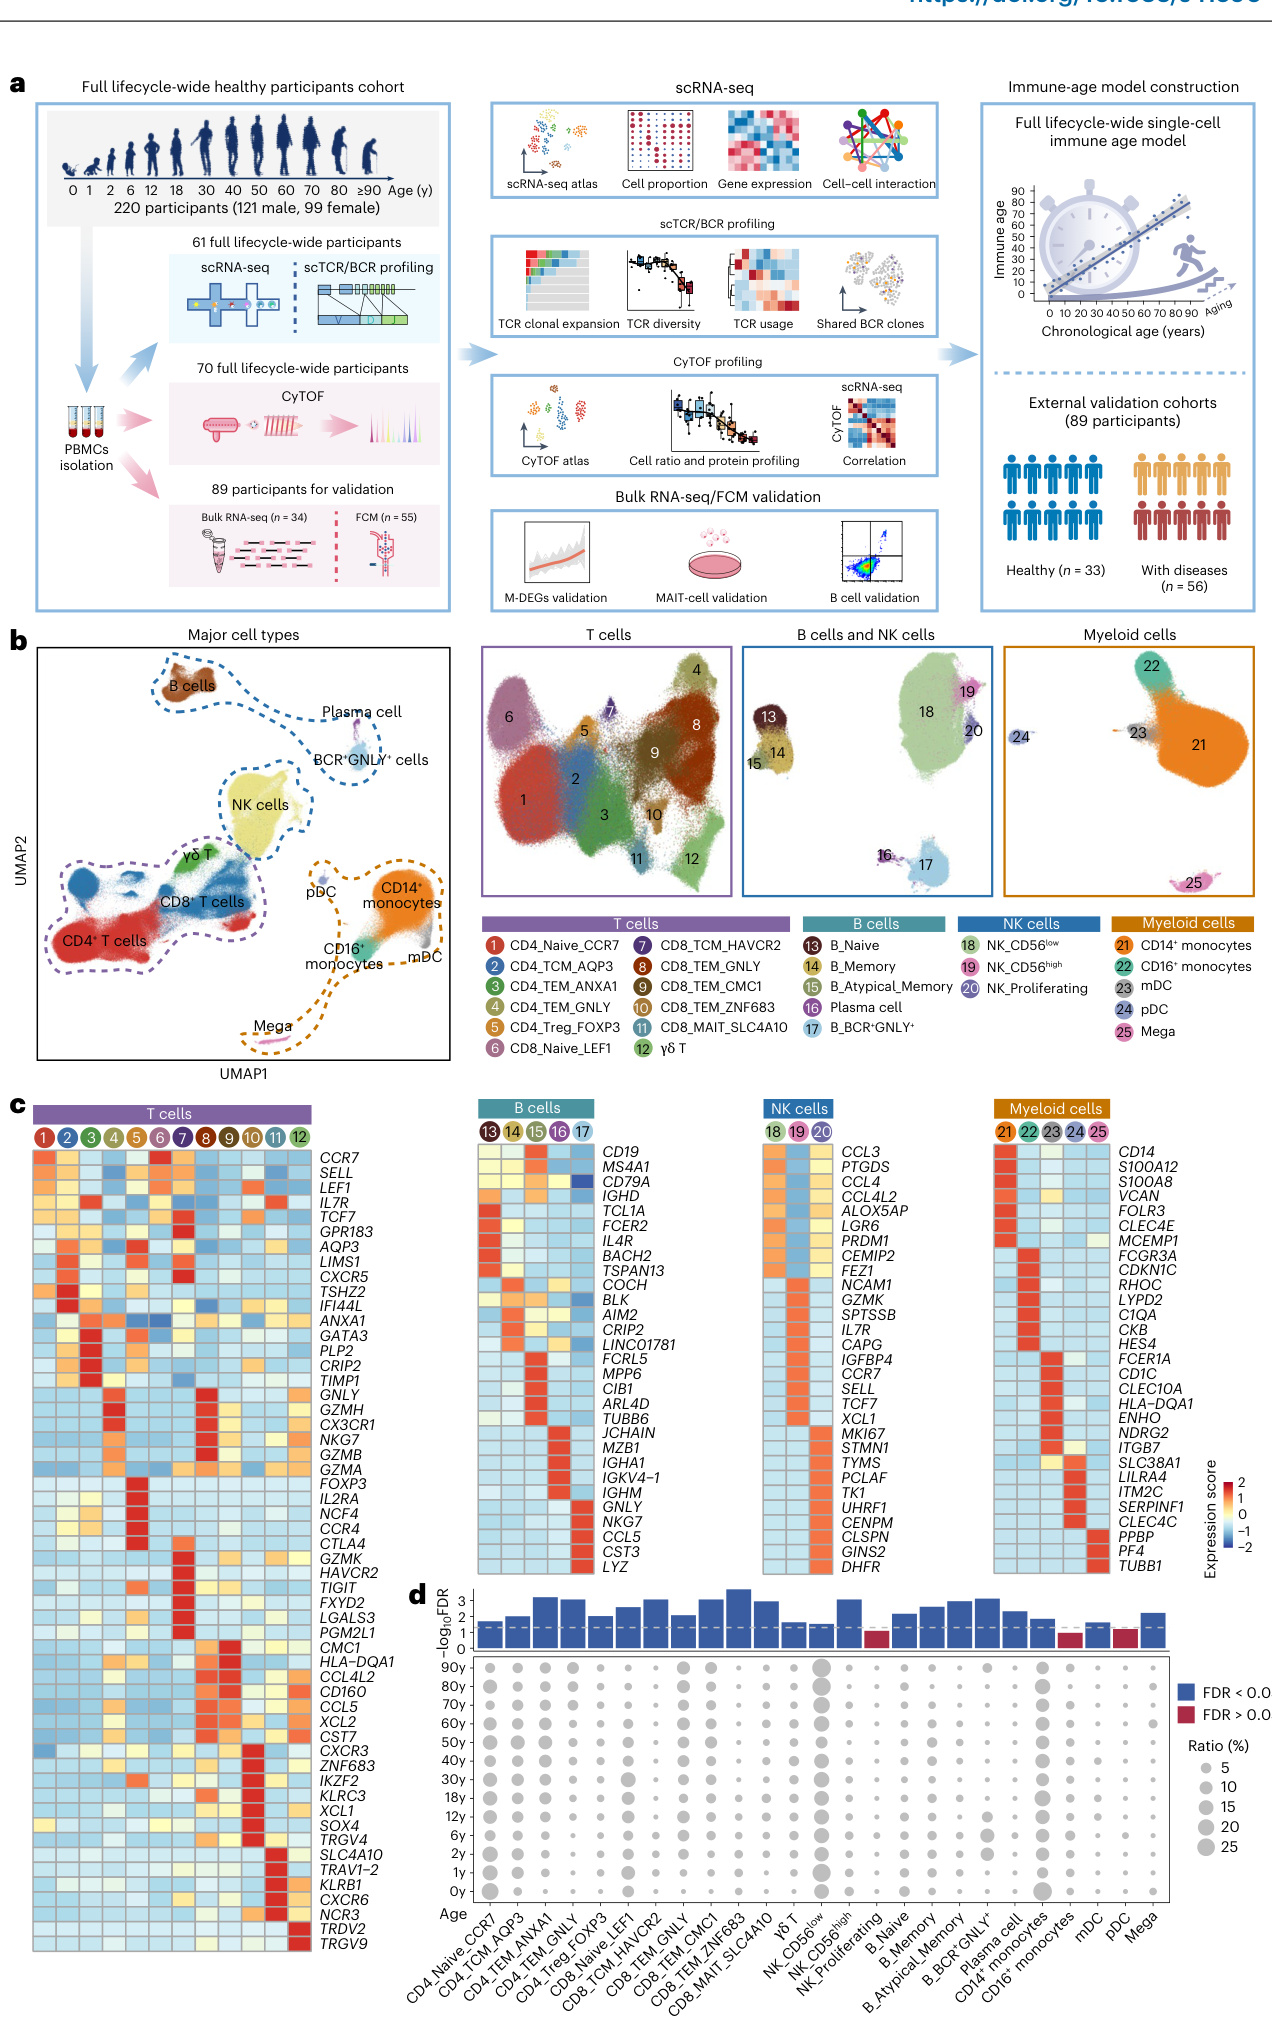
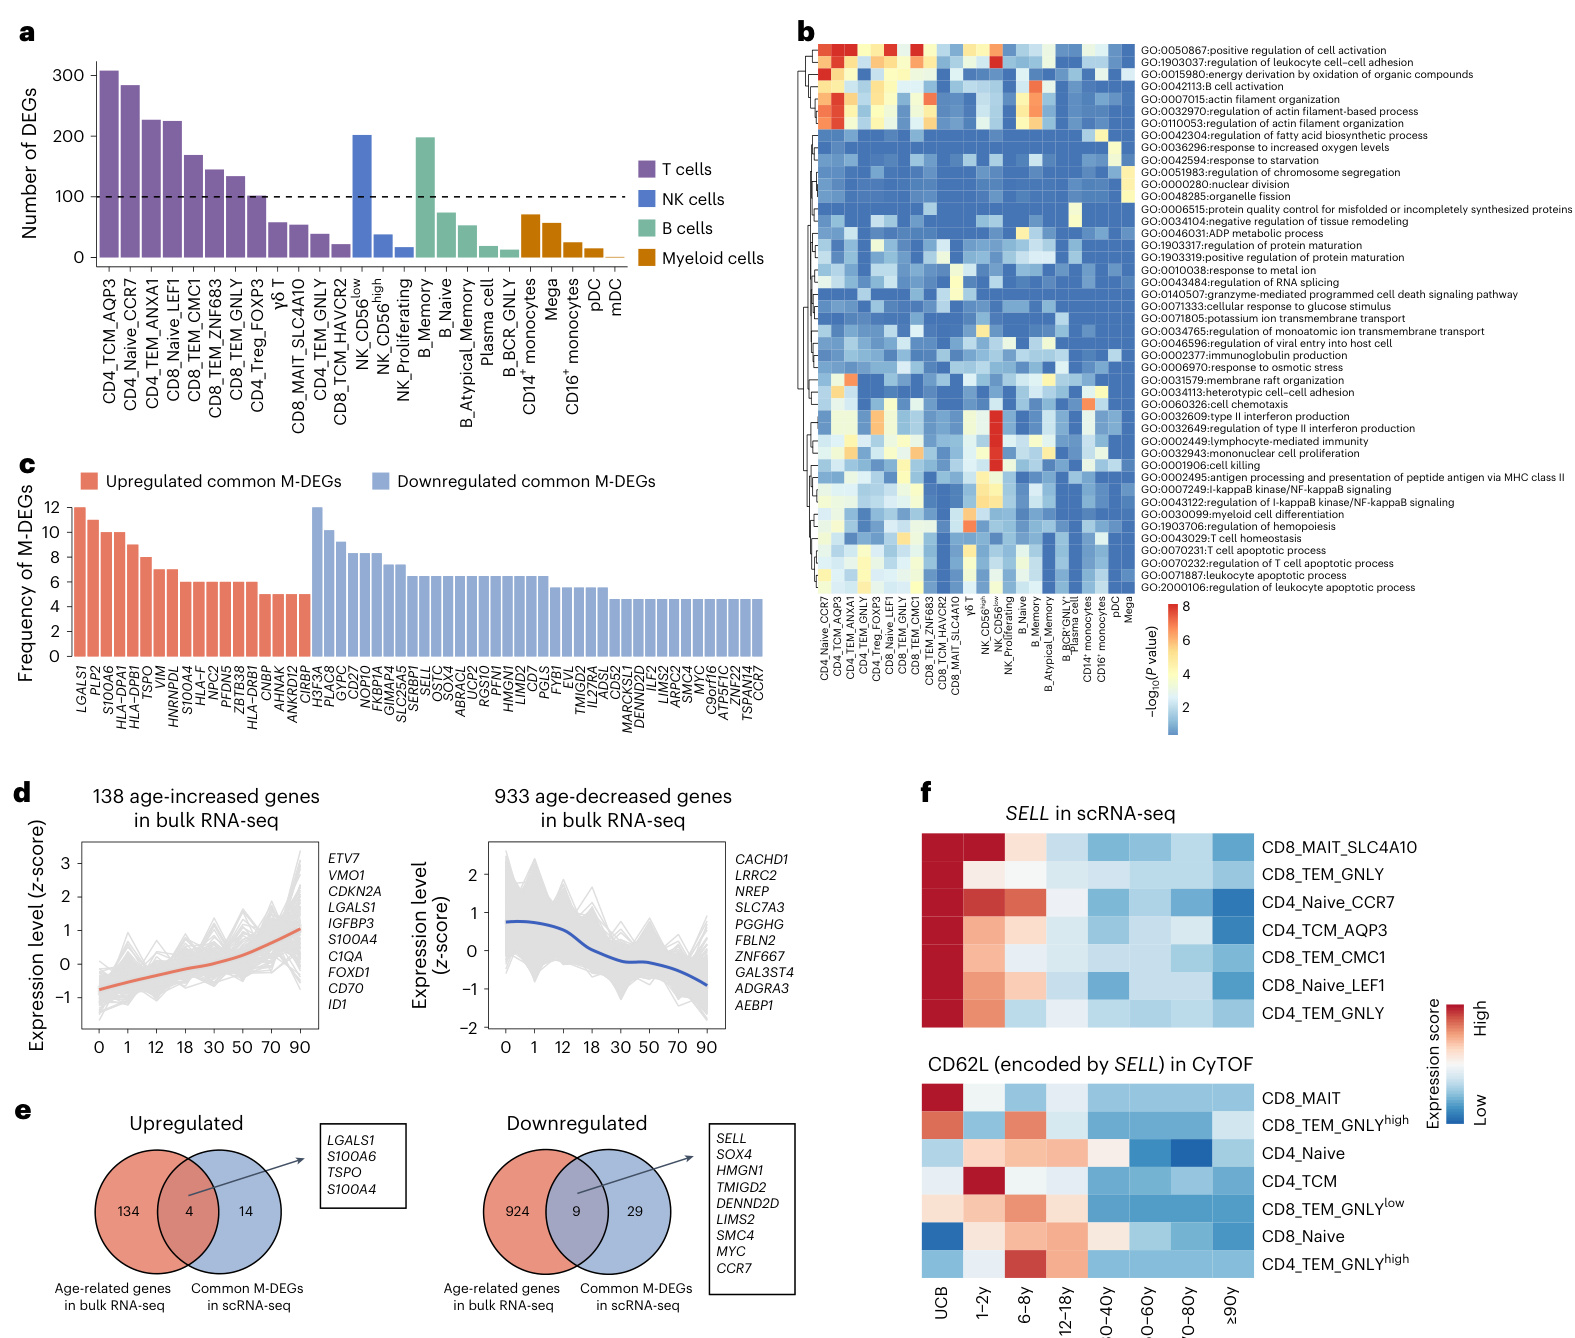
Fig.2|Global transcript ome dynamics of peripheral immune cells throughout the human lifespan.a, Bar plot showing the number of DEGs derived from scRNA-seq analyses of all cell subsets.b, Heatmap showing the functional enrichment analyses of DEGsin all cell subsets. $P$ values were determined by hyper geometric test.c,Bar plots showingthe frequencies of up regulated and down regulated M-DEGs derived from scRNA-seq analyses observed in all cell subsets.All M-DEGs with a frequency of ≥5 are displayed. d, Line plots showing the expression trajectories of up regulated(left panel) and down regulated(right panel)age-related genes identified by bulk RNA-seq analyses.Data areshown
图 2: 人类生命周期中外周免疫细胞的全局转录组动态
a) 柱状图显示所有细胞亚群scRNA-seq分析得出的差异表达基因(DEGs)数量。
b) 热图展示所有细胞亚群DEGs的功能富集分析结果。$P$值通过超几何检验计算得出。
c) 柱状图显示所有细胞亚群中观察到的上调(up regulated)和下调(down regulated)M-DEGs频率。仅展示频率≥5的M-DEGs。
d) 折线图展示通过bulk RNA-seq分析识别的上调(左图)和下调(右图)年龄相关基因表达轨迹。
in terms of gene expression z-score.Eachgray line represents the expression trajectory of a gene.e,Venn diagrams showingthe number of overlapping genes between common M-DEGs identified in scRNA-seq data and age-related genes identified in bulk RNA-seq data.Amongthe 56 common M-DEG genes defined by scRNA-seq, 13 intersected with the age-related genes defined by bulk RNA-seq. f, Heatmap showing the expression of SELL gene in seven cell subsets by scRNAseq and CD62L protein (encoded by SELL) in corresponding cell subsets by CyTOF amongeight life stages.
就基因表达z值而言。每条灰线代表一个基因的表达轨迹。e,维恩图展示了在单细胞RNA测序(scRNA-seq)数据中识别的共有M-DEGs与批量RNA测序(bulk RNA-seq)数据中识别的年龄相关基因之间的重叠基因数量。在scRNA-seq定义的56个共有M-DEG基因中,有13个与bulk RNA-seq定义的年龄相关基因存在交集。f,热图显示SELL基因在七个细胞亚群中的scRNAseq表达情况,以及CyTOF检测的相应细胞亚群中CD62L蛋白(由SELL编码)在八个生命阶段的表达水平。
(monotonic al DEGs, M-DEGs). Consistent with results from the DEG analyses,thetop tencell subsets with the highest number of M-DEGs $(\geq30)$ were lymphoid lineage cell subsets, supporting that these lymphoid lineage cell subsets are susceptible to aging (Extended Data Fig. 4a,b and Supplementary Table 5). Eight of the top ten were T cell subsets,one was anNKcell subset and onewasa Bcell subset.The top three cell subsets with the largest number of M-DEGs were T cell subsets:CD 4 Naive C CR 7,CD 4 TCM A QP 3 and CD 8 Naive LEF 1 cells (Extended Data Fig. 4a,b). Functional enrichment analyses showed that the up regulated M-DEGs were enriched in pro-inflammatory biological processes, such as type Il interferon production and positive regulation of I kinase/NF-kB signaling (Extended Data Fig. 4c and
(单调性差异表达基因, M-DEGs)。与DEG分析结果一致,M-DEGs数量最多$(\geq30)$的前十个细胞亚群均为淋巴系细胞亚群,表明这些淋巴系细胞亚群易受衰老影响(扩展数据图4a、b和附表5)。其中八个为T细胞亚群,一个为NK细胞亚群,一个为B细胞亚群。M-DEGs数量最多的前三个细胞亚群均为T细胞亚群:CD4 Naive CCR7、CD4 TCM AQP3和CD8 Naive LEF1细胞(扩展数据图4a、b)。功能富集分析显示,上调的M-DEGs富集于促炎性生物过程,如II型干扰素产生和I激酶/NF-κB信号的正调控(扩展数据图4c和
Supplementary Table 6), whereas the down regulated M-DEGs were enriched in telomere organization and actin filament organization (Extended Data Fig.4d and Supplementary Table 6).
补充表 6),而下调的 M-DEGs 在端粒组织和肌动蛋白丝组织中富集 (扩展数据图 4d 和补充表 6)。
Next,weranked theM-DEGsbythe number of cell subsets in which they were involved and determined the common M-DEGs shared by multiple cell subsets. M-DEGs shared by greater than or equal to five cell subsets were defined as common M-DEGs. The analyses identified 18 up regulated common M-DEGsand 38 down regulated common M-DEGs (Fig. 2c and Supplementary Table 5). Functional enrichment analyses showed that the up regulated commonM-DEG s were enriched inpathways associated with positive regulation of I-kB kinase/NF-kB signaling, positive regulation of cell-cell adhesion and major his to compatibility complex class Il protein complex assembly (Extended Data Fig. 4e). Down regulated common M-DEG s were enriched in pathways associated with telomere maintenance, mono nuclear cell differentiation and actin filament organization (Extended Data Fig.4f). In addition to monotonic changes across the life stages, age-related DEGs defined by scRNA-seq exhibited enrichment at specific age ranges.For instance,144 DEGs from 12 cell types were enriched at the child stage (Extended Data Fig. 4g,i), whereas 90 DEG s from 18 cell types were enriched atthe70-80-year-old (elderly) stage (Extended Data Fig.4h,j). The scRNA-seq-defined common M-DEGs represent genes that are both widely expressed in different cell subsets and strongly correlated with age. We next sought to validate these scRNA-seq-defined common M-DEGs using traditional bulk RNA-seq in an independent cohort of 34 healthy individuals (O to ${\ge}90$ years old), which provides an average gene expression profile for the entire population of cells26,27. We identified 1,071age-related genes in PBMCs inthebulk RNA-seq dataset(Fig.2d,Extended Data Fig.4k and Supplementary Table 7). Remarkably, among the 56 common M-DEG genes defined by scRNA-seq, 13 intersected with the age-related genes defined by bulk RNA-seq, including four genes up regulated with age and nine down regulated with age (Fig. 2e). This overlap underscores a high concordance between the findings obtained from scRNA-seq, covering different cell subsets, and those from bulk RNA-seq, giving a global view.Of the four up regulated common M-DEGs,S100A6,S100A4 and L GALS len code proteins that can promote inflammation and drive tumor i genesis and metastasis 28-3. Although S100A4 was previously reported to be highly elevated in centenarians?,its potential functional role in aging has not been investigated. Using an in vitro aging model, we found that S100A4 acted as a positive regulator in the aging process (Supplementary Fig. 1and Supplementary Information Section1.1). Of the down regulated common M-DEGs,SELL,CCR7and TMI GD 2 encode proteins that maintain immune homeostasis by modulating the balance of immunity and tolerance 31-33. The age-related common M-DEG SELL (encoding CD62L) was further validated atthe single-cell protein level with CyTOF (Fig. 2f). These results suggest that the age-related common M-DEGs shared by different cell subsets may represent potential immune biomarkers across the lifespan.
接下来,我们根据M-DEGs涉及的细胞亚群数量进行排序,并确定多个细胞亚群共有的M-DEGs。将共享于五个及以上细胞亚群的M-DEGs定义为共有M-DEGs。分析共鉴定出18个上调共有M-DEGs和38个下调共有M-DEGs(图2c和补充表5)。功能富集分析显示,上调共有M-DEGs在I-kB激酶/NF-kB信号正向调控、细胞间黏附正向调控及主要组织相容性复合体II类蛋白复合体组装等通路中富集(扩展数据图4e);下调共有M-DEGs则在端粒维持、单核细胞分化和肌动蛋白丝组织等通路中富集(扩展数据图4f)。除生命周期中的单调变化外,scRNA-seq定义的年龄相关DEGs在特定年龄段呈现富集特征:例如12种细胞类型的144个DEGs在儿童期富集(扩展数据图4g,i),而18种细胞类型的90个DEGs在70-80岁(老年)阶段富集(扩展数据图4h,j)。这些scRNA-seq定义的共有M-DEGs代表在不同细胞亚群中广泛表达且与年龄强相关的基因。
我们随后在34名健康人(0至${\ge}90$岁)的独立队列中使用传统bulk RNA-seq验证这些scRNA-seq定义的共有M-DEGs,该方法可提供细胞群体的平均基因表达谱[26,27]。在bulk RNA-seq数据集中,我们鉴定了1,071个PBMCs年龄相关基因(图2d、扩展数据图4k和补充表7)。值得注意的是,在scRNA-seq定义的56个共有M-DEGs中,有13个与bulk RNA-seq定义的年龄相关基因重叠,包括4个随年龄上调基因和9个下调基因(图2e)。这种重叠凸显了scRNA-seq(覆盖不同细胞亚群)与bulk RNA-seq(提供全局视角)结果的高度一致性。
在4个上调共有M-DEGs中,S100A6、S100A4和LGALS1编码的蛋白可促进炎症并驱动肿瘤发生与转移[28-30]。尽管此前报道S100A4在百岁老人中显著升高,但其在衰老中的潜在功能尚未研究。通过体外衰老模型,我们发现S100A4在衰老进程中发挥正向调控作用(补充图1和补充信息章节1.1)。在下调共有M-DEGs中,SELL、CCR7和TMIGD2编码的蛋白通过调节免疫与耐受平衡维持免疫稳态[31-33]。年龄相关共有M-DEG SELL(编码CD62L)在CyTOF单细胞蛋白水平得到进一步验证(图2f)。这些结果表明,不同细胞亚群共享的年龄相关共有M-DEGs可能代表贯穿生命周期的潜在免疫生物标志物。
Immunological processes involve interactions among various immune cell types to coordinate their behavior during an immune response34,35s We thus further investigated the rewiring of CCIs among peripheral immune cells across the lifespan and found that the CCis displayed different patterns at different stages ofthe lifespan (Fig. 3a-f). Topological characteristics indicated that immune checkpoints have a more critical role in the age-modulated CCl network than non-immune checkpoints (Fig.3g-j). The alterations of immune checkpoints across the whole human lifespan mainly occur in T cells and might have essential roles during human development and aging (Fig. 3k,l and Extended Data Fig. 5a,b). Detailed information about CCls is provided in Supplementary Information Section 1.2.
免疫过程涉及多种免疫细胞类型之间的相互作用,以协调它们在免疫反应中的行为[34,35]。因此,我们进一步研究了外周免疫细胞在整个生命周期中细胞间通讯(CCI)的重连情况,发现CCI在生命周期的不同阶段表现出不同的模式(图 3a-f)。拓扑特征表明,在年龄调节的CCI网络中,免疫检查点比非免疫检查点具有更关键的作用(图 3g-j)。免疫检查点在整个人类生命周期中的变化主要发生在T细胞中,并可能在人类发育和衰老过程中发挥重要作用(图 3k,l 和扩展数据图 5a,b)。关于CCI的详细信息见补充信息第1.2节。
Clonal expansion ofeffector T cells across the lifespan We further explored the cl on al expansion in all T cell subsets and their V(D)J gene usages across the entire lifespan by reconstructing
效应T细胞的克隆扩增跨越整个生命周期
我们通过重建所有T细胞亚群及其V(D)J基因使用情况,进一步探究了这些细胞在整个生命周期中的克隆扩增现象。
Fig.3|Rewiring ofcCls among peripheral immune cells across the human lifespan.a, Heatmap showing that CCI probability varied significantly across the lifespan.The probability foreach CCl was row-scaled with az-score. The significantly varied CCls among eight different human life stages were determined using Kruskal-Wallis one-way analyses. $P$ valueswere adjusted with FDR, and an adjusted $P$ value $({P_{\mathrm{{adj}}}})$ of $<0.0001$ was considered statistically significant. b, Bar plot showing that T cells experience the most intensive rewiring in CCls with age.c-f, Network graphs showing the CCI cluster 1(c), cluster 2 (d),cluster3(e)and cluster4(f)froma.The hub cell subset of each cluster is highlighted with a larger node size inc-f.The hub cell subset of each cluster is highlighted with a larger node size.g,Network graph showing the CCI network mediated by differential ly expressed ligands and receptors. h, Bar plot showing
图 3: 人类生命周期中外周免疫细胞间 CCls 的重连情况。a, 热图显示 CCI 概率在整个生命周期中变化显著。每个 CCl 的概率通过 z 分数进行行标准化。使用 Kruskal-Wallis 单因素分析确定了八个不同人生阶段中显著变化的 CCls。$P$ 值经 FDR 校正,校正后 $P$ 值 $({P_{\mathrm{adj}}})$ $<0.0001$ 被认为具有统计学意义。b, 条形图显示 T 细胞在 CCls 中随年龄变化经历最剧烈的重连。c-f, 网络图展示来自 a 的 CCI 簇 1(c)、簇 2(d)、簇 3(e) 和簇 4(f)。每个簇的中心细胞亚群在 c-f 中用较大的节点突出显示。g, 网络图展示由差异表达的配体和受体介导的 CCI 网络。h, 条形图显示
TCR sequences from scTCR-seq. We obtained matched TCR and transcript ome information from over $90%$ ofall Tcells(Extended Data Fig.6a). In prior research focused onthe adult population,an increased peak in T cell cl on al expansion was observed only in the elderly36. However,our lifecycle-widecohort,with exclusive access to childhood and adolescent data, reveals that high T cell clonal expansions manifest two peaks, occurring duringthe early life developmental stage (2-12 years old) and the late-life elderly stage (70-90 years old) (Fig. 4a). Further comparison of the V(D) gene usage profiles among these six age groups showed that 43 genes were differential ly used (Kruskal-Wallis test, $P<0.05)$ (Fig. 4b). No significant differences were observed in the length distribution of the complement ari ty-determining region-3 (CDR3) amino acid sequences in TCR chains and chains(Extended Data Fig. 6b). Using hierarchical clustering from the differential ly used v(D)J genes, the six age groups were clustered into two distinct groups: the 2-12-year-old group (early life high T cell cl on al expansion (high-TCE) group) and the 70-90-year-old group (late-life high-TCE group) (Fig.4b). The selective usage of V(D) genes reflects the different features of T cell responses in different age groups and may be associated with human immune development or senescence.
来自单细胞TCR测序的TCR序列。我们从超过$90%$的所有 T细胞中获得了匹配的TCR和转录组信息(扩展数据图6a)。在先前针对成年人群的研究中,仅在老年人中观察到T细胞克隆扩增的高峰[36]。然而,我们覆盖全生命周期的队列,凭借独有的儿童和青少年数据,揭示了高T细胞克隆扩增呈现两个高峰,分别出现在生命早期发育阶段(2-12岁)和晚年老年阶段(70-90岁)(图4a)。进一步比较这六个年龄组的V(D)基因使用模式,发现43个基因存在差异使用(Kruskal-Wallis检验,$P<0.05$)(图4b)。在TCR 链和链的互补决定区-3(CDR3)氨基酸序列长度分布上未观察到显著差异(扩展数据图6b)。通过差异使用的V(D)J基因进行层次聚类,六个年龄组被分为两个明显类别:2-12岁组(生命早期高T细胞克隆扩增(high-TCE)组)和70-90岁组(晚年high-TCE组)(图4b)。V(D)基因的选择性使用反映了不同年龄组T细胞应答的不同特征,可能与人类免疫发育或衰老相关。
Next, we explored the distribution of high-TCE cells among all 11 T cell subsets. We detected different degrees of clonal expansion in different T cell subsets: high-TCE cells (clone size of $\mathord{?}\geq50$ cells)only appeared in three effector memory T cell subsets (CD 8 TEM GN LY, CD 4 TEM GN LY and CD 8 TEM CM C 1 cells) with high STARTRAC expansion scores (Fig. 4c-e and Extended Data Fig. 6c).Among them, CD8 TEM_GNLY cells accounted for the highest proportions of high-TCE cells (Fig. 4c and Extended Data Fig.6c).
接下来,我们探究了高TCE细胞在所有11种αβ T细胞亚群中的分布情况。在不同T细胞亚群中检测到不同程度的克隆扩增:高TCE细胞(克隆规模≥50个细胞)仅出现在三个具有高STARTRAC扩增评分的效应记忆T细胞亚群中(CD8 TEM GNLY、CD4 TEM GNLY和CD8 TEM CM C1细胞)(图4c-e和扩展数据图6c)。其中,CD8 TEM_GNLY细胞的高TCE细胞占比最高(图4c和扩展数据图6c)。
Next, we performed DEG analyses to explore the functional features underlying the clonal expansion of CD 8 TEM GN LY cells in the two high-TCE groups. In the early life high-TCE group, 635 significantly up regulated DEGs were identified, including cytotoxic genes (GZMB and PRF1) and energy metabolism-related genes (COX5B,COX5A,NDUFAB1,NDUFB10,NDUFS6and NDUFS3)(Fig.4f).Functional enrichment analyses showed that these DEGs were enriched in the regulation of T cell activation, cell killing, regulation of leukocyte proliferation and oxidative phosphor yl ation pathways (Fig. 4g). In the late-life high-TCE group, 87 up regulated DEGs were identified, including interferon-related genes (IFITM3 and /SG20) and anti-apoptosis genes (TSC22D3 and IL7R)37 (Fig. 4f).Functional enrichment analyses showed that these DEGs were enriched in the response to virus, response to type Il interferon, negative regulation of lymphocyte apoptotic process and response to type Il interferon pathways (Fig. 4g).Accordingly, we analyzed the expression of cyto toxicity, oxidative phosphor yl ation, leukocyte proliferation and type Il interferon-related pathways in the clonal expansion of CD 8 TEM GN LY cells in the early life and late-life high-TCE groups. We found that the expressions of cyto toxicity, oxidative phosp hory la tion and positive regulation of mono nuclear cell proliferation were significantly up regulated in early life high-TCE groups, whereas the expression of genes in the response to type Il interferon pathway was up regulated in late-life high-TCE groups (Fig. 4h). Thus,the upregulated DEGs in high-TCE CD 8 TEM GN LY cells at the elderly stage were the top ten biological processes enriched inthe differential ly expressed ligands and receptors. $P$ values were determined by hyper geometric test.i,Box plot showingthe average shortest path length and degree of immune checkpoints and non-immune checkpoints in g. Box plots show median, first (lower hinge) and third(upper hinge) quartiles;whiskers show $1.5\times$ the interquartile range. $P$ values were determined by a two-sided unpaired Wilcoxon rank-sum test.j, Bar plot showing,for each immune checkpoint ligand and receptor,the number of cell subsets in which they were detected as differential ly expressed. k, Heatmaps showing the scaled expression of CD27,ICOS and PDCD1 genes across the lifespan in the indicated cell subsets, detected by scRNA-seq.I, Heatmaps showing the scaled expression of CD27,ICOS and PD1 proteins across the lifespan in the indicated cell subsets, detected by CyTOF. UCB, umbilical cord blood.
接下来,我们通过差异表达基因(DEG)分析来探究两个高TCE组中CD8 TEM GN LY细胞克隆扩增的功能特征。在生命早期高TCE组中,鉴定出635个显著上调的DEG,包括细胞毒性基因(GZMB和PRF1)及能量代谢相关基因(COX5B、COX5A、NDUFAB1、NDUFB10、NDUFS6和NDUFS3)(图4f)。功能富集分析显示这些DEG在T细胞活化调控、细胞杀伤、白细胞增殖调控及氧化磷酸化通路中显著富集(图4g)。而在生命晚期高TCE组中,发现87个上调DEG,包含干扰素相关基因(IFITM3和ISG20)及抗凋亡基因(TSC22D3和IL7R)[37](图4f),这些基因在病毒应答、II型干扰素响应、淋巴细胞凋亡负调控及II型干扰素通路中富集(图4g)。
据此,我们分析了生命早期和晚期高TCE组CD8 TEM GN LY细胞克隆扩增中细胞毒性、氧化磷酸化、白细胞增殖及II型干扰素相关通路的表达水平。结果显示,生命早期高TCE组的细胞毒性、氧化磷酸化及单核细胞增殖正调控基因表达显著上调,而生命晚期高TCE组的II型干扰素通路响应基因表达升高(图4h)。因此,老年阶段高TCE组CD8 TEM GN LY细胞中上调的DEG是差异表达配体-受体最富集的十大生物过程。$P$值通过超几何检验计算。
图i箱线图展示免疫检查点与非免疫检查点在网络中的平均最短路径长度和连接度。箱体表示中位数及第一(下铰链)、第三(上铰链)四分位数,须线为1.5倍四分位距。$P$值通过双尾非配对Wilcoxon秩和检验确定。图j条形图显示各免疫检查点配体-受体在细胞亚群中被鉴定为差异表达的频次。图k热图展示scRNA-seq检测的CD27、ICOS和PDCD1基因在生命周期各阶段的标准化表达(按指定细胞亚群)。图l热图展示CyTOF检测的CD27、ICOS和PD1蛋白在生命周期各阶段的标准化表达(按指定细胞亚群)。UCB指脐带血。
involved in biological processes related to chronic inflammation,which has been linked to aging of solid organs3738. By contrast, the higher expression of cytotoxic genes in high-TCE CD 8 TEM GN LY cells at the developmental stage indicated that these T cells may possess powerful killing functions against infected and cancerous cells.Furthermore, transcription factor analyses indicated that the transcription factor regulon GATA3 displayed the highest activity in the early life high-TCE group (Fig. 4i), whereas the transcription factor regulon ETS1 displayed the highest activity in the late-life high-TCE group (Fig. 4i). GATA3 regulates T cell development, proliferation and maintenance 39.40. ETS1 acts as a regulator of human healthy aging by decreasing ribosomal activity41. Thus, although both groups displayed high clonal expansions of CD 8 TEM GN LY cells, there were distinct functions underlying these expanded T cells between the early life and late-life high-TCE groups.
涉及与慢性炎症相关的生物过程,该过程与实体器官衰老有关[37][38]。相比之下,高TCE CD8 TEM GN LY细胞在发育阶段细胞毒性基因的高表达表明,这些T细胞可能对感染细胞和癌细胞具有强大的杀伤功能。此外,转录因子分析表明,转录因子调控子GATA3在生命早期高TCE组中表现出最高活性(图4i),而转录因子调控子ETS1在生命晚期高TCE组中表现出最高活性(图4i)。GATA3调控T细胞的发育、增殖和维持[39][40]。ETS1通过降低核糖体活性来调节人类健康衰老[41]。因此,尽管两组均表现出CD8 TEM GN LY细胞的高克隆扩增,但生命早期和生命晚期高TCE组之间这些扩增T细胞的功能存在明显差异。
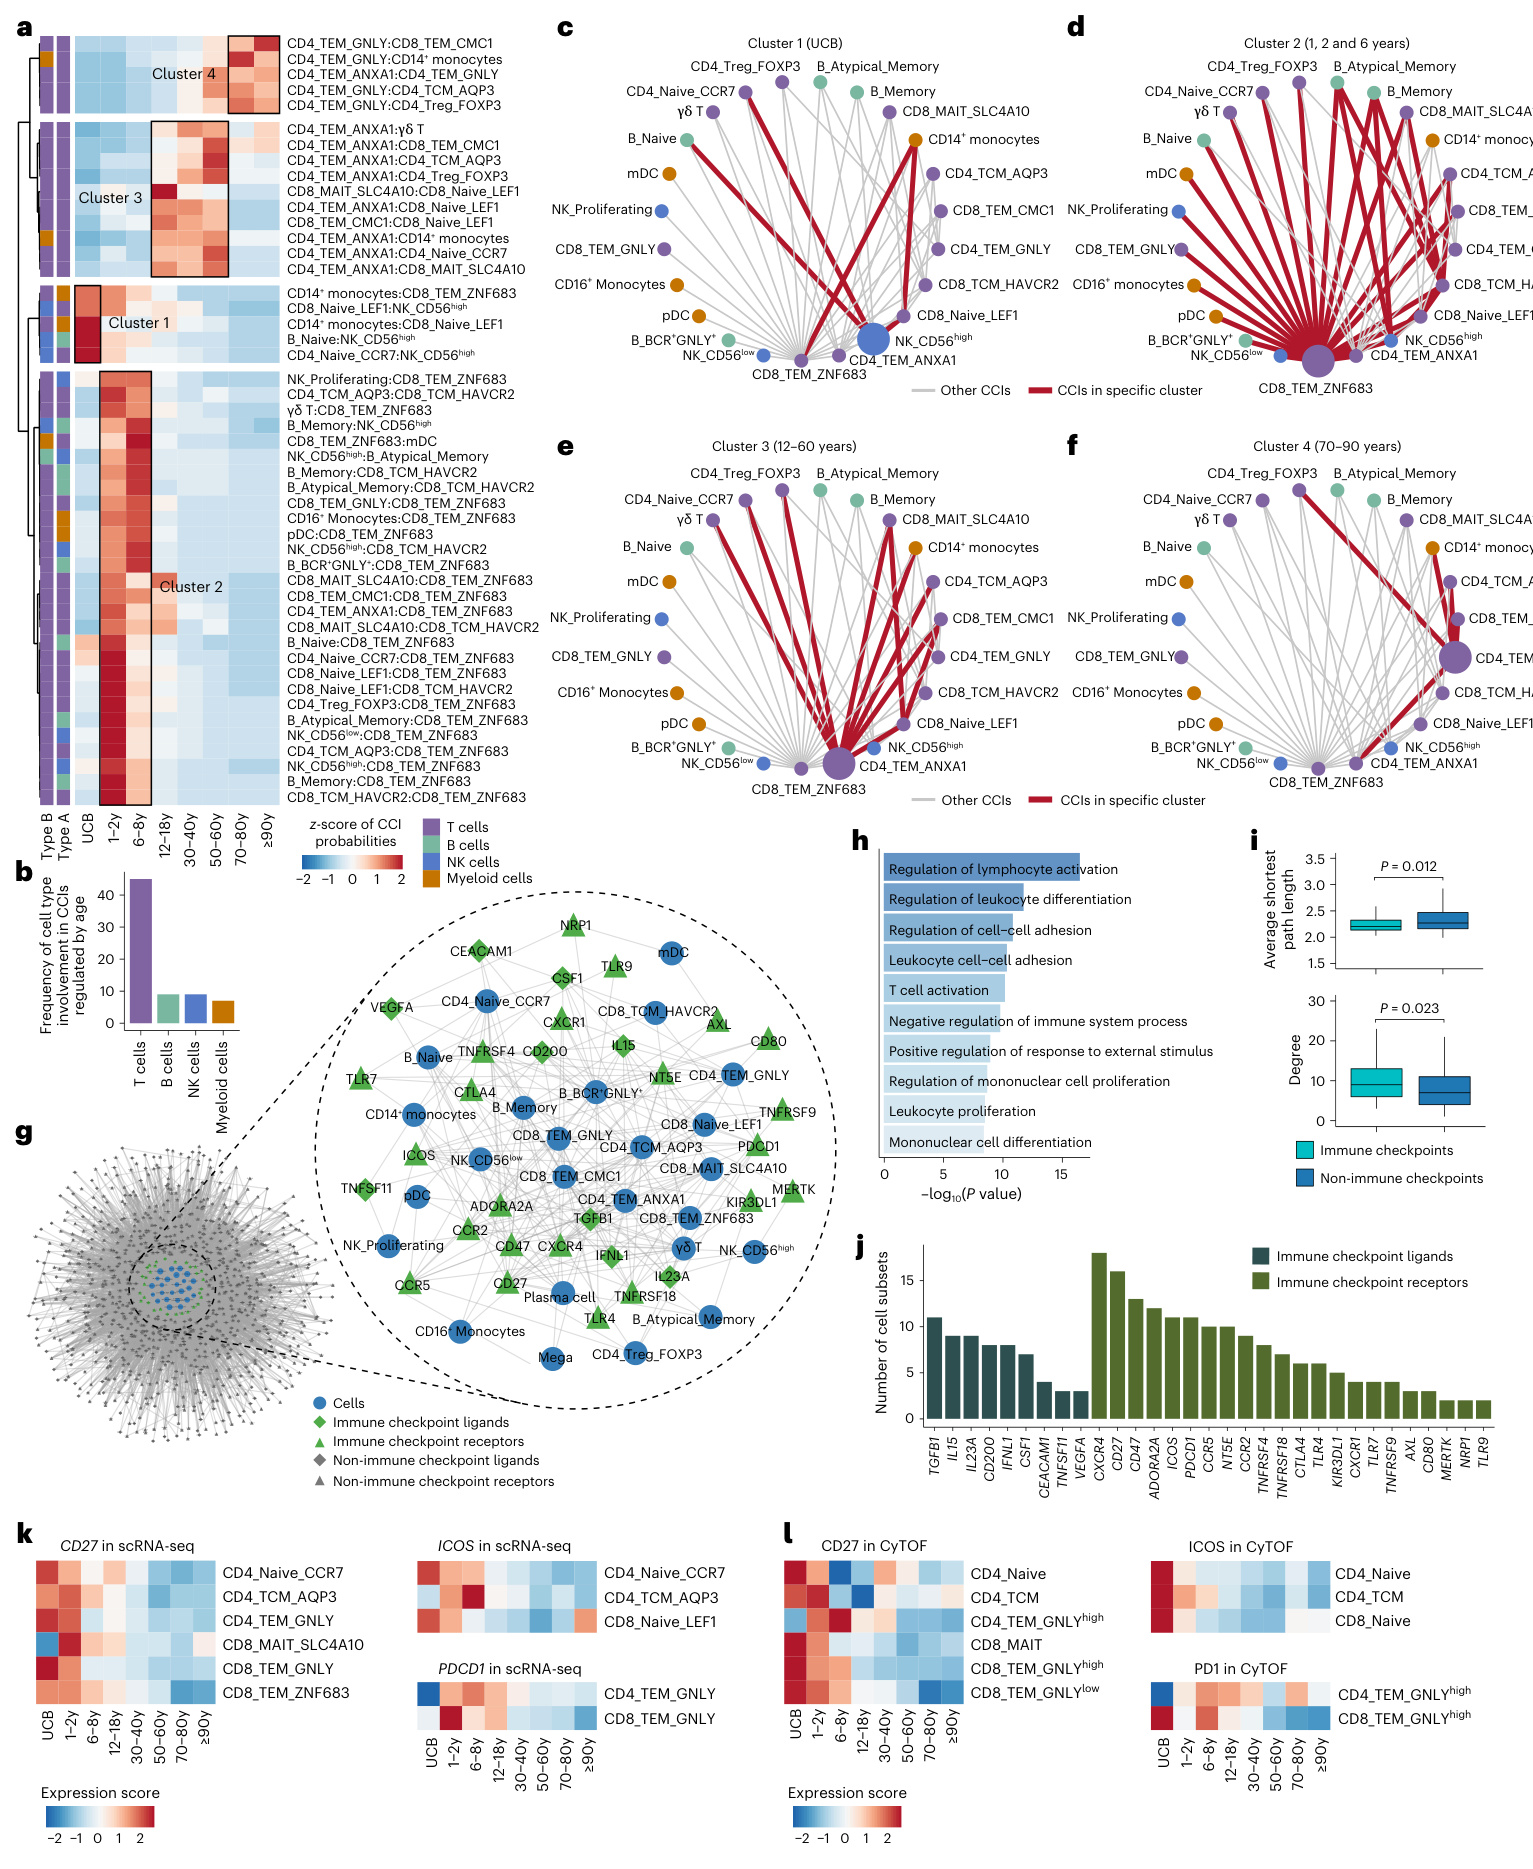
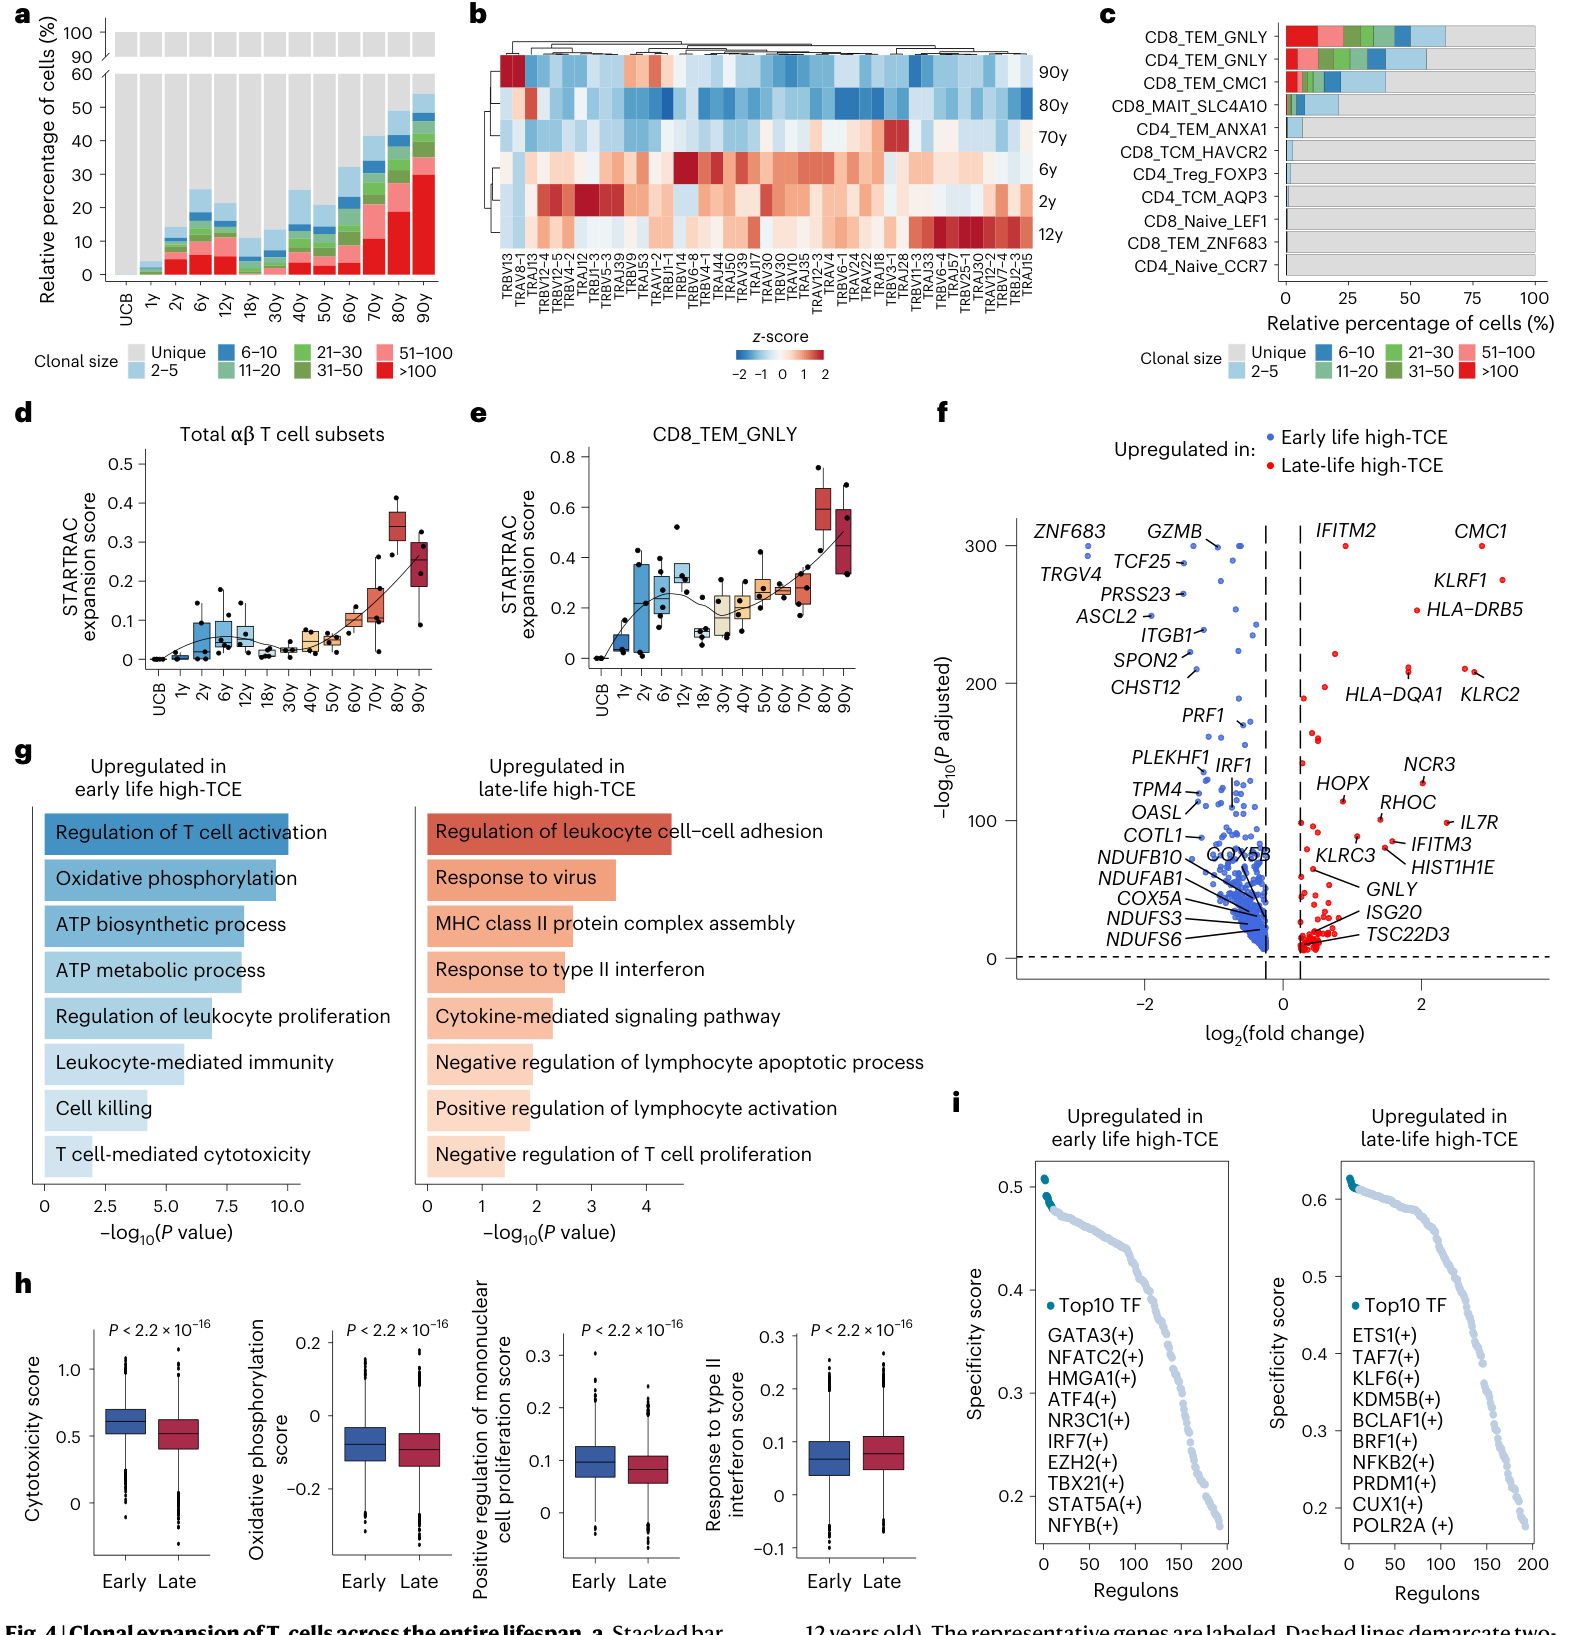
Fig.4|Cl on al expansion of T cells across theentire lifespan.a,Stacked bar graph showing the distribution of T cell clone sizes in the 13 age groups. b, Heatmap showing the row-scaled usage of significantly differential ly expressedV-Jgenesfrom TCR chains and T CR chains across six high-TCE groups (2,6,12,70,80 and 90 years).The sixage groups were clustered into two distinct groups:the 2-12-year-old group (early life high-TCEgroup) and the 70-90-year-old group (late-life high-TCE group).c,Bar plot showing the distribution of T cell clone sizes in each αβ T cell subset. d,e, Box plot showing the clonal expansion levels of total Tcell subsets(d)and CD 8 TEM GN LY cells (e) across 13 age groups quantified by the STARTRAC-expa metric. The black line indicates LOESS regression.f, Volcano plot showing the DEGs in highTCE CD 8 TEM GN LY cells (clone size $\ge50$ cells) in the late-life high-TCE group (70-90 years old) compared with those in the early life high-TCE group (2, 6 and 12 years old). The representative genes are labeled.Dashed lines demarcate twosided Benjamini-Hochberg-corrected $P_{\mathrm{adj}}=0.05$ and $\log_{2}$ fold change $\left(\mathrm{FC}\right)=0.25$ g,Barplots showing the representative enriched biological processes of DEGs up regulated in high-TCE CD 8 TEM GN LY cells in early life (left panel) and in late life (right panel). $P$ values were determined by hyper geometric test.h,Box plots showing the gene module scores for the pathways in high-TCE CD 8 TEM GN LY cells in the early life and late-life high-TCE groups. The two-sided Wilcoxon rank-sum test was used to calculate the $P$ values.i,Rankfor TFregulons in high- TCE CD 8 TEM GN LY cells in the early life (left panel) and late-life (right panel) high-TCE groups using the regulon specificity score. Ind,eand h, box plots show median, first (lower hinge) and third (upper hinge) quartiles; whiskers show $1.5\times$ the interquartile range.MHC,major his to compatibility complex; TF, transcription factor.
图4 | T细胞克隆扩增在整个生命周期的变化。a,堆叠条形图显示13个年龄组中T细胞克隆大小的分布。b,热图显示TCRα链和TCRβ链中显著差异表达的V-J基因在六个高TCE组(2、6、12、70、80和90岁)的行标准化使用情况。这六个年龄组被聚类为两个不同的组:2-12岁组(生命早期高TCE组)和70-90岁组(生命晚期高TCE组)。c,条形图显示各αβ T细胞亚群中T细胞克隆大小的分布。d,e,箱线图显示通过STARTRAC-expa指标量化的13个年龄组中总αβ T细胞亚群(d)和CD8 TEM GN LY细胞(e)的克隆扩增水平。黑线表示LOESS回归。f,火山图显示生命晚期高TCE组(70-90岁)与生命早期高TCE组(2、6和12岁)相比,高TCE CD8 TEM GN LY细胞(克隆大小≥50个细胞)中的差异表达基因(DEGs)。代表性基因已标注。虚线标出双侧Benjamini-Hochberg校正的Padj=0.05和log2倍数变化(FC)=0.25。g,条形图显示生命早期(左图)和生命晚期(右图)高TCE CD8 TEM GN LY细胞中上调DEGs的代表性富集生物过程。P值通过超几何检验确定。h,箱线图显示生命早期和生命晚期高TCE组中高TCE CD8 TEM GN LY细胞通路的基因模块评分。使用双侧Wilcoxon秩和检验计算P值。i,使用调控子特异性评分对生命早期(左图)和生命晚期(右图)高TCE组中高TCE CD8 TEM GN LY细胞的转录因子(TF)调控子进行排序。在d、e和h中,箱线图显示中位数、第一(下铰链)和第三(上铰链)四分位数;须线显示1.5倍四分位距。MHC,主要组织相容性复合体;TF,转录因子。
Different aging patterns in naive versus cells
naive CD4+ 与 CD8+ 细胞的不同衰老模式
A key characteristic of age-related immune dysfunction is the loss of naive T cells5.42. Previous studies that relied on adult data have concludedthat $\mathbf{CD8}^{+}$ cells show a more pronounced decline with age than their $\mathrm{CD4^{+}}$ counterparts 36. However, using scRNA-seq-derived cell classification with our full lifespan coverage, we observed that although both naive T cell subsets (CD 8 Naive LEF 1 and CD 4 Naive C CR 7) exhibited a decreased trend with age (Fig. 5a), their aging trajectories diverge beginning at birth. Specifically, the two naive T cell subsets followed different decreasing trajectories across the human lifespan: naive $\mathsf{C D4^{+}}$ T cells exhibited an abrupt decrease during the early life developmental stage followed by a slower decline after entering adulthood; conversely, naive $\mathbf{CD8}^{+}$ T cells exhibited a gradual decrease through the early life stage followed by a rapid decline in adulthood. The aging patterns ofthe two naive T cell subsets were further supported by CyTOF data (Fig.5b).
与年龄相关的免疫功能障碍的一个关键特征是幼稚T细胞的减少[5.42]。先前基于成人数据的研究认为,$\mathbf{CD8}^{+}$细胞比$\mathrm{CD4^{+}}$细胞表现出更明显的年龄相关性下降[36]。然而,通过scRNA-seq细胞分类结合全生命周期覆盖数据,我们观察到虽然两种幼稚T细胞亚群(CD8 Naive LEF1和CD4 Naive CCR7)均呈现随年龄下降趋势(图5a),但它们的衰老轨迹从出生起就存在差异。具体表现为:幼稚$\mathsf{C D4^{+}}$T细胞在生命早期发育阶段急剧减少,成年后下降趋缓;而幼稚$\mathbf{CD8}^{+}$T细胞在生命早期缓慢减少,成年后则快速下降。CyTOF数据进一步验证了这两种幼稚T细胞亚群的衰老模式(图5b)。
We next sought to examine the functional dynamics of the two naive T cell subsets and identified 76 up regulated M-DEGs for naive $\mathbf{CD4^{+}}$ T cells and 73 for naive $\mathbf{CD8^{+}}$ T cells. The M-DEGs for naive $\mathbf{CD4^{+}}$ T cells changed rapidly in earlier life and reached a plateau-like state in laterlife,whereas theM-DEG s for naive $\mathbf{CD8}^{+}$ T cells showed a conti nuous and straight increase throughout life (Fig.5c,d). Functional enrichment analyses of the up regulated M-DEG s in naive $\mathrm{CD4^{+}}$ andnaive $\mathbf{CD8}^{+}$ T cells revealed several common biological processes shared bythe two naive T cell subsets related to pro-inflammatory pathways, including response to type Il interferon and regulation of autophagy+3 (Fig.5e).
我们接下来研究了两种初始T细胞亚群的功能动态变化,鉴定出初始 $\mathbf{CD4^{+}}$ T细胞有76个上调的M-DEGs,初始 $\mathbf{CD8^{+}}$ T细胞有73个。初始 $\mathbf{CD4^{+}}$ T细胞的M-DEGs在生命早期快速变化,后期趋于稳定平台期;而初始 $\mathbf{CD8}^{+}$ T细胞的M-DEGs则呈现持续线性增长 (图5c,d)。对初始 $\mathrm{CD4^{+}}$ 和初始 $\mathbf{CD8}^{+}$ T细胞中上调M-DEGs的功能富集分析显示,这两个初始T细胞亚群共享多个与促炎通路相关的生物学过程,包括II型干扰素应答和自噬调控+3 (图5e)。
Next, we examined the dynamic patterns of TCR diversity in naive $\mathrm{CD4^{+}}$ and $\mathbf{CD8^{+}}$ T cells and found that their patterns were also different (Fig. 5f,g and Extended Data Fig. 6d). Again, naive $\mathbf{CD4}^{+}$ T cells exhibited a more abrupt decrease during the early life developmental stage than naive $\mathbf{CD8}^{+}$ cells;conversely,naive $\operatorname{CD}8^{+}$ Tcells displayed amore prominent decline in TCR diversity atolder ages than naive $\mathbf{CD4}^{+}$ T cells. These results reveal the different aging-associated transcriptional patterns and repertoire dynamics between naive $\mathrm{CD}4^{+}$ and $\mathbf{CD8}^{+}$ T cells.
接下来,我们检测了初始型 $\mathrm{CD4^{+}}$ 和 $\mathbf{CD8^{+}}$ T细胞中TCR多样性的动态模式,发现它们的模式也存在差异 (图 5f,g 和扩展数据图 6d)。同样,初始型 $\mathbf{CD4}^{+}$ T细胞在生命早期发育阶段表现出比初始型 $\mathbf{CD8}^{+}$ 细胞更急剧的下降;相反,初始型 $\operatorname{CD}8^{+}$ T细胞在老年时期比初始型 $\mathbf{CD4}^{+}$ T细胞表现出更显著的TCR多样性下降。这些结果揭示了初始型 $\mathrm{CD}4^{+}$ 和 $\mathbf{CD8}^{+}$ T细胞之间不同的衰老相关转录模式和受体库动态变化。
Expansion of MAIT cells during maturation
成熟过程中 MAIT细胞的扩增
Mucosal-associated invariant T (MAIT) cells are unique innate-like T lymphocytes that bridge innate and adaptive immunity+.MAITcells rapidly produce cytokines and cytotoxic effectors through both TCR-dependent and TCR-independent mechanisms 45.46 in response to a broad range ofbacteria and viruses,such as Mycobacterium tuberculosist7 and hepatitis B virus. We show that CD 8 MA IT S LC 4 A 10 cells exhibit a uni modal pattern of enrichment during adolescence with a peakin the 18-year-old group (Fig. 5h). The results from the CyTOF analys es exhibited a pronounced concordance withthose from scRNA-seq (Fig. 5i).Clonal analyses showed that the TCR diversity of CD8_MAIT_ SLC4A10 cells also peaked at adolescence (Fig.5j and Extended Data
黏膜相关不变T细胞 (MAIT cells) 是一类独特的先天样T淋巴细胞,连接着先天免疫与适应性免疫。MAIT细胞能通过TCR依赖性和非依赖性机制快速产生细胞因子和细胞毒性效应分子[45][46],响应多种细菌和病毒(如结核分枝杆菌[17]和乙肝病毒)。我们发现CD8_MAIT_SLC4A10细胞在青春期呈现单峰型富集模式,18岁年龄组达到峰值(图5h)。质谱流式分析结果与单细胞RNA测序数据高度一致(图5i)。克隆分析显示CD8_MAIT_SLC4A10细胞的TCR多样性同样在青春期达到顶峰(图5j及扩展数据。
Fig.5|Aging features of naive T cells and CD8+MAIT cells.a,b,Scatter plot illustrating changes inthe proportion of $\mathrm{CD4^{+}}$ (CD 4 Naive C CR 7;left) and $\mathrm{CD8^{+}}$ naive T cells (CD 8 Naive LEF 1; right) in total T cells with aging from scRNA-seq (a) and CyTOF (b).c,d, Heatmap showing the row-scaled expression of M-DEGs in CD 4 Naive C CR 7 (c) and CD 8 Naive LEF 1(d) cells across eight life stages (left), and line plots showing the expression trajectories of M-DEGs up regulated with age (right). Expression z-scores are shown.e,Dot plot showing the representative enriched biological processes of M-DEGs up regulated with age in $\mathrm{CD4^{+}}$ and $\mathrm{CD8^{+}}$ naive T cells.f,g,Scatter plots showing TCR repertoire diversities in $\mathbf{CD4^{+}}(\mathbf{CD4}_{-}$ Naive_CCR7;left) and $\mathrm{CD8^{+}}$ naive T cells(CD 8 Naive LEF 1; right) across eight life stages, as measured by Shannon's entropy (f) and the inverse Simpson index $\mathbf{\Psi}(\mathbf{g})$ .h-j,Scatter plot illustrating the proportion changes of CD 8 MA IT S LC 4 A 10 cells in total T cells with aging from scRNA-seq (h) and CyTOF (i) analyses and their T CR repertoire diversities as measured by Shannon'sentropy (j) across
图 5: 初始T细胞与CD8+MAIT细胞的衰老特征。a,b, 散点图展示总αβ T细胞中CD4+ (CD4初始CCR7;左)与CD8+初始T细胞 (CD8初始LEF1;右)比例随衰老的变化,数据来自单细胞RNA测序 (a) 和质谱流式 (b)。c,d, 热图显示CD4初始CCR7 (c) 和CD8初始LEF1 (d) 细胞中M-DEGs在八个生命阶段的行标准化表达 (左),折线图展示随年龄上调的M-DEGs表达轨迹 (右)。图中显示表达z值。e, 点图展示CD4+和CD8+初始T细胞中随年龄上调的M-DEGs代表性富集生物过程。f,g, 散点图展示八个生命阶段中CD4+ (CD4初始_CCR7;左) 和CD8+初始T细胞 (CD8初始LEF1;右) 的TCR谱多样性,通过香农熵 (f) 和逆辛普森指数Ψ (g) 测量。h-j, 散点图展示总αβ T细胞中CD8 MAIT SLC4A10细胞比例随衰老的变化,数据来自单细胞RNA测序 (h) 和质谱流式 (i) 分析,以及通过香农熵 (j) 测量的TCR谱多样性。
Fig. 6d,e), implying that CD 8 MA IT S LC 4 A 10 cells at this stage might exhibit a stronger ability to fend off pathogen invasion than those at other life stages.
图 6d,e) 表明,这一阶段的 CD 8 MA IT S LC 4 A 10 细胞可能比其他生命阶段的细胞具有更强的抵御病原体入侵能力。
To characterize the function of CD8_MAIT SLC4A10 cells during maturation, we compared gene expression profiles of CD8_MAIT SLC4A10 cells in adolescents with those in other life periods, including children, adults and the elderly. Fig. 5k displays the expression of the up regulated and down regulated DEGs in CD 8 MA IT S LC 4 A 10 cells in adolescents; the expression of the up regulated DEGs reached a peak in adolescents (named'up regulated DEGs'; Fig. 5k). The interaction network analyses suggested that 19 out of the 29 up regulated DEGs closely interacted, with KL R Bl identified as ahub gene (Extended Data Fig.6f).Notably,CyTOF analyses showed that the expression ofCD161 protein (encoded by KLRB1) within MAIT cells also reached its peak in the adolescent period (Extended Data Fig. 6g).
为表征CD8_MAIT_SLC4A10细胞在成熟过程中的功能,我们比较了青少年与其他生命周期(包括儿童、成人和老年人)中该细胞的基因表达谱。图5k展示了青少年CD8_MAIT_SLC4A10细胞中上调与下调差异表达基因(DEGs)的表达情况;其中上调DEGs的表达在青少年时期达到峰值(命名为"上调DEGs";图5k)。相互作用网络分析表明,29个上调DEGs中有19个存在紧密互作,其中KL R Bl被确定为枢纽基因(扩展数据图6f)。值得注意的是,CyTOF分析显示MAIT细胞内CD161蛋白(由KLRB1编码)的表达量也在青少年时期达到峰值(扩展数据图6g)。
Further Gene Ontology enrichment analyses showed that the up regulated DEGs in CD 8 MA IT S LC 4 A 10 cells from individuals during adolescence were enriched in biological processes related to aerobic respiration, lymphocyte proliferation and positive regulation of inflammatory response (Fig. 51), whereas the down regulated DEGs were related to cell adhesion and the apoptotic pathway (Fig. 5l). We further depicted the functional properties of CD 8 MA IT S LC 4 A 10 cells in the adolescent group by gene set enrichment analysis with all expressed genes.Tuberculosis-related signaling displayed a significant down regulation in CD8_MAIT SLC4A10 cells at this stage (Fig. 5m). The incidence and prevalence of tuberculosis are the lowest in young people (15-24 years old) according to the World Health Organization 2021 Global Tuberculosis Report (https://www.who.int), in line with our findings of enhanced MAIT cell function during this period. In addition, antimicrobial effect or function assays showed that the antimicrobial activities of MAIT cells from young adults (aged 18 years) were significantly higher than those from middle-aged counterparts (aged 50 years) (Fig. 5n). Together, these results indicate that CD8_ MA IT S LC 4 A 10 cells at the maturation stage may have a greater ability to resist pathogen invasion than those in other age groups.
进一步的基因本体富集分析显示,青春期个体CD8_MAIT_SLC4A10细胞中上调的差异表达基因(DEGs)富集于有氧呼吸、淋巴细胞增殖和炎症反应正向调控等生物过程(图5i),而下调DEGs则与细胞粘附和凋亡通路相关(图5l)。我们通过全表达基因集富集分析进一步描绘了青春期组CD8_MAIT_SLC4A10细胞的功能特性。结核病相关信号通路在该阶段的CD8_MAIT_SLC4A10细胞中呈现显著下调(图5m)。根据世界卫生组织2021年全球结核病报告(https://www.who.int),青少年(15-24岁)的结核病发病率和患病率最低,这与我们发现的该时期MAIT细胞功能增强现象一致。此外,抗菌效应或功能检测表明,青年组(18岁)MAIT细胞的抗菌活性显著高于中年组(50岁)(图5n)。这些结果表明,成熟期CD8_MAIT_SLC4A10细胞可能比其他年龄段具有更强的抵抗病原体入侵能力。
A newly identified cytotoxic B cell subset
新发现的一种细胞毒性B细胞亚群
Immune cells with cytotoxic functions inthe peripheral blood of healthy individuals generally include NK and cytotoxic T cells+8. Interestingly, we detected a newly identified and unique B cellsubset(B_BCR+GNLY* cells) that simultaneously expressed B cell markers (such as BCR genes, including immunoglobulin heavy-chain or light-chain coding genes, andJCHAIN) and canonical cytotoxic genes (such as GNLY and NKG7) (Fig. $^{1\mathrm{b},\mathrm{c}}$ and Extended Data Fig. 1b,d). The expression of TCR genes, TRACand KLRF1 were hardly detected inthem,excluding the possibility of these cells being T cells or NK cells(Extended Data Fig.1b,d).Weruled out the possibility of potential technical artefacts (thatis,multiplets) because the number of detected genes and UMIs in B_BCR+GNLY+ cells were lower than those in other subsets(Extended DataFig.1e)and a stringent doublet filtration standard was used to exclude potential eight life stages.k, Heatmap showing the expression of all the DEGs (left) and zoom-in on up regulated genes(right) in CD 8 MA IT S LC 4 A 10 cells in adolescents (12-18 years old).1,Bar plots showing the representative enriched biological processes of up regulated (top) and down regulated (bottom) DEGs in CD8_MAIT_ SLC4A10 cells in adolescents.m,GSEA enrichment plot forgene set'tuberculosis in CD 8 MA IT S LC 4 A 10 cells in the adolescent group compared with other groups. n, Schematic diagram showing the design of MAIT cell's b act eric i dal capability assay(left)and bar plot showing the bacteria load afterMAIT cell coculture.The $P$ value was determined by two-sided unpaired Wilcoxon rank-sum test(right, $n=9$ each). $P$ values ine,Iand m were determined by hyper geometric test. $P<0.05$ was considered statistically significant ine,I,mand n.The black lines indicate LOESS regression ina,b,fand g. CFU, colony forming unit; GSEA, gene set enrichment analysis.
健康人外周血中具有细胞毒性的免疫细胞通常包括NK细胞和细胞毒性T细胞+8。有趣的是,我们检测到一个新发现且独特的B细胞亚群(B_BCR+GNLY*细胞),该亚群同时表达B细胞标志物(如BCR基因,包括免疫球蛋白重链或轻链编码基因,以及JCHAIN)和典型细胞毒性基因(如GNLY和NKG7)(图1b,c和扩展数据图1b,d)。这些细胞中几乎检测不到TCR基因TRAC和KLRF1的表达,排除了它们是T细胞或NK细胞的可能性(扩展数据图1b,d)。我们排除了潜在技术假象(即多重捕获)的可能性,因为B_BCR+GNLY+细胞中检测到的基因数和UMI数低于其他亚群(扩展数据图1e),并且采用了严格的双联体过滤标准来排除可能的八个生命阶段。k,热图显示青少年(12-18岁)CD8_MAIT_SLC4A10细胞中所有差异表达基因(DEG)的表达情况(左)及上调基因的放大视图(右)。1,条形图显示青少年CD8_MAIT_SLC4A10细胞中上调(上)和下调(下)DEG的代表性富集生物过程。m,青少年组CD8_MAIT_SLC4A10细胞与其他组相比,基因集"结核病"的GSEA富集图。n,MAIT细胞杀菌能力检测的设计示意图(左)及MAIT细胞共培养后细菌载量的条形图(右,每组n=9)。P值通过双尾非配对Wilcoxon秩和检验确定(右)。e、l和m中的P值通过超几何检验确定。e、l、m和n中P<0.05被认为具有统计学意义。a、b、f和g中的黑线表示LOESS回归。CFU,菌落形成单位;GSEA,基因集富集分析。
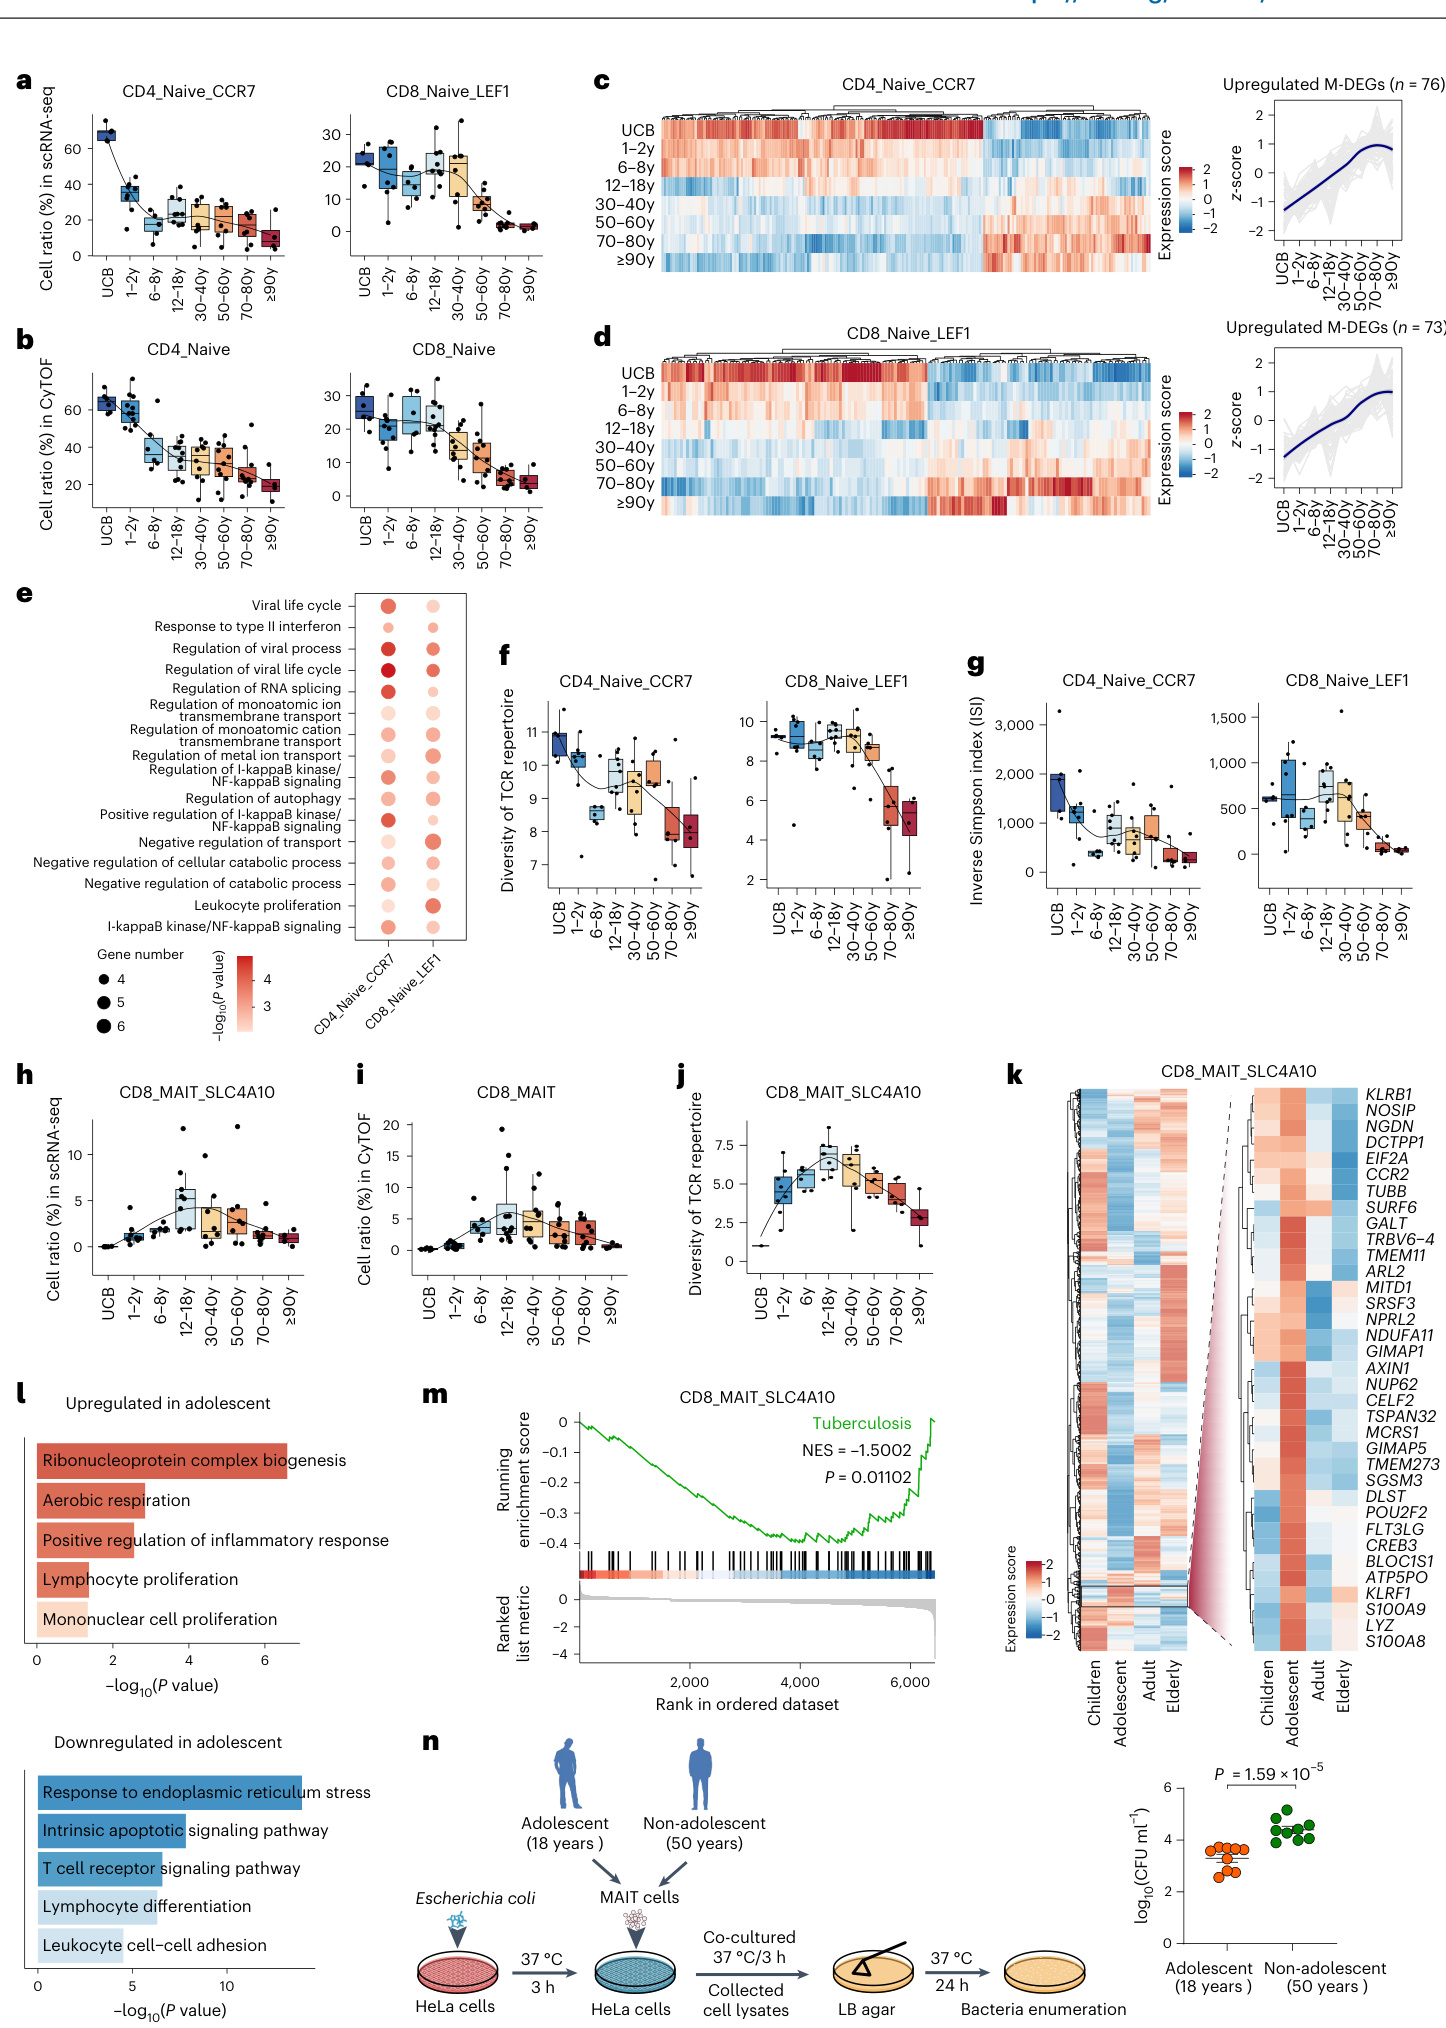
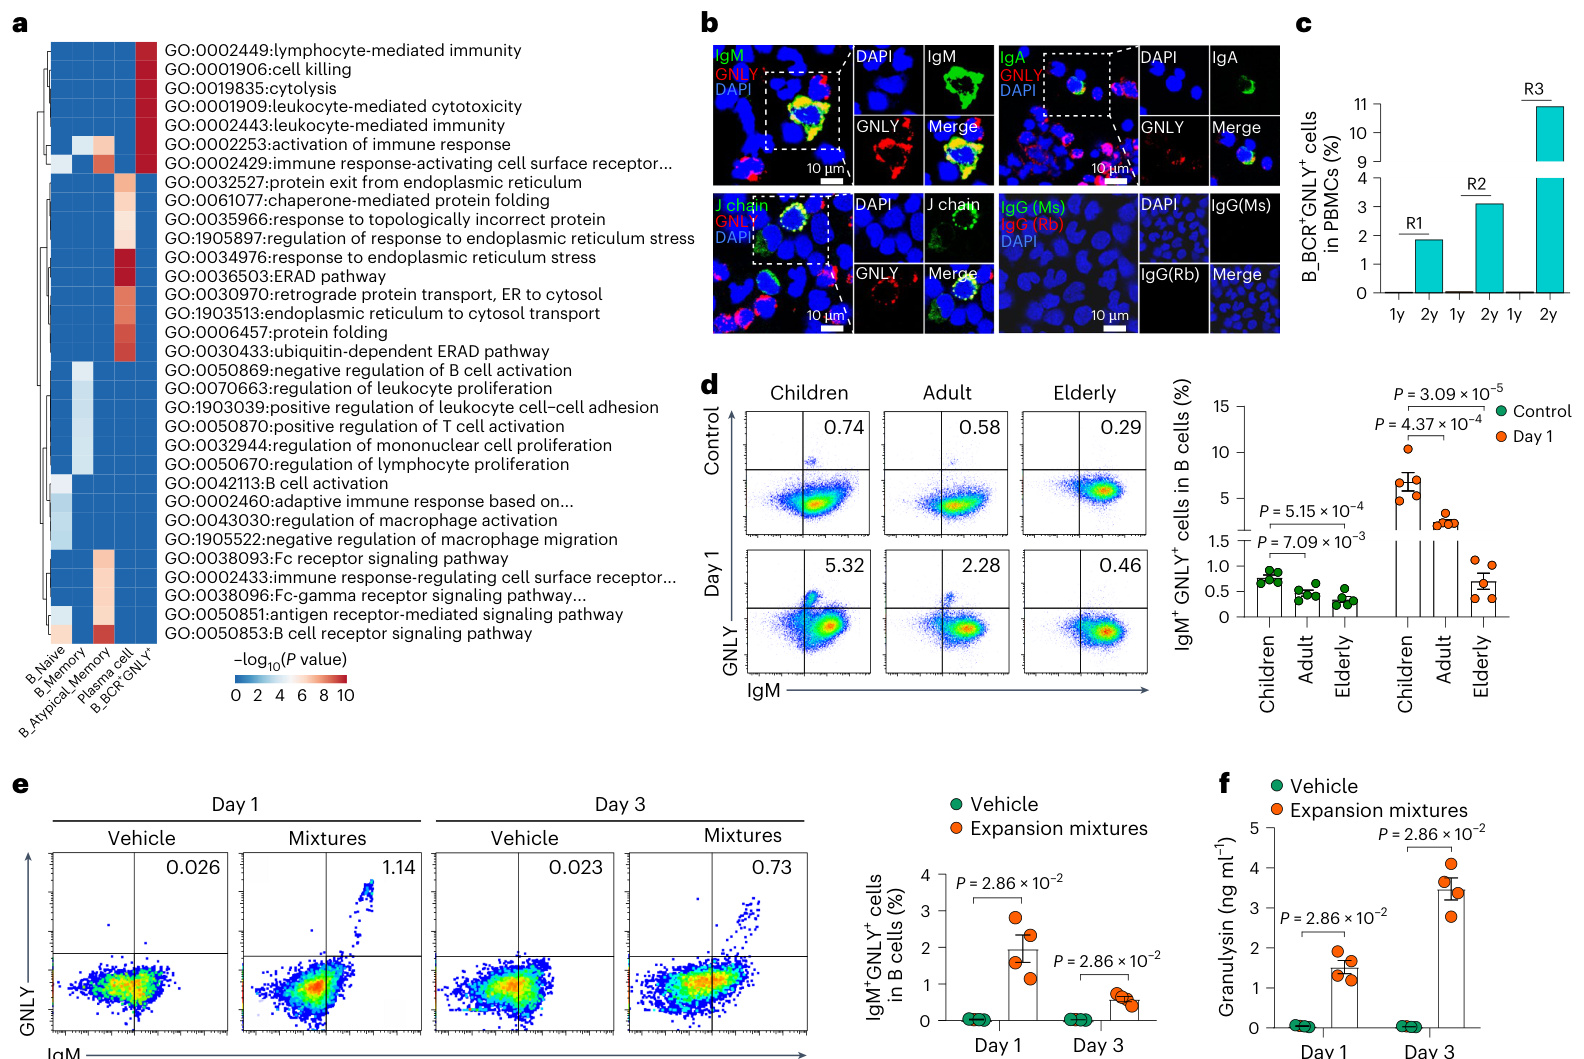
Fig.6|Function of the newly identified cytotoxic B cell subset.a, Heatmap showing the functional enrichment analyses of signature genes ineach B cell subset based on the scRNA-seq analyses. The top ten pathways in each cell subset (ranked by $P$ value)arelisted. $P$ valueswere determined by hyper geometric test. b, Immuno fluorescence of B cell markers(IgM,IgA andJ chain) and the cytotoxic protein granulysin (GNLY) in PBMCs collected from six healthy 6-year-olds. The experiment was repeated fourtimes with similar results.c,Bar plot showing the percentage of B ${\tt B C R}^{+}{\tt G N L Y}^{+}$ cells inPBMCs from three infants with longitudinal follow-up,examined at the ages of1year and 2 years by scRNA-seq analyses.R1, R2 and R3 represent different individuals.d,Flow cytometry analysis showing proportions of IgM*GNLY+ cells in children (4-9 years old), adults (24-30 years old)and the elderly(64-72yearsold),without stimulation(control,topleft) and day1after in vitro stimulation with an expansion mixture consisting of IL-21 $\mathrm{10:ngml^{-1}},$ ,II $\cdot2(50\mathrm{IU}\mathrm{m}\mathrm{I}^{-1})$ ,CD40L $(50\mathsf{n g}\mathsf{m l}^{-1})$ ,anti-BCR $(5\mathrm{mg}\mathrm{ml}^{-1})$ and
图 6 | 新发现的细胞毒性B细胞亚群功能。a、基于单细胞RNA测序分析的各B细胞亚群特征基因功能富集分析热图。列出了每个细胞亚群中排名前十的通路(按P值排序)。P值通过超几何检验确定。b、六名健康6岁儿童外周血单个核细胞中B细胞标志物(IgM、IgA和J链)与细胞毒性蛋白颗粒溶素(GNLY)的免疫荧光检测。实验重复四次,结果相似。c、条形图显示通过单细胞RNA测序分析的三名婴幼儿在1岁和2岁时外周血单个核细胞中B${\tt B C R}^{+}{\tt G N L Y}^{+}$细胞的百分比。R1、R2和R3代表不同个体。d、流式细胞术分析显示儿童(4-9岁)、成人(24-30岁)和老年人(64-72岁)中IgM*GNLY+细胞比例,包括未刺激组(对照,左上)及体外刺激1天后(刺激混合物含IL-21 $\mathrm{10:ngml^{-1}}$、IL-2 $(50\mathrm{IU}\mathrm{m}\mathrm{I}^{-1})$、CD40L $(50\mathsf{n g}\mathsf{m l}^{-1})$、抗BCR $(5\mathrm{mg}\mathrm{ml}^{-1})$)。
doublets.B $\mathbf{^{+}G N L Y^{+}}$ cells exhibited a unimodal pattern, with enrichment in children with a peak in the 6-year-old group. These cells were low in neonates and 1-year-old infants and increased in 2-6-year-old children, followed by a gradual decrease at 12 years, reaching a low level in adulthood (Fig.1d).
双阳性B细胞 $\mathbf{^{+}G N L Y^{+}}$ 呈现单峰分布模式,在儿童群体中富集且峰值出现在6岁组。这类细胞在新生儿和1岁婴儿中含量较低,2-6岁期间逐渐增加,12岁时开始缓慢下降,至成年期维持在较低水平 (图1d)。
Toexplore the functional differences between B ${\bf B}{\bf C}{\bf R}^{\mathrm{}}{\bf G}{\bf N}{\bf L}{\bf Y}^{\mathrm{*}}$ cells and the other four B cell subsets, we identified the signature genes of all B cell subsets (Supplementary Table 10). The top pathway enriched by the signature genes of E $\phantom{-}3_\mathrm{BCR^{+}G N L Y^{+}}$ cells was the cytolysis pathway (Fig. 6a). Double-positive cells (J chain and granulysin, IgM and granulysin or IgA and granulysin) were identified in PBMCs from six additional healthy 6-year-olds using immuno fluorescence (Fig.6b). Longitudinal scRNA-seqand scTCR/BCR-seq results showed the expansion of $\mathsf{B_B C R^{+}G N L Y^{+}}$ cells from age 1 $(0.02%$ $0.03%$ and $0.04%$ inPBMCs)toage 2 $(1.84%$ $10.96%$ and $3.09%$ in PBMCs) in these children (Fig. 6c). We performed flow cytometry to detect the
为了探究B ${\bf B}{\bf C}{\bf R}^{\mathrm{}}{\bf G}{\bf N}{\bf L}{\bf Y}^{\mathrm{*}}$ 细胞与其他四种B细胞亚群的功能差异,我们鉴定了所有B细胞亚群的特征基因 (补充表 10)。E $\phantom{-}3_\mathrm{BCR^{+}G N L Y^{+}}$ 细胞特征基因富集度最高的通路是细胞溶解通路 (图 6a)。通过免疫荧光技术,我们在另外六名健康6岁儿童的PBMCs中鉴定出双阳性细胞 (J链与颗粒溶素、IgM与颗粒溶素或IgA与颗粒溶素) (图 6b)。纵向单细胞RNA测序和单细胞TCR/BCR测序结果显示,这些儿童体内 $\mathsf{B_B C R^{+}G N L Y^{+}}$ 细胞从1岁时的占比 $(0.02%$ 、 $0.03%$ 和 $0.04%$ ) 扩张至2岁时的 $(1.84%$ 、 $10.96%$ 和 $3.09%$ ) (图 6c)。我们采用流式细胞术检测了
CpG0DN2006 $\mathrm{(1:mgml^{-1})}$ (bottomleft) $\mathit{\Omega}_{n=5}$ pergroup).Bar plots showing the percentage of IgM'GNLY+cells in indicated groups(rightpanel).e,Flow cytometry analysis showing the proportion of IlgM*GNLY* cells in cultured human B cells on days 1 and 3 after in vitro stimulation with an expansion mixture (left panel) $n=4$ per group). Bar plots showing the percentage of IgM*GNLY* cells in B cells from each group (right panel).f, Bar plots showing GNLY concentration in culture super nat ants of Bcells on days 1 and 3 of culture after in vitro stimulation with or without an expansion mixture. The concentrations of GN LY were determined byELISA $n=4$ pergroup).Ind,eandf,barplots show themean $\pm\mathsf{s}.\mathsf{e}.\mathsf{m}$ : $P<0.05$ was considered statistically significant.Pvaluesin a were determined by hyper geometric test. $P$ values in d were determined by one-way A NOvA followed bytheTukey post hoctest.Pvalues in e and f were determined by two-sided unpaired Wilcoxon rank-sum test.ELISA,enzymelinked immuno s or bent assay.
CpG0DN2006 $\mathrm{(1:mgml^{-1})}$ (左下) $\mathit{\Omega}_{n=5}$ 每组)。条形图显示指定组中IgM'GNLY+细胞百分比(右图)。e, 流式细胞术分析显示体外扩增混合物刺激后第1天和第3天培养人B细胞中IlgMGNLY细胞比例(左图) $n=4$ 每组)。条形图显示各组B细胞中IgM*GNLY*细胞百分比(右图)。f, 条形图显示有无扩增混合物体外刺激培养后第1天和第3天B细胞培养上清中GNLY浓度。GNLY浓度通过ELISA测定 $n=4$ 每组)。d、e和f中条形图显示均值 $\pm\mathsf{s}.\mathsf{e}.\mathsf{m}$ : $P<0.05$ 被认为具有统计学显著性。a中P值通过超几何检验确定。d中P值通过单因素方差分析(ANOVA)及Tukey事后检验确定。e和f中P值通过双侧非配对Wilcoxon秩和检验确定。ELISA, 酶联免疫吸附试验。
percentage of double-positive cells (IgM and granulysin) in peripheral blood. The proportions of double-positive cells (IgM and granulysin) were significantly higher in children (4-9 years old; $n=5$ )thanthose fromadults(24-30years old; $n=5.$ )or the elderly(64-72yearsold; $n=5,$ (Fig.6d and Supplementary Fig. 2).
外周血中双阳性细胞(IgM和颗粒溶素)的比例。儿童组(4-9岁;$n=5$)的双阳性细胞比例显著高于成人组(24-30岁;$n=5$)或老年组(64-72岁;$n=5$)(图6d和补充图2)。
Cytotoxic Tand B cells areinduced afterin vitro stimulation with expansion mixtures (including cytokines, chemokines, antibodies and adjuvants)49-51. Therefore, circulating B cells were isolated from healthy individuals and stimulated with expansion mixtures that activate B cells°. Flow cytometric analyses showed that the proportion of $\mathsf{I g M}^{+}\mathsf{G N L Y^{+}}$ double-positive B cells was significantly increased in cultured B cells exposed tothe expansion mixtures compared withthose with vehicle (Fig. 6e). Meanwhile, nanogram levels of gran u lys in were detected in the culture super nat ant of B cells (Fig. 6f). Furthermore, to determine whether the response to stimulation was age-dependent, PBMCs isolated from three different life stages (children, 4-9 years old;
细胞毒性T细胞和B细胞在体外经扩增混合物(包括细胞因子、趋化因子、抗体和佐剂)刺激后被诱导产生[49-51]。因此,我们从健康个体中分离出循环B细胞,并用能激活B细胞的扩增混合物进行刺激。流式细胞分析显示,与对照组相比,暴露于扩增混合物的培养B细胞中$\mathsf{I g M}^{+}\mathsf{G N L Y^{+}}$双阳性B细胞比例显著增加(图6e)。同时,在B细胞培养上清中检测到纳克水平的颗粒溶素(图6f)。此外,为确定这种刺激反应是否具有年龄依赖性,我们分离了三个不同生命阶段(儿童组4-9岁;
adults,24-30 years old;elderly,64-72 years old) were subjected tothe expansion mixtures. The proportion of IgM+GNLY+ double-positive B cells was significantly higher in children than in the adult and elderly groups (Fig. 6d), in accordance with our scRNA-seq results.
成人组(24-30岁)和老年组(64-72岁)接受了扩增混合物处理。与我们的单细胞RNA测序结果一致,儿童组中IgM+GNLY+双阳性B细胞的比例显著高于成人组和老年组(图6d)。
The role of granulysin in B cell-mediated functions has yet to be reported.Therefore,we sought to determine whether B_BCR+GNLY+ cells possess potential cytotoxic activities. Our results indicate that although B_BCR+GNLY+ cells are closest to plasma cells among all the B cell subsets with respect to gene expression profiles, the distribution of immunoglobulin isotypes, BCR clonotypes and transcriptional regula tory mechanisms,this newly identified B cell type has its own distinct characteristics and displays cytotoxic activities. Additional details concerning B_BCR+GNLY+ cells are provided in Supplementary Information Section1.3 (Extended Data Figs.8 and 9 and Supplementary Fig.3).
颗粒溶素(granulysin)在B细胞介导功能中的作用尚未见报道。因此,我们试图确定B_BCR+GNLY+细胞是否具有潜在的细胞毒性活性。结果表明,尽管B_BCR+GNLY+细胞在基因表达谱、免疫球蛋白同种型分布、BCR克隆型和转录调控机制方面最接近浆细胞,但这种新发现的B细胞类型具有自身独特特征并表现出细胞毒性活性。补充信息第1.3节提供了关于B_BCR+GNLY+细胞的更多细节 (扩展数据图8和9及补充图3)。
Single-cell immune age prediction model
单细胞免疫年龄预测模型
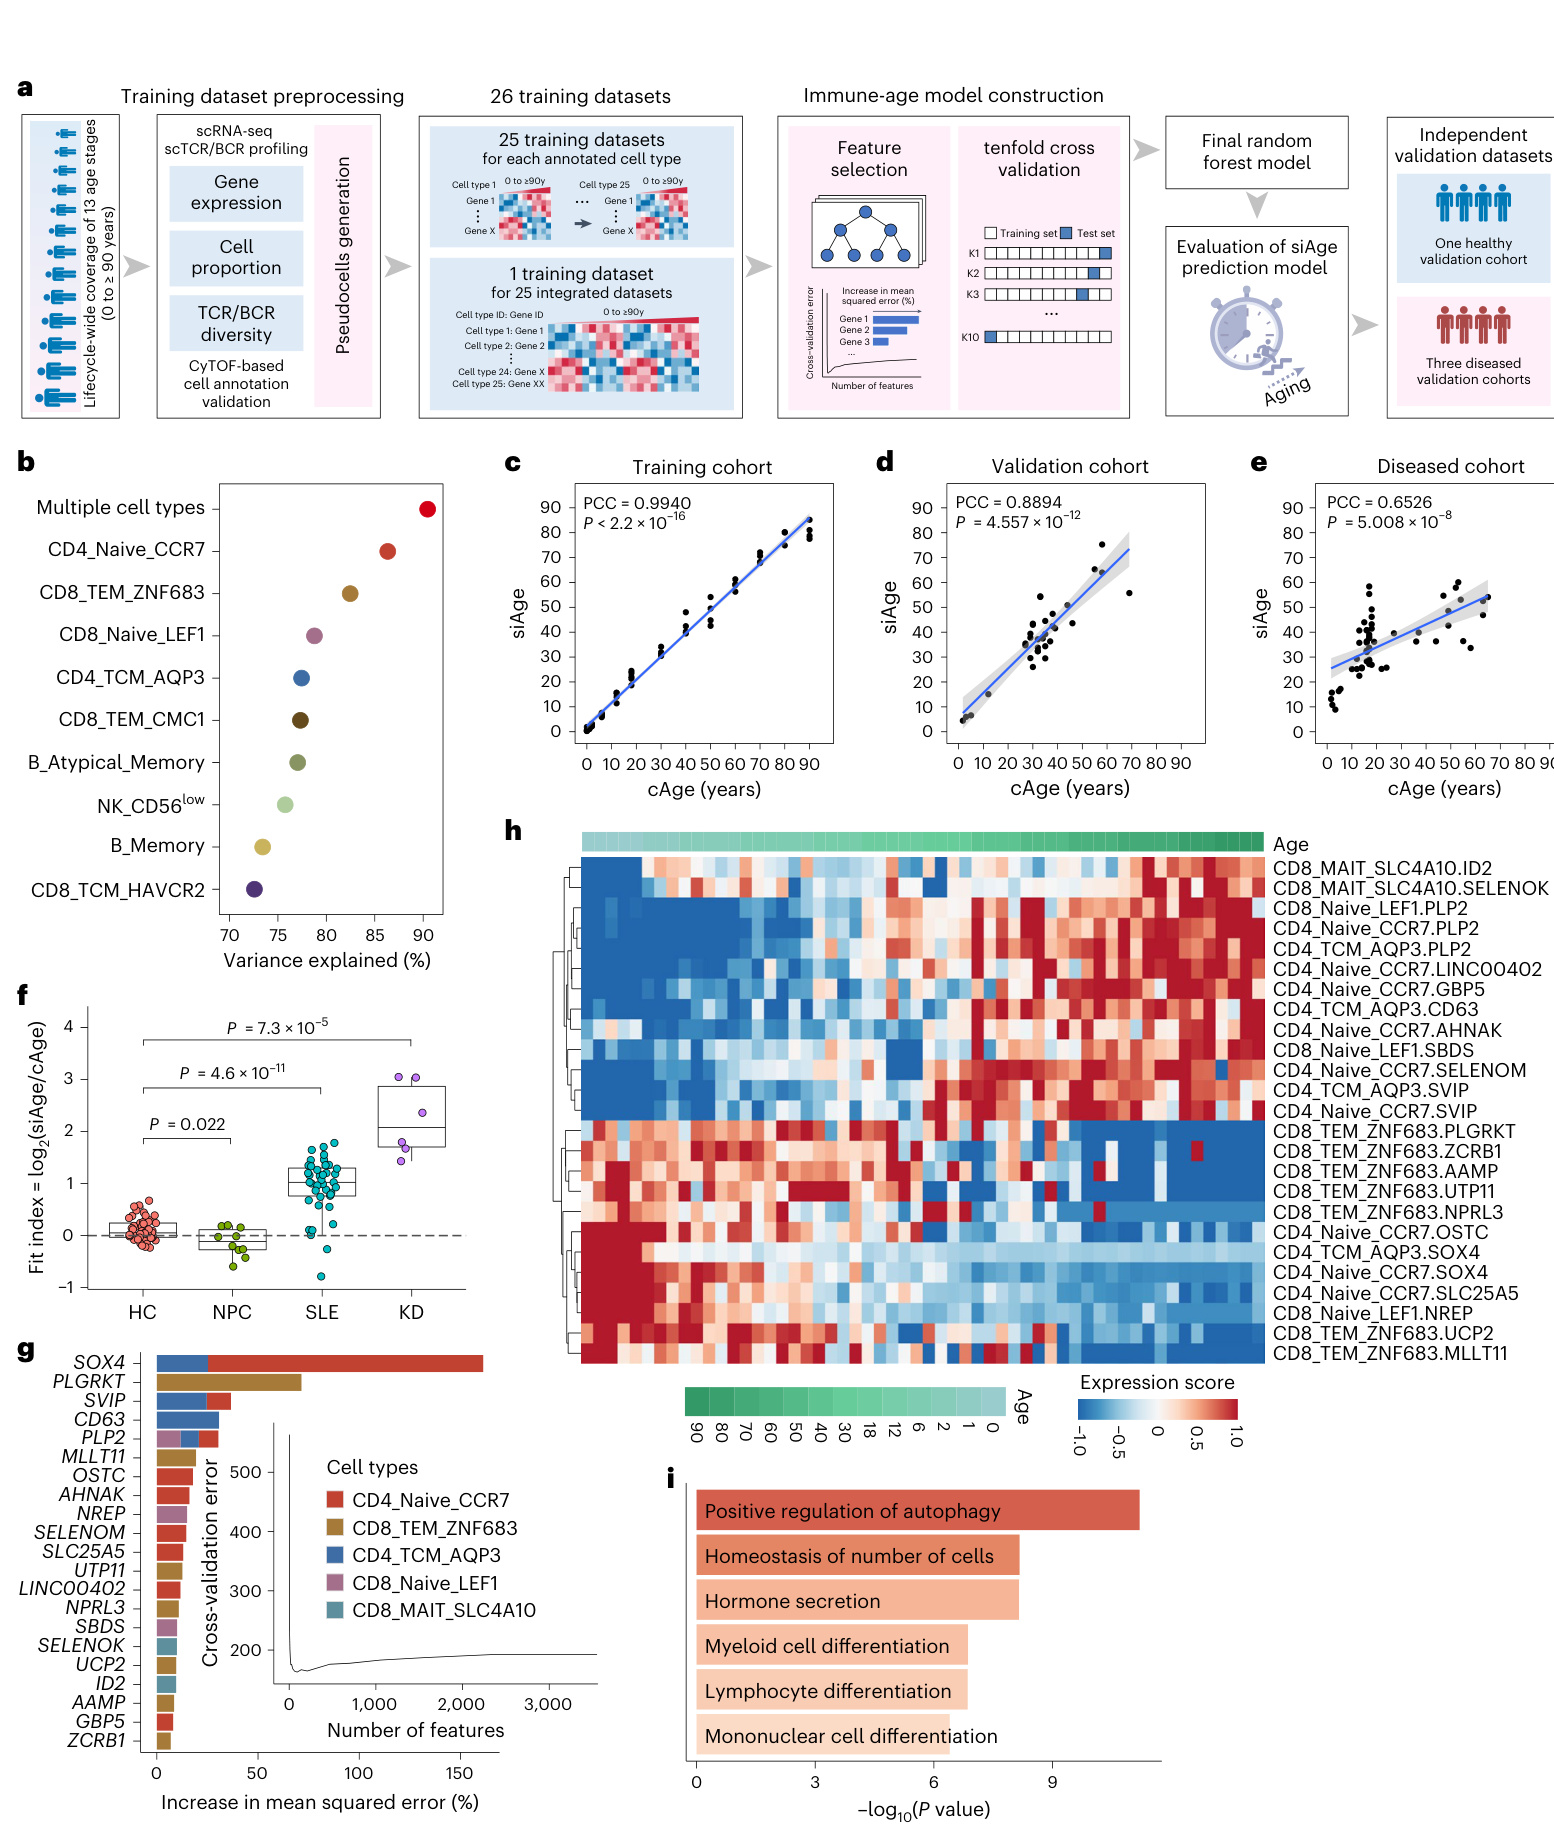
The aging immune system contributes to the morbidity and mortality of the elderly'. One significant obstacle in understanding immune system alterations involves the precise quant if i cation of aging20.52. Our unique lifecycle-wide single-cell data provided an opportunity to construct a single-cell immune age clock model (that is, siAge score) to quantify an individual's immune age and describe their immune status (Fig. 7a). We first built 25 models with data from just one cell subset and another model incorporating all cell subsets. The prediction model integrating all 25 cell subset datasets had the highest predictive score and achieved the best performance (Pearson's correlation coefficient $\left(\mathrm{PCC}\right)=0.9940$ $P<2.2\times10^{-16},$ among the 26 prediction models (Fig. 7b,c and Supplementary Fig. 4a) and was chosen as the final siAge prediction model.
衰老的免疫系统是导致老年人发病和死亡的重要因素之一。理解免疫系统变化的一个主要障碍在于如何精确量化衰老过程[20,52]。我们独特的全生命周期单细胞数据为构建单细胞免疫年龄时钟模型(即siAge评分)提供了机会,该模型可用于量化个体免疫年龄并描述其免疫状态(图7a)。我们首先利用单一细胞亚群数据构建了25个模型,另整合所有细胞亚群数据构建了一个综合模型。在26个预测模型中,整合全部25个细胞亚群数据集的预测模型具有最高的预测评分和最佳性能(Pearson相关系数$\left(\mathrm{PCC}\right)=0.9940$,$P<2.2\times10^{-16}$)(图7b、c和补充图4a),因此被选为最终的siAge预测模型。
Tofurther validate the prediction capability ofthe siAge prediction model, we measured the prediction model efficacy with scRNA-seq data using several independent validation cohorts (detailed in Methods). In the healthy validation cohort (33 individuals),there was a strong positive correlation between chronological age (cAge) and siAge $(\mathrm{PCC}=0.8894,P=4.557\times10^{-12})$ (Fig. 7d), indicating that the siAge prediction model achieved good performance in healthy individuals. However, in the validation cohort with a compromised immune function (56 PBMC samples), the correlation between cAge and siAge became weaker $\left(\mathrm{PCC}=0.6526\right)$ $P=5.008\times10^{-8})$ (Fig. 7e and Supplementary Fig.4b). The disrupted correlation between the cAge and siAge scores in the diseased indicated the potential ability of our prediction model to present the disrupted immune homeostasis in individuals with immune-related diseases. To better assess the predictive ability of the si Age model,we defined a fit index that was calculated from the ratio between siAge and cAge and used it toevaluate the deviations in siAge and cAge between healthy subjects and patients with a disturbed immune function. Our findings highlight that the siAge prediction model, driven by 21 keygenes across T cell subsets,serves as a potential marker to access immune system status and aging-associated changes across the human lifespan (Fig. 7f-i, detailed in Supplementary Information Section1.4).
为了进一步验证siAge预测模型的预测能力,我们使用多个独立验证队列(方法部分详述)通过单细胞RNA测序(scRNA-seq)数据评估了预测模型效能。在健康验证队列(33名个体)中,实际年龄(cAge)与siAge呈强正相关 $(\mathrm{PCC}=0.8894,P=4.557\times10^{-12})$ (图7d),表明该预测模型在健康人群中表现良好。然而在免疫功能受损的验证队列(56个PBMC样本)中,cAge与siAge的相关性减弱 $\left(\mathrm{PCC}=0.6526\right)$ $P=5.008\times10^{-8})$ (图7e和补充图4b)。疾病状态下cAge与siAge评分的相关性破坏,提示我们的预测模型可能具备反映免疫相关疾病个体免疫稳态失衡的能力。为更好评估siAge模型的预测能力,我们定义了拟合指数(siAge与cAge的比值)来评估健康受试者与免疫功能紊乱患者间的siAge-cAge偏差。研究结果表明,基于T细胞亚群21个关键基因构建的siAge预测模型,可作为评估人类生命周期中免疫系统状态和衰老相关变化的潜在标志物(图7f-i,详见补充信息章节1.4)。
Fig. 7|Construction ofthe single-cell immune age prediction model based on lifecycle-wide single-cell data. a, Workflow of the single-cellimmune age prediction model construction.b, Dot plot showing the predictive performance of the cell-type-specific immune age prediction models based on our lifecyclewidesingle-celldata.The top ten cell types with the highest scores are shown. c,Scatter plot showingthe correlation of single-cell immune age (siAge) with chronological age (cAge)inthe training set( $\scriptstyle n=56$ samples).d,Scatter plot showingthe correlation of siAge with cAge in the external healthy validation cohort $\scriptstyle{n=33}$ samples).e,Scatter plot showing the correlation of siAge with cAge in the external validation cohort of diseased patients with disturbed immune functions $\scriptstyle n=56$ samples).f,Box plot comparing the fit index distribution calculated by the si Age model in the healthy validation cohort withthose ofthe diseased validation cohorts,which includeNPC $\bf\Delta n=10$ samples),SLE( $\mathit{\Omega}_{n=40}$ samples)and KD( $n=6$ samples) cohorts.Box plots show median,first (lower
图 7: 基于全生命周期单细胞数据的单细胞免疫年龄预测模型构建。a, 单细胞免疫年龄预测模型构建流程。b, 点图展示基于我们全生命周期单细胞数据的细胞类型特异性免疫年龄预测模型的预测性能,显示了得分最高的前十种细胞类型。c, 散点图展示训练集中单细胞免疫年龄 (siAge) 与实际年龄 (cAge) 的相关性 (n=56 样本)。d, 散点图展示外部健康验证队列中 siAge 与 cAge 的相关性 (n=33 样本)。e, 散点图展示免疫功能紊乱疾病患者外部验证队列中 siAge 与 cAge 的相关性 (n=56 样本)。f, 箱线图比较健康验证队列与疾病验证队列 (包括 NPC (n=10 样本)、SLE (n=40 样本) 和 KD (n=6 样本) 队列) 中 siAge 模型计算的拟合指数分布,箱线图显示中位数、第一
Discussion
讨论
Our data represent a resource to simultaneously encompass both single-cell transcriptional and protein-level changes of human peripheral immune cells across the entire human lifespan, with the largest age range to date (13 age groups, ranging from age 0 to over 90 years). Using this unique resource, the current study provides important insights into the age-specific alterations in cell-type composition, transcription and protein profiles, CCls and immune repertoires of PBMCs over the lifespan at a fine temporal and single-cell resolution. Several important observations were made(Extended DataFig.10). First, the T cell subsets were the most susceptible to aging among all PBMCs and were characterized by increased pro-inflammatory pathways, reduced telomere organization and markedly altered immune checkpoints. Second, scRNA-seq and immune repertoire sequencing revealed unique age-specific transcriptional and clonal expansion featuresofT cell subsets:(1)high T cell cl on al expansions exhibited peaks at both ends of life:the early life developmental stage (2-12 years old) and the late-life elderly stage (70-90 years old); (2) naive $\mathrm{CD4^{+}}$ andnaive $\mathbf{CD8^{+}}$ T cells exhibited distinct aging-associated cell compositions, transcriptional patterns and repertoire dynamics from birth; and (3) CD 8 MA IT S LC 4 A 10 cells exhibited peak abundance and clonal diversity during adolescence, with greater antimicrobial ability than those in other age groups. The findings from scRNA-seq-based and scTCR/ BCR-seq-based analyses were further recapitulated by high-throughput CyTOF-based protein profiling. Importantly, we described a newly identified and unique'cytotoxic' B cell subset( $\mathbf{B_BCR^{+}G N L Y^{+}}$ cells) that simultaneously expressed BCR genes and cytotoxic genes and was enriched in children. Using this single-cell lifecycle-wide dataset, we developed an immune age prediction model (siAge score) that enabled the identification of a disturbed immune state. Overall, our work provides fine temporal resolution of peripheral immune cell transcriptomes and immune repertoires during development, maturation and senescence in humans across the entire lifespan and will facilitate in-depth exploration ofthe immune system at each age stage.
我们的数据资源首次实现了对人类外周免疫细胞在整个生命周期(迄今最大年龄跨度:13个年龄组,0岁至90岁以上)单细胞转录组与蛋白质组变化的同步覆盖。基于这一独特资源,本研究以精细时间分辨率和单细胞精度揭示了PBMC在生命周期中细胞类型组成、转录与蛋白特征、细胞周期及免疫库的年龄特异性变化,获得多项重要发现(扩展数据图10)。首先,T细胞亚群是所有PBMC中对衰老最敏感的群体,表现为促炎通路激活、端粒组织功能减退和免疫检查点显著改变。其次,单细胞RNA测序(scRNA-seq)与免疫库测序共同揭示了T细胞亚群特有的年龄依赖性转录特征与克隆扩增模式:(1)高克隆扩增T细胞在生命两端(幼儿发育期2-12岁与老年期70-90岁)呈现双峰分布;(2)初始型$\mathrm{CD4^{+}}$与$\mathbf{CD8^{+}}$T细胞从出生起就展现出截然不同的衰老相关细胞组成、转录模式及受体库动态;(3)CD8+ MAIT SLAMF7+细胞在青春期达到丰度与克隆多样性峰值,其抗菌能力显著高于其他年龄段。基于质谱流式(CyTOF)的高通量蛋白质组分析进一步验证了上述发现。值得注意的是,我们发现了一个同时表达BCR基因与细胞毒性基因的新型"细胞毒性"B细胞亚群($\mathbf{B_BCR^{+}GNLY^{+}}$细胞),该群体在儿童期显著富集。利用这一全生命周期单细胞数据集,我们开发了可识别免疫紊乱状态的免疫年龄预测模型(siAge评分)。本研究首次绘制了人类发育、成熟与衰老过程中外周免疫细胞转录组与免疫库的精细时间图谱,为深入探索各年龄段免疫系统特征提供了重要基础。
The immune system is immature at birth and gradually develops under postnatal environmental stimuli 3.Maternally derived antibodies taper off in the infant's circulation and are almost completely lost by 1 year after birth54.5, whereas self-derived immune mediators-such as T cells from the thymus, and B cells and innate immune cells from the bone marrow-augment over time?°, accompanied by external stimula tion including routine immunization and environmental microbe and food antigen exposures. Immunoglobulins in infants increase progressively and reach normal adult levels at age 5-9 years57.5s During this critical developmental period, children are more vulnerable to infectious diseases59.Wefound that certain cell subsets exhibited enrichment in certain age categories during development, including $\mathbf{CD14}^{+}$ monocytes in neonates and plasma cells in children.Importantly, we identified a unique'cytotoxic' B cell type (B_BCR+GNLY+ cells) that expanded significantly in children from 2to12 yearsold, with a peak in 6-year-olds. Given its low proportion in other age groups, it may have been overlooked in previous single-cell studies that did notexamine all hinge)andthird(upperhinge)quartiles;whiskers show $1.5\times$ the interquartile range. $P$ values were determined by two-sided unpaired Wilcox on rank-sum test.g,Bar plot showing the top 21 key genes identified by random forest regression. The genes are ranked in descending order of importance with respect to the accuracy ofthe model. The insert represents a tenfold cross-validation error as a function of the numberof input features used toregress against the chronological ages.h, Heatmap showing the row-scaled expression ofthe top 21key genes across age in corresponding cell subsets.i,Bar plot showing functional enrichment of the top 21 key genes. $P$ values were determined by hyper geometric test. Inc-e,the blue line indicates linear regression; PCC and $P$ values are indicated.The gray shadow covers the $95%$ confidence interval.In c-f $P<0.05$ was considered statistically significant.KD,Kawasaki diseases;NPC, na so pharyngeal carcinoma; SLE,systemic lupus erythematosus.
免疫系统在出生时尚未成熟,会随着出生后环境刺激逐步发育。母源抗体在婴儿血液循环中逐渐衰减,出生后54.5周时几乎完全消失,而自体免疫介质——如胸腺来源的T细胞、骨髓来源的B细胞与先天免疫细胞——会随时间推移逐渐增多,这一过程还伴随着常规免疫接种、环境微生物及食物抗原等外部刺激。婴儿免疫球蛋白水平持续上升,至5-9岁时达到正常成人水平。在这个关键发育期,儿童更易感染疾病。我们发现特定细胞亚群在发育过程中呈现年龄特异性富集,包括新生儿期的CD14+单核细胞与儿童期的浆细胞。值得注意的是,我们鉴定出一种独特的"细胞毒性"B细胞类型(B_BCR+GNLY+细胞),该细胞在2-12岁儿童中显著扩增,6岁时达到峰值。鉴于其在其他年龄组占比极低,过往未覆盖全年龄段的单细胞研究可能忽略了该细胞类型。
(箱线图元素说明:箱体表示四分位距,中线标记中位数,须线展示1.5倍四分位距。P值通过双样本Wilcoxon秩和检验获得)
g. 条形图展示随机森林回归模型识别的前21个关键基因,按模型精度重要性降序排列。插图显示十折交叉验证误差随输入特征数量的变化趋势。
h. 热图呈现前21个关键基因在各年龄组对应细胞亚群中的标准化表达水平。
i. 条形图展示前21个关键基因的功能富集分析结果(P值通过超几何检验计算)。
(图注说明:c-e图中蓝线表示线性回归,标注PCC与P值;灰色阴影为95%置信区间。c-f图中P<0.05视为具有统计学显著性。缩写说明:KD-川崎病;NPC-鼻咽癌;SLE-系统性红斑狼疮)
age categories or perform scBCR-seq analyses.B_BCR'GNLYt cells are characterized by the simultaneous expression of BCR genes and cytotoxic genes,such as GNLYand NKG7.Traditionally,B cells are thought to be immune cell populations incapable of cytotoxic functions.However, recent studies have reported a'cytotoxic' phenotype of B cell subsets expressing cytotoxic genes in diseased populations 51,60-62. The enrichment of the B ${\tt B C R^{+}G N L Y^{+}}$ cells with cytotoxic signatures before adolescence may represent a potential mechanism for protection against infection before immune maturation. The detailed biological functions of B_BCR+GNLY+ cells require further investigation (detailed in Supplementary Information Section 2.1).
B_BCR+GNLY+细胞的特征是同时表达BCR基因和细胞毒性基因,如GNLY和NKG7。传统上认为B细胞是不具备细胞毒性功能的免疫细胞群体。然而,最近的研究报道了在疾病人群中表达细胞毒性基因的B细胞亚群具有"细胞毒性"表型[51,60-62]。青春期前具有细胞毒性特征的B${\tt B C R^{+}G N L Y^{+}}$细胞富集,可能代表了免疫成熟前抵御感染的潜在机制。B_BCR+GNLY+细胞的具体生物学功能需要进一步研究(详见补充信息第2.1节)。
The immune system undergoes dramatic changes during and after adolescence and sexual maturity63,64. Both our scRNA-seq and CyTOF analyses showed that MAIT cells were enriched during adolescence, with a peak in the 18-year-old group, and MAIT cells in adolescents possessed higher TCR diversity and stronger antimicrobial effector function than in other age groups. MAlT cells are a unique T cell type that bridge innate and adaptive immunity44. The involvement of MAlT cells in a large spectrum of pathological conditions makes them attractive therapeutic targets+'.Commensal bacteria mediate MAIT cell maturation and re circulation into the thymus65. The dramatic hormonal changes that occur during adolescence lead to alteration ofthe mucosal membrane micro environment and variation in commensal bacterial species and numbers°, which may account for the MAIT cell expansion during the period of adolescence seen in our study. However, a systematic understanding of the peripheral circulating MA iT cells in healthy individuals across the life course was lacking at a single-cell resolution. Our findings delineate the potential functional significance of MAIT cells during adolescence by characterizing the transcript ome and immune repertoire of this cell type across the lifespan. The observed transcript omi c and expansion features and antimicrobial activities of MAIT cells during adolescence may represent a key component of immune maturation and competence for protection against infection.
免疫系统在青春期及性成熟期间和之后会发生显著变化[63,64]。我们的单细胞RNA测序(scRNA-seq)和质谱流式(CyTOF)分析均显示,MAIT细胞在青春期富集,并在18岁年龄组达到峰值,且青少年期的MAIT细胞比其他年龄组具有更高的TCR多样性和更强的抗菌效应功能。MAIT细胞是连接先天免疫与适应性免疫的特殊T细胞类型[44]。由于MAIT细胞参与多种病理过程,使其成为极具吸引力的治疗靶点。共生菌群介导MAIT细胞的成熟并促进其再循环至胸腺[65]。青春期发生的剧烈激素变化会导致黏膜微环境改变及共生菌种类与数量的变化,这可能是本研究中观察到的青春期MAIT细胞扩增的原因。然而,此前缺乏从单细胞分辨率系统理解健康个体外周循环MAIT细胞在整个生命历程中的变化。我们的研究通过表征MAIT细胞在整个生命周期的转录组和免疫组库,揭示了该细胞类型在青春期的潜在功能意义。观察到的青春期MAIT细胞转录组特征、扩增现象及抗菌活性,可能代表着免疫成熟和抗感染能力发展的关键组成部分。
Immune function declines with aging, termed 'immuno sen escence. However, different types of immune cells display differential susceptibility to aging. In line with a mouse aging study showing that T cells exhibited a more vulnerable phenotype to senescence than other immune cells°, our results in humans revealed that the functions of T cell subsets were the most susceptible to aging among all PBMCs across the entire lifespan. Previous studies on the adult population (25-88 years old) have concluded that cytotoxic T cells $(\mathbf{CD8}^{+})$ ,compared to helper T cells $(\mathbf{CD4}^{+})$ ,show a more pronounced decline with age36. However, with our full lifespan coverage, we found the aging trajectories of $\mathbf{CD4^{+}}$ and $\mathbf{CD8^{+}}$ T cells to diverge beginning at birth, based on both scRNA-seq and CyTOF analyses. During the early life developmental stage, naive $\mathbf{CD4}^{+}$ cells declined more rapidly than naive $\mathbf{CD8^{+}}$ cells, whereas during later life, naive $\mathbf{CD8^{+}}$ cells exhibited more drastic attrition than naive $\mathbf{CD4}^{+}$ cells in terms of frequency and TCR diversity. The collapse of TCR diversity in naive T cells has been considered a strong predictor of poor health in older people67. Our scRNA-seq dataset, covering each age category from birth to old age, revealed, at the single-cell level, the differential dynamics of the alteration of T CR diversity in naive $\mathrm{CD4^{+}}$ T cells and naive $\mathbf{CD8}^{+}$ T cells in both early and late life.
免疫功能随衰老而下降,称为"免疫衰老"。然而,不同类型的免疫细胞对衰老表现出不同的易感性。与小鼠衰老研究显示T细胞比其他免疫细胞表现出更易衰老的表型一致,我们在人类中的研究结果表明,在整个生命周期中,T细胞亚群的功能在所有外周血单个核细胞(PBMCs)中对衰老最为敏感。先前针对成人群体(25-88岁)的研究得出结论,与辅助性T细胞(CD4+)相比,细胞毒性T细胞(CD8+)随年龄增长表现出更明显的下降[36]。但通过我们覆盖全生命周期的研究发现,基于单细胞RNA测序(scRNA-seq)和质谱流式(CyTOF)分析,CD4+和CD8+T细胞的衰老轨迹从出生起就开始分化。在生命早期发育阶段,初始CD4+细胞比初始CD8+细胞下降更快,而在生命后期,就频率和TCR多样性而言,初始CD8+细胞比初始CD4+细胞表现出更剧烈的耗竭。初始T细胞中TCR多样性的崩溃被认为是老年人健康状况不佳的强预测指标[67]。我们的scRNA-seq数据集覆盖了从出生到老年的每个年龄阶段,在单细胞水平揭示了生命早期和晚期初始CD4+T细胞与初始CD8+T细胞在TCR多样性改变方面的差异动态。
Age-dependent changes in the immune response are the most obvious at the extremes of age, with immune malfunction or dysregulation occurring during the early life development and the late-life elderly stages56. Previous studies that were limited tothe adult population have shown elevated T cell clonal expansion only in elderly ages36. However, taking advantage ofour lifecycle-wide cohort from birth to old age, we revealed that high T cell clonal expansions actually exhibited two peaks at the extremes ofthe lifespan, with an early peak in the 2-12-year-old group and a late peak in the 70-90-year-old group. Our results provide insights into the similarities and differences in T cell functions between two age groups, representing immune development and immune aging, respectively (detailed in Supplementary Information Section 2.2). The human lifespan has increased in recent decades, which raises major health issues related to many age-associated path o logie s. Using our lifecycle-wide single-cell dataset covering 13 age groups over the extent of the human lifespan, we established a comprehensive cross-age index (siAge score) as a type of machine-learning-based immune aging clock to evaluate an individual's immune status across different life stages. We demonstrated that the siAge score is highly correlated with the calendar age in healthy individuals but not in those with disturbed immune functions in multiple diseased validation cohorts. Thus, our siAge model holds the potential to effectively quantify a person's immune status and distinguish a healthy individual from one with an unhealthy immune state. It has been transformed into user-friendly software (https://pu-lab.sjtu.edu.cn/shiny/lifespan), making it easily accessible to end users.Further research is needed to validate the generalization of our findings (detailed in Supplementary Information Section 2.3).
免疫反应的年龄依赖性变化在生命两端最为显著,表现为生命早期发育阶段和老年阶段的免疫功能障碍或失调[56]。既往局限于成年人群的研究仅发现老年群体存在T细胞克隆扩增水平升高[36]。但借助我们覆盖从出生到老年全生命周期的队列,我们首次揭示高T细胞克隆扩增实际上在生命两端呈现双峰分布:早期高峰出现在2-12岁组,晚期高峰出现在70-90岁组。该结果揭示了分别代表免疫发育和免疫衰老的两个年龄组在T细胞功能上的异同(详见补充信息第2.2节)。
近几十年来人类寿命的延长带来了诸多年龄相关疾病的重大健康挑战。基于覆盖人类生命周期13个年龄组的单细胞数据集,我们建立了一个综合性跨年龄指标(siAge评分),作为基于机器学习(machine learning)的免疫衰老时钟,用于评估个体不同生命阶段的免疫状态。我们在多个疾病验证队列中证实,siAge评分与健康个体的实际年龄高度相关,但在免疫功能紊乱的个体中无此相关性。因此,siAge模型有望量化个体免疫状态并区分健康与非健康免疫状态。该模型已转化为用户友好型软件(https://pu-lab.sjtu.edu.cn/shiny/lifespan)供终端用户使用。未来需进一步研究验证本发现的普适性(详见补充信息第2.3节)。
Online content
在线内容
Any methods, additional references, Nature Portfolio reporting summaries, source data, extended data, supplementary information, acknowledgements,peer review information; details of author contributions and competing interests; and statements of data and code availability are available at https://doi.0rg/10.1038/s41590-024-02059-6.
任何方法、补充参考文献、《自然》系列期刊报告摘要、源数据、扩展数据、补充信息、致谢、同行评审信息、作者贡献与利益竞争详情、以及数据和代码可用性声明,请访问 https://doi.0rg/10.1038/s41590-024-02059-6 获取。
References
参考文献
Publisher's note Springer Nature remains neutral with regard to jurisdictional claims in published maps and institutional affiliations.
出版方声明:施普林格·自然对出版地图和机构附属关系中的管辖权主张保持中立。
OpenAccess This article is licensed under a Creative Commons Attribution-NonCommercial-No Derivatives 4.0 International License, which permits any non-commercial use, sharing, distribution and reproduction in any medium or format, as long as you give appropriate credit to the original author(s) and the source, provide a link to the Creative Commons licence, and indicate if you modified the licensed material.You do not have permission under this licence to share
开放获取 本文遵循知识共享署名-非商业性使用-禁止演绎 4.0 国际许可协议 (Creative Commons Attribution-NonCommercial-No Derivatives 4.0 International License)。该协议允许在任何媒介或格式中进行非商业性使用、共享、分发和复制,但须满足以下条件:注明原作者及来源、提供知识共享许可协议链接,并说明是否对授权材料进行了修改。本许可协议不允许共享演绎作品。
adapted material derived from this article or parts of it. The images or other third party material in this article are included in the article's Creative Commons licence, unless indicated otherwise in a credit line to the material. If material is not included in the article's Creative Commons licence and your intended use is not permitted by statutory regulation or exceeds the permitted use, you will need to obtain permission directly from the copyright holder.To view a copy of this licence, visit http://creative commons.org/licenses/by-nc-nd/4.0/.
本文改编自该文章或其部分内容。除非在材料署名中另有说明,否则本文中的图片或其他第三方材料均包含在文章的 Creative Commons 许可中。如果材料未包含在文章的 Creative Commons 许可中,且您的预期用途未经法定许可或超出允许范围,您需要直接获得版权持有者的授权。要查看该许可的副本,请访问 http://creativecommons.org/licenses/by-nc-nd/4.0/。
$\circledcirc$ The Author(s) 2025
$\circledcirc$ 作者 2025
Methods
方法
Participants and ethics
参与者和伦理规范
All human samples were obtained in accordance with protocols approved by the Institutional Review Board at Shanghai Jiao Tong University.All donors were enrolled with approval by the Ethics Committee of RenJi Hospital (KY2019-136),School of Medicine, Shanghai Jiao Tong University. After providing written informed consent in accordance with the criteria set by the Declaration of Helsinki (2013)68, 220 healthy volunteers agedOto ${\ge}90$ years were recruited from Shanghai Pudong Cohort (NC T 05206643), including 61 healthy participants aged 0 to $\scriptstyle\geq90$ years for scRNA and scTCR/scBCR sequencing; 7O healthy partic i pants age dO to $\scriptstyle\geq90$ years for independent CyTOF-based single-cell protein validation experiments; 34 healthy participants aged 0 to ${\ge}90$ years for independent bulk RNA-seq validation experiments; and 55 healthy participants aged 2-72 yearsfor validation experiments. The inclusion and exclusion criteria for participants in this study is provided in Supplementary Information Section 3. The participants spanned the entire lifespan, partitioned into 13 age groups (0-,1-,2-,6-,12-,18-,30-, 40-,50-,60-,70-,80-and over 90-year-olds). Toyield more biologically meaningful results, when performing statistical testing to determine the differences among groups,participants were categorized into eight life stages as suggested by developmental biologists 22-24 as follows: O years old, newborn (umbilical cord blood); 1-2 years old, toddler; 6-8 years old, childhood; 12-18 years old, adolescent; 30-40 years old, young adult, 50-60 years old, middle-aged adult; 70-80 years old, elderly; and over 90 years old, elderly-plus.
所有人体样本的获取均遵循上海交通大学机构审查委员会批准的实验方案。捐赠者入组经上海交通大学医学院附属仁济医院伦理委员会审批通过(KY2019-136)。根据《赫尔辛基宣言》(2013)[68]标准签署书面知情同意书后,从上海浦东队列(NCT05206643)招募了220名0岁至${\ge}90$岁的健康志愿者,包括:61名0-$\scriptstyle\geq90$岁健康参与者用于单细胞RNA测序(scRNA)及单细胞TCR/BCR测序(scTCR/scBCR);70名0-$\scriptstyle\geq90$岁健康参与者用于基于质谱流式(CyTOF)的单细胞蛋白质独立验证实验;34名0-${\ge}90$岁健康参与者用于批量RNA测序(bulk RNA-seq)独立验证实验;55名2-72岁健康参与者用于验证实验。本研究受试者纳入与排除标准详见补充信息第3节。参与者覆盖全生命周期,划分为13个年龄组(0岁、1岁、2岁、6岁、12岁、18岁、30岁、40岁、50岁、60岁、70岁、80岁及90岁以上)。为获得更具生物学意义的结果,在进行组间差异统计检验时,参照发育生物学家建议[22-24]将参与者分为八个生命阶段:0岁新生儿(脐带血)、1-2岁幼儿、6-8岁儿童、12-18岁青少年、30-40岁青年、50-60岁中年、70-80岁老年及90岁以上高龄老年。
Single-cell RNA-seq library preparation and sequencing
单细胞RNA测序文库制备与测序
To produce single-cell gel beads in emulsion, cell suspensions were quantified with 400-600 living cellsper determined by a Countstar automated cell counter.A Chromium single-cell controller $^{10\times}$ Genomics) was used to prepare cell suspensions as gel beads in emulsion, with a Single Cell $5^{\prime}$ Library and Gel Bead kit (1000006, $^{10\times}$ Genomics) and Chromium Single Cell A Chip kit (120236, $^{10\times}$ Genomics) following the manufacturer's protocols.Approximately 15,0oo cells were added to each channeland the recovered target cells were estimated to be approximately 8,ooO cells.scRNA-seq libraries were constructed using the Chromium Single Cell $5^{\prime}$ v.1.1 Reagent (HumanTCell,1000005;HumanB Cell,1000016; $^{10\times}$ Genomics), and a unique sample index was included in each sequencing library. Finally, sequencing was performed with a sequencing depth of at least 100,000 reads per cell with a paired-end 150 bp reading strategy using the Ilumina platform (CapitalBio Technology).
为制备单细胞乳液凝胶珠,使用Countstar自动细胞计数器对细胞悬液进行定量,确保每微升含有400-600个活细胞。采用Chromium单细胞控制器(10× Genomics)将细胞悬液制备为乳液凝胶珠,过程中使用Single Cell 5′ Library and Gel Bead试剂盒(1000006,10× Genomics)和Chromium Single Cell A Chip试剂盒(120236,10× Genomics),严格遵循制造商的操作流程。每个通道约加入15,000个细胞,预计回收目标细胞数约为8,000个。利用Chromium Single Cell 5′ v.1.1试剂(Human T Cell,1000005;Human B Cell,1000016;10× Genomics)构建scRNA-seq文库,每个测序文库均包含独特的样本索引。最终,在Ilumina平台(CapitalBio Technology)上采用双端150 bp读长策略进行测序,确保每个细胞至少获得100,000条reads的测序深度。
scRNA-seq data processing
scRNA-seq 数据处理
Cell Ranger (v.3.0.2) was used to align readsto reference(GRCh38-3.0.0) and generate feature-barcode matrices from the Chromium s cRNA-seq output.Filtering stepsfor high-quality single cells included removal of doublets using Scrub let"(doublet rate $=0.075$ ,doublet Score $<0.25,$ cells expressing ${<}400$ genes, cells with $>2{,}500$ detected genes and cells with a mitochondrial gene count percentage of ${\tt>}10%$ Genes appearing in lessthan three cellswere also excluded.
使用Cell Ranger (v.3.0.2)将测序读数比对至参考基因组(GRCh38-3.0.0),并从Chromium单细胞RNA测序输出中生成特征-条形码矩阵。高质量单细胞的筛选步骤包括:使用Scrublet去除双联体(双联体率=0.075,双联体评分<0.25),剔除表达基因数<400的细胞、检测基因数>2,500的细胞,以及线粒体基因占比>10%的细胞。同时排除在少于三个细胞中出现的基因。
Based on the clean scRNA-seq data after quality control, gene expression profiles were normalized for eachcell using the Log Normalize method with the Seurat NormalizeD at a function. The Find Variable Features function was then applied toidentify the highly variable genes using the default parameters. Next, we scaled the data using the ScaleData function and performed principal component analysis on the scaled data using the RunPCA function with default parameters. The s cV lln te g ration algorithm was used for batch correction?°. We constructed a shared nearest neighbor graph using the FindNeighbors function and clustered cells using the Louvain algorithm with the Find Clusters function based on the s cV lln te g ration reduction. Finally,the Run U MAP function facilitated the visualization of all cells. A total of 538,266 high-quality cells were derived from 61 samples.
基于质量控制后的洁净单细胞RNA测序(scRNA-seq)数据,我们使用Seurat包中的NormalizeData函数,采用Log Normalize方法对每个细胞的基因表达谱进行归一化处理。随后运用FindVariableFeatures函数,通过默认参数识别高变基因。接着使用ScaleData函数对数据进行标准化,并采用RunPCA函数以默认参数对标准化后的数据执行主成分分析。批次校正采用s cV lln te g ration算法[20]。基于s cV lln te g ration降维结果,我们通过FindNeighbors函数构建共享最近邻图,并利用FindClusters函数结合Louvain算法进行细胞聚类。最终通过RunUMAP函数实现所有细胞的可视化。从61个样本中共获得538,266个高质量细胞。
Cell-type annotation and cluster marker identification
细胞类型注释与聚类标记识别
The Find All Markers function was used to find marker genes for each cluster.Clusters were then classified and annotated based on the marker gene expression of each cell subset. We used a two-round hierarchical approach to cluster and annotate the cells71.72. In brief, the first round of clustering (resolution, 0.8) identified 11 major cell types, including $\mathbf{CD4^{+}}$ Tcells, $\mathrm{CD}8^{+}$ T cells, y T cells, NK cells, B cells, plasma cells, $\mathbf{CD14}^{+}$ monocytes, $\mathtt{C D16}^{+}$ monocytes,monocyte-derived dendritic cells, plasma cyto id dendritic cells and mega kary o cyte s. In round two, cells from these major types were subset out and the whole integration and clustering process was applied to them separately. The second round of clustering(resolution,0.3-1.2)resulted in 25 distinct cell subsets(shown in Fig.1b and Extended Data Fig.1a-d).Single cells expressing twosets of well-studied canonical markers of major cell types were labeled as doublets and excluded from subsequent analyses.Afulllist of canonical and signature genes foreach subset is shown in Supplementary Table 3.
使用Find All Markers功能寻找每个细胞簇的标记基因。随后基于各细胞亚群的标记基因表达对细胞簇进行分类和注释。我们采用两轮分层策略进行细胞聚类与注释[71][72]。简而言之,第一轮聚类(分辨率0.8)鉴定出11种主要细胞类型,包括$\mathbf{CD4^{+}}$T细胞、$\mathrm{CD}8^{+}$T细胞、γT细胞、NK细胞、B细胞、浆细胞、$\mathbf{CD14}^{+}$单核细胞、$\mathtt{C D16}^{+}$单核细胞、单核细胞来源的树突状细胞、浆细胞样树突状细胞及巨核细胞。第二轮分析中,将这些主要类型的细胞亚群分离后分别进行整合与聚类流程。第二轮聚类(分辨率0.3-1.2)最终得到25个独特细胞亚群(如图1b和扩展数据图1a-d所示)。对同时表达两类典型标记基因的单细胞判定为双联体并排除在后续分析外。各亚群的规范标记基因与特征基因完整列表见补充表3。
CyTOF sample processing and data acquisition
CyTOF样本处理与数据采集
Cry o preserved PBMC samples were rapidly thawed ina $37^{\circ}\mathrm{C}$ waterbath within 2 min.PBMCs were collected by cent ri fuga tion and cell precipitates were re suspended with PBs.A Count star automated cell counter was used tocount thecell numbers,and TrypanBlue was used to verify the viability ofthe PBMCs. The adequacy of PBMC quantity and quality for subsequent analyses was assessed based on the following criteria: thecell numberper ${<}3\times10^{6}$ and the viability per sample of $>90%$
冷冻保存的PBMC样本在37°C水浴中快速解冻,时间控制在2分钟内。通过离心收集PBMC细胞,沉淀物用PBS重悬。使用Count Star自动细胞计数仪统计细胞数量,并用台盼蓝(Trypan Blue)验证PBMC活性。根据以下标准评估PBMC数量与质量是否满足后续分析要求:每份样本细胞数<3×10^6且活细胞率>90%。
The total amounts of 41 metal-conjugated antibodies used for CyTOF in this study are listed in Supplementary Table 4.Following sample collection, protein-free PBS was used to wash the samples. Then, PBMCs were stained with cisplatin (Fluidigm) to exclude dead cells. To minimize non specific staining, PBMCs were incubated with Fc blocking solution at $4^{\circ}\mathrm{C}$ for 30 min. Staining medium containing cell-surface antibodies was then applied to stain the PBMCs in PBS containing $5%$ goat serum and $30%$ BSAfor 30 min at $4^{\circ}\mathrm{C}$ Then,PBMCs were fixed and permeated overnight using a per me abi liz ation kit (e Bioscience). Next, PBMCs were washed with perm buffer (e Bioscience) and stained with intracellular antibodies in per me abi liz ation buffer for $30\mathsf{m i n}$ at ${4^{\circ}}\mathrm{C}$ .PB MCs were washed twice andre suspended with double distilled water for data acquisition. Before each batch of samples was loaded,the signal strengthof each channel was adjusted for the instrument according to the same beads signal (140Ce, 151Eu, 153Eu, 165Ho and 175Lu). The data were acquired using the Helio3 CyTOF Mass Cyto meter(Fluidigm).
本研究用于CyTOF的41种金属标记抗体总量列于补充表4。样本采集后,用无蛋白PBS洗涤样本,随后用顺铂(Fluidigm)染色PBMC以排除死细胞。为减少非特异性染色,PBMC在$4^{\circ}\mathrm{C}$下用Fc封闭液孵育30分钟。接着用含细胞表面抗体的染色培养基(含$5%$山羊血清和$30%$BSA的PBS)在$4^{\circ}\mathrm{C}$染色PBMC 30分钟。之后使用透膜试剂盒(e Bioscience)对PBMC进行固定和过夜透膜处理。随后用透膜缓冲液(e Bioscience)洗涤PBMC,并在透膜缓冲液中用胞内抗体于${4^{\circ}}\mathrm{C}$染色$30\mathsf{min}$。PBMC经两次洗涤后重悬于双蒸水以待数据采集。每批样本上机前,根据标准微球信号(140Ce、151Eu、153Eu、165Ho和175Lu)调整各通道仪器信号强度。数据使用Helio3 CyTOF质谱流式细胞仪(Fluidigm)采集。
CyTOF data analyses
CyTOF数据分析
Data of each sample were de-barcoded from the raw data using a doublet-filtering scheme with unique mass-tagged barcodes. Each'.fcs' file generated from different batches was normalized using the bead normalization method. We used FlowJo software (v.10.8.1) to exclude debris, dead cells and doublets from the data using step-by-step manual gating, leaving only live single immune cells for subsequent analyses. After strict data cleaning and quality control, atotalof10,887,899 single immune cells were obtained for the subsequent analyses. Clean CyTOF data were processed using the R package cyto f Work flow (v.1.14.0). The X-shift clustering algorithm was used on all cells to partition the cells into distinct phenotypes based on marker expression levels and then each cell cluster was annotated according to its marker expression pattern based on a heatmap of clusters and markers. The dimensional reduction algorithm U MAP was used to visualize the high-dimensional data in two dimensions, including the clustering of the cells and the distribution ofthe marker genes in different clusters or groups of cells. For both marker expression and cell proportion of the annotated cell populations, their dynamic profiles with age were fitted by generalized LOESS regression. The Spearman correlation coefficient and significance were also calculated from the cor.test function in the stats package.APvalueof ${<}0.05$ was considered statistically significant.
每个样本的数据通过使用带有独特质量标签条形码的双联体过滤方案从原始数据中解条形码。不同批次生成的每个'.fcs'文件均采用微球归一化方法进行标准化。我们使用FlowJo软件(v.10.8.1)通过逐步手动设门排除碎片、死细胞和双联体,仅保留活体单免疫细胞用于后续分析。经过严格的数据清洗和质量控制,最终获得10,887,899个单免疫细胞用于后续分析。清洁的CyTOF数据使用R包cytofWorkflow(v.1.14.0)进行处理。采用X-shift聚类算法根据标记物表达水平将所有细胞划分为不同表型,随后基于聚类与标记物的热图,根据各细胞簇的标记物表达模式进行注释。降维算法UMAP用于将高维数据可视化呈现为二维分布,包括细胞聚类结构以及标记基因在不同细胞簇或细胞群中的分布特征。对于已注释细胞群体的标记物表达和细胞比例,其随年龄变化的动态特征通过广义LOESS回归进行拟合。Spearman相关系数及显著性通过stats包中的cor.test函数计算,统计显著性阈值设定为${<}0.05$。
Bulk RNA-seq library preparation and sequencing
批量RNA测序文库制备与测序
Bulk RNA-seq was performed on PBMCs obtained from an independent cohort of 34 healthy individuals (0 to ${\tt>}90$ years old). Total RNA was extracted using Trizol reagent (Invitrogen) following the manufacturer's procedure. The RNA amount and purity of each sample were quantified using Nano Drop 2000 with $\mathrm{}_{260/280}=1.6$ -1.8.RNA integrity was assessed by Agilent 2100 (Agilent Technologies).All samples had a RIN number of ${>}7.0$ .RNA-seq libraries were prepared following the manufacturer's instructions, and sequencing was performed on an Illumina NovaSeq 60oo(CFBiotech) following the vendor's recommended protocol.
对34名健康个体(0至${\tt>}90$岁)的独立队列外周血单个核细胞(PBMCs)进行了批量RNA测序。使用Trizol试剂(Invitrogen)按制造商流程提取总RNA,采用Nano Drop 2000检测样本RNA含量和纯度($\mathrm{}_{260/280}=1.6$-1.8),通过Agilent 2100(Agilent Technologies)评估RNA完整性,所有样本RIN值均${>}7.0$。按制造商说明制备RNA-seq文库后,使用Illumina NovaSeq 6000(CFBiotech)按供应商推荐方案进行测序。
Bulk RNA-seq data analyses
批量RNA测序数据分析
Quality control of the raw reads was performed by Trim moma tic $(\mathbf{v}.0.39)^{73}$ software. Then, the sequencing read quality was verified using FastQC (v.0.11.9) (http://www.bioinformatics.babraham.ac.uk/ projects/fastqc,2010).Raw readswere processed withfastp $(\mathbf{v.0.22.0})^{74}$ Fastq files were aligned to the human genome (GRCh38) using HISAT2 $(\mathbf{v}.2.1.0)^{75}$ . Counts of reads and fragments per kilobase of exon per million (FPKM) were calculated using StringTie $(\mathbf{v}.2.1.3\mathbf{b})^{76}$ .Linear regression fitting was used to evaluate the correlation between age and the FPKM of each gene through the Im function. The R package stats was used to calculate Spearman's correlation coefficient and $P$ value. Age-related genes were further determined using Spearman rho analyses $(|\rho|\ge0.5,P<0.01)$
原始读数的质量控制由Trim momatic $(\mathbf{v}.0.39)^{73}$ 软件完成。随后,使用FastQC (v.0.11.9) (http://www.bioinformatics.babraham.ac.uk/projects/fastqc,2010) 验证测序读数质量。原始读数通过fastp $(\mathbf{v.0.22.0})^{74}$ 进行处理,Fastq文件通过HISAT2 $(\mathbf{v}.2.1.0)^{75}$ 比对至人类基因组(GRCh38)。使用StringTie $(\mathbf{v}.2.1.3\mathbf{b})^{76}$ 计算每百万外显子千碱基的读数及片段数(FPKM)。通过Im函数采用线性回归拟合评估年龄与各基因FPKM的相关性,R包stats用于计算Spearman相关系数及$P$值。年龄相关基因进一步通过Spearman rho分析确定$(|\rho|\ge0.5,P<0.01)$。
TCR and BCR repertoire sequencing and analyses
TCR和BCR组库测序与分析
The scTCR and scBCR repertoire libraries of all samples( $10\times$ Genomics) were prepared and profiled with paired-end sequencing $(2\times150$ bp) on the Illumina HiSeq2500 platform. The Cell Ranger V(D)J pipeline $(10\times$ Genomics, v.3.0.2) was used to mark the TCR and BC R expression and clonal types. The TCR and BCR repertoire sequencing data were filtered with the following criteria: productive is "True"; high_ confidence is"True";umis ${}^{21}$ and raw consensus id isnot"None".OnlyT cells with at least oneTCR -chain and one TCR -chainwere used to identify the TCR clonotypes for each T cell. If two or more TCR chains or chains were assembled in a given T cell, the highest expressed (UMI or reads) TCR chain or -chain was defined as the dominant TCR chain or TCR -chain. A clonotype was defined by a unique TCR α(s)-TCR β(s) pair (CDR3 nucleotide sequences and rearranged VJ genes included) within a T cell. BCR clonotypes were identified ina similar wayto T CR clo no types.Inbrief, only B cells with at least one productive heavy chain (IGH) and one productive light chain (IGL or IGK) were retained for further analyses. Each unique IGH and IGL/ IGK pair within a B cell was defined as a BCR clonotype. If there were two or more IGH and IGL/IGK assembled in a given B cell, the highest expressed IGH and IGL/IGK chain was regarded as the dominant IGH and IGL/IGK chain.
所有样本的scTCR和scBCR库($10\times$ Genomics)均采用Illumina HiSeq2500平台进行配对末端测序($2\times150$ bp)制备和分析。使用Cell Ranger V(D)J流程($10\times$ Genomics, v.3.0.2)标记TCR和BCR表达及克隆类型。TCR和BCR测序数据按以下标准过滤:productive为"True";high_confidence为"True";umis${}^{21}$且raw consensus id非"None"。仅保留至少含一条TCR链和一条TCR链的T细胞用于鉴定各T细胞的TCR克隆型。若单个T细胞中组装了两条及以上TCR链或链,则UMI或reads表达量最高的链被定义为主导TCR链或TCR链。克隆型由T细胞内唯一的TCRα(s)-TCRβ(s)配对(含CDR3核苷酸序列及重排VJ基因)定义。BCR克隆型鉴定方式与TCR类似:仅保留至少含一条有效重链(IGH)和一条有效轻链(IGL或IGK)的B细胞进行分析,将B细胞内每对独特的IGH与IGL/IGK配对定义为BCR克隆型。若单个B细胞中组装了两组及以上IGH和IGL/IGK,则表达量最高的IGH和IGL/IGK链视为主导链。
For CDR3 amino acid length analyses,filtered TCR chainsand chains were separately calculated with nchar, as.dat.frame, unlist, table, sum and round functions. For the TCR clonal status analyses, as.dat.frame, unlist and table functions were used to calculate clonotype counts of filtered cells. Cells expressing the same clonotype were counted.The counts were classified into eight classes to identify the cellular cl on al expansion status; ${\tt>}100$ ,51-100,31-50,21-30,11-20, 6-10,2-5 and a unique clone without expansion.
对于CDR3氨基酸长度分析,使用nchar、as.dat.frame、unlist、table、sum和round函数分别计算过滤后的TCR 链和 链。在TCR克隆状态分析中,通过as.dat.frame、unlist和table函数计算过滤细胞的克隆型计数。表达相同克隆型的细胞被计数,并按八级分类法标识细胞克隆扩增状态:${\tt>}100$、51-100、31-50、21-30、11-20、6-10、2-5以及未扩增的单一克隆。
From barcode mapping, clonaltype information from Cell Ranger V(D)j was integrated into the metadata ofthe Seurat object forfurther analysis. Shannon's entropy, inverse Simpson's index and the Chaol index were used to estimate the diversity, species abundance and richness of TCR repertories, respectively 7.
通过条形码映射,将Cell Ranger V(D)J的克隆型信息整合到Seurat对象的元数据中以进行进一步分析。分别采用香农熵(Shannon's entropy)、逆辛普森指数(inverse Simpson's index)和Chaol指数来评估TCR库的多样性、物种丰度和丰富度[7]。
Shannon's entropy was measured using the function $H$ ofthe DescTools (v.0.99.54) package as follows:
使用DescTools包(v.0.99.54)中的函数$H$测量香农熵(Shannon's entropy),具体如下:
$$
H=-\sum_{x}p(x)\times\log_{2}(p(x))
$$
$$
H=-\sum_{x}p(x)\times\log_{2}(p(x))
$$
Here, the frequency of a given TCR clone in all T cellswith TCR identified is represented as $p(x)$ . Changes in clone diversity with age were fitted by LOESS regression. The Spearman correlation coefficient and significance were also calculated from thecor.test function inthe stats package. $P<0.05$ was considered statistically significant.
此处,给定TCR克隆在所有已识别TCR的 T细胞中的频率表示为$p(x)$。克隆多样性随年龄的变化通过LOESS回归拟合。Spearman相关系数和显著性通过stats包中的cor.test函数计算。$P<0.05$被认为具有统计学意义。
Inverse Simpson's index was used for calculating the species abundance ofthe TCR repertoire 36.The calculation of this index was calculated by the rep Diversity function ofthe immunarch (v.1.o.o) package:
采用逆辛普森指数 (Inverse Simpson's index) 计算TCR受体库的物种丰度[36]。该指数通过immunarch (v.1.0.0) 包的repDiversity函数进行计算:
$$
\frac{1}{\lambda}=\frac{1}{\sum_{i=1}^{N}p_{i}^{2}}
$$
$$
\frac{1}{\lambda}=\frac{1}{\sum_{i=1}^{N}p_{i}^{2}}
$$
where i represents each TCR sequence, $N$ represents the number of TCR sequences for a given sample, $p_{i}$ represents theUMI percentage occupancy for a TCR (UMI count ofTCR divided by total UMI counts) and A represents Simpson'sindex.
其中,i 代表每个 TCR 序列,$N$ 代表给定样本的 TCR 序列数量,$p_{i}$ 代表 TCR 的 UMI 百分比占有率 (TCR 的 UMI 计数除以总 UMI 计数),A 代表辛普森指数。
The Ch aol indexof T CR repertoires was calculated by there p Diversity function in the immunarch (v.1.0.0) package, following the formula:
TCR谱系的Chao1指数通过immunarch (v.1.0.0)包中的repDiversity函数计算,公式如下:
$$
{\mathrm{Chao1}}=S+{\frac{F_{1}\times(F_{1}-1)}{2\times(F_{2}+1)}}
$$
$$
{\mathrm{Chao1}}=S+{\frac{F_{1}\times(F_{1}-1)}{2\times(F_{2}+1)}}
$$
where S represents TCR repertoire richness, that is, the total number of unique TCR clonotypes for a given sample, $F_{1}$ is the number of TCR clo no types that counted 1 and $F_{2}$ isthe number of T CR clo no types that counted2.
其中S表示TCR库丰富度,即给定样本中独特TCR克隆型的总数,$F_{1}$是计数为1的TCR克隆型数量,$F_{2}$是计数为2的TCR克隆型数量。
Human B cell isolation and purification
人B细胞分离与纯化
Human PBMCs were separated from whole blood samples using Vacutainer CPT tubes (362761, BD) following the manufacturer's protocols 7 s. B cells were isolated from PBMCs using the Human Pan B Cell Isolation Kit(130-101-638,Mil ten y iBi otec)following the manufacturer's instructions. The purity of B cells was confirmed by flow cytometry $(>95%$ purity).Human B cells were cultured and expanded in ImmunoCult HumanB Cell Expansion Kit (100-0645,STEMCELL Technologies) for further use.
人外周血单个核细胞 (PBMC) 按照制造商说明书使用Vacutainer CPT采血管 (362761, BD) 从全血样本中分离。B细胞通过Human Pan B Cell Isolation Kit (130-101-638, Miltenyi Biotec) 从PBMC中分选,分选纯度经流式细胞术验证 $(>95%$ 纯度)。人B细胞使用ImmunoCult Human B Cell Expansion Kit (100-0645, STEMCELL Technologies) 进行培养扩增以供后续实验。
Construction of single-cell immune age prediction model
单细胞免疫年龄预测模型的构建
An age-prediction model for evaluating immune homeostasis at single-cell resolution (siAge) was constructed using DEGs in each cell subset as independent variables. The scRNA-seq dataset, including 13 age groups across the entire lifespan from neonates to nonagenarians, was used as the training set.First, all cell-type-specific DEGs in the training set were used to generate valuable feature variables based on the random forest model through the random Forest (v.4.7-1.1) package79. To examine the contributions of different cell subsets to the performance ofage prediction, we trained 26 random-forest-based regression models80.81 to predict immune age, including 25 cell-type-specific prediction models trained using their corresponding 25 cell-type-specific datasets and one prediction model using integrated data from all 25 cell-type-specific training datasets. $K$ foldcross-validation with $\mathbf{cv}=10$ was used to improve the generalization ability of gene feature selection through the rfcv function. After sorting the importance of multiple variables with IncMSE, the top 21 key genes (visualized through the pheatmap function) were selected to construct the siAge prediction model using the random forest algorithm through the random Forest R package.
利用各细胞亚群中的差异表达基因(DEGs)作为自变量,构建了用于评估单细胞分辨率下免疫稳态的年龄预测模型(siAge)。该模型以包含从新生儿到90岁老人共13个年龄组的单细胞RNA测序(scRNA-seq)数据集作为训练集。首先,通过randomForest(v.4.7-1.1)软件包79,基于随机森林模型从训练集中所有细胞类型特异性DEGs生成有价值的特征变量。为评估不同细胞亚群对年龄预测性能的贡献,我们训练了26个基于随机森林的回归模型80.81来预测免疫年龄,其中包括使用25个细胞类型特异性数据集训练的对应预测模型,以及一个整合所有25个细胞类型训练数据的综合预测模型。采用$K$折交叉验证($\mathbf{cv}=10$)通过rfcv函数提升基因特征选择的泛化能力。在通过IncMSE排序多变量重要性后,筛选出前21个关键基因(通过pheatmap函数可视化),并利用randomForest R包中的随机森林算法构建siAge预测模型。
Next, to test the generalization ability of the siAge prediction model,we conducted a comprehensive search in the Gene Expression Omnibus database and the Genome Sequence Archive of the Beijing Institute of Genomics DataCenter of data up to 30 May 2022.Acombination ofthe following keywords was used:'single-cell'sequencing'or 'scRNA-sequencing'or'single cell'and'peripheral blood mono nuclear cells' or PBMCs'. The inclusion criteria for the published scRNA-seq datasets were as follows: gene expression profiling of human PBMCs by $^{10\times}$ Genomics s cRNA-seq,detailed information on the age of part icipants,fresh PBMC samplesand informed consent from authorsfor raw data.Weobtained 77 P BMC samples from published available studies (3,531 published datasets)withscRNA-seqdata and detailed in formation on the age of participants, including 21 PBMC samples from healthy volunteers aged1.7-58 years (GSE158055 (ref. 71), GSE168732 (ref. 82) and HRA000150 (ref.83)) and 56 PBMC samples from patients aged1.6-65 years,including ten PBMC samples from na so pharyngeal carcinoma patients aged 22-65 years (GSE162025 (ref. 84)), six PBMC samples from Kawasaki disease patients aged 1.6-5.4 years (GSE168732 (ref. 82)) and 40 PBMC samples from systemic lupus erythematosus patients aged 10-63 years (GSE135779 (ref. 8)). Detailed information of all datasets used are shown in Supplementary Table 2. A total of 12 healthy participants aged 12-39 years were recruited from the Shanghai Pudong Cohort. Linear regression fitting was used to evaluate the correlation between the cAge and our siAge through the Im function. The $\mathrm{PCC}^{85}$ and $P$ value were calculated through the cor.test function in the stats package. $P<0.05$ was considered statistically significant. We defined a fit index to evaluate the deviations between siAge and cAge in healthy individuals and patients with a disturbed immune function. The fit index was calculated following the equation:
接下来,为测试siAge预测模型的泛化能力,我们在基因表达综合数据库(Gene Expression Omnibus)和北京基因组研究所基因组序列存档中心(Genome Sequence Archive)中全面检索了截至2022年5月30日的数据。使用以下关键词组合进行检索:"单细胞测序"或"scRNA测序"或"单细胞"与"外周血单个核细胞"或"PBMCs"。已发表scRNA-seq数据集的纳入标准包括:通过10× Genomics单细胞RNA测序获得的人类PBMCs基因表达谱、详细的参与者年龄信息、新鲜PBMC样本以及作者提供的原始数据使用授权。我们从已发表研究中获取了77个PBMC样本(涉及3,531个已发表数据集),这些样本具有scRNA-seq数据和详细的参与者年龄信息,包括:21个来自1.7-58岁健康志愿者的PBMC样本(GSE158055(参考文献71)、GSE168732(参考文献82)和HRA000150(参考文献83));56个来自1.6-65岁患者的PBMC样本,其中包含22-65岁鼻咽癌患者的10个样本(GSE162025(参考文献84))、1.6-5.4岁川崎病患者的6个样本(GSE168732(参考文献82))以及10-63岁系统性红斑狼疮患者的40个样本(GSE135779(参考文献8))。所有使用数据集的详细信息见补充表2。此外,我们从上海浦东队列中招募了12名12-39岁的健康参与者。通过lm函数进行线性回归拟合来评估实际年龄(cAge)与siAge的相关性,使用stats包中的cor.test函数计算PCC85和P值。P<0.05被认为具有统计学显著性。我们定义了一个拟合指数来评估健康个体与免疫功能紊乱患者的siAge与cAge之间的偏差,该指数计算公式为:
$$
\mathrm{Fit{index}}=\log_{2}{\frac{\mathrm{siAge}}{\mathrm{cAge}}}
$$
$$
\mathrm{Fit{index}}=\log_{2}{\frac{\mathrm{siAge}}{\mathrm{cAge}}}
$$
Statistical analyses
统计分析
Statistical analyses were performed using R software (v.4.3.0). The Wilcoxon rank-sum test was used to examine the difference between two groups. The Kruskal-Wallis test was used to determine whether or not there was a statistically significant difference among three or more age groups. The significant differences in cell subset proportions, gene expression and CCls among all age groups were determined by KruskalWallis tests followed by Dunnett's post hoc test, and the $P$ valueswere adjusted with FDR in multiple comparisons. The statistical significance of the differences was determined by two-sided unpaired Wilcoxon rank-sum tests for node degree and average shortest path length of immune checkpoints and non-immune checkpoints, as well as the fit indexof siAge ofthe healthy cohort and the cohort with diseases. The dynamic profiles of variables (that is, cell subset proportions, gene expression, TCR diversity and STARTRAC expansion score) with age were fitted by generalized LOESS regression, and associations between age and these variables were tested using a Spearman's correlation test. The Pvalue significance thresholds used for each result are described in the corresponding methods and figure legends. For other comparisons, the name and type ofthe statistical test are stated inthe figure legends.
统计分析使用R软件(v.4.3.0)进行。Wilcoxon秩和检验用于检验两组间的差异。Kruskal-Wallis检验用于判断三个或更多年龄组间是否存在统计学显著差异。所有年龄组间细胞亚群比例、基因表达和CCls的显著差异通过Kruskal-Wallis检验结合Dunnett事后检验确定,多重比较中的$P$值经FDR校正。免疫检查点与非免疫检查点的节点度数和平均最短路径长度差异,以及健康队列与疾病队列的siAge拟合指数差异,均采用双侧非配对Wilcoxon秩和检验评估统计学显著性。变量(即细胞亚群比例、基因表达、TCR多样性和STARTRAC扩增分数)随年龄变化的动态特征通过广义LOESS回归拟合,年龄与这些变量的关联性采用Spearman相关性检验。各项结果所用的$P$值显著性阈值见相应方法和图注说明。其他比较的统计检验名称和类型均在图注中注明。
Reporting summary
报告摘要
Further information on research design is available in the Nature Portfolio Reporting Summary linked to this article.
有关研究设计的更多信息,请参阅本文链接的《自然》期刊报告摘要。
Data availability
数据可用性
The raw scRNA-sequencing data reported in this study are availablefrom the Genome Sequence Archive for Human under accession number HRA009014. The processed gene expression of scRNA-seq data (Seurat object RDS file), the expression profiles of bulk RNA-seq data and CyTOF single-cell protein datawere uploaded into the SYNAPSE database (https://www.synapse.org) under accession numbers syn61609846, syn61853526 and syn61765870, respectively.The machine-learning-based immune age prediction framework has been made publicly available on the online website (https://pu-lab.sjtu. edu.cn/shiny/siage-model). Source data are provided with this paper.
本研究中报告的原始单细胞RNA测序数据可在人类基因组序列存档中获取,登录号为HRA009014。处理后的单细胞RNA测序基因表达数据(Seurat对象RDS文件)、批量RNA测序数据表达谱和CyTOF单细胞蛋白质数据已分别上传至SYNAPSE数据库(https://www.synapse.org),登录号为syn61609846、syn61853526和syn61765870。基于机器学习的免疫年龄预测框架已在在线网站(https://pu-lab.sjtu.edu.cn/shiny/siage-model)公开提供。本文随附源数据。
Code availability
代码可用性
The source code of the model is available on GitHub (https://github. com/shanzha9/siAgeModel.git). The codes described in the Methods
该模型的源代码可在GitHub上获取 (https://github.com/shanzha9/siAgeModel.git)。方法部分描述的代码
or other methods used in our study are publicly available upon request to the corresponding author.
本研究中所用的方法或其他资料可根据需求向通讯作者索取。
References
参考文献
Acknowledgements
致谢
We thank the volunteers from the Shanghai Pudong Cohort for their contribution to the study. This work was supported by grants from the Non communicable Chronic Diseases-National Science and Technology Major Project (2023 ZD 0503204 to J.P.), Innovative Research Group Project of China'sNational Natural Science Foundation(82421001 to J.P.),the National Natural Science Foundation of China (82230014 to J.P., 81930007 to J.P., 823B2005 to Y.C. and 32100426 to R.L.); National Science Fund for Distinguished Young Scholars (81625002 to J.P.); Shanghai Municipality Science and Technology Commission (22 JC 1402100 to J.P., 22 DZ 2292400 to J.P. and 21 Y F 1445000 to R.L.); Shanghai Municipal Health Commission (2022JC013,2023ZZ02021, 2022ZZ01008 and GWVI-11.1-26 toJ.P.); Shanghai Municipal Education Commission (SHSMU-ZD CX 20210700 to J.P.); and the Postdoctoral Fellowship Program of the China Postdoctoral Science Foundation(2023TQ0219,GZ B 20230434 and 2024 M 752015 to T.C.). We thank Z. Zhang, L.-S. Yeap, C.Huang and L. Guan Ng for their helpful discussions and Z. Yu, B. Kang and L. Zheng for their statistical and technical assistance.
我们感谢上海浦东队列的志愿者对本研究的贡献。本研究获得了以下资助:国家重点研发计划慢性非传染性疾病防控专项(2023ZD0503204 致 J.P.)、国家自然科学基金创新研究群体项目(82421001 致 J.P.)、国家自然科学基金(82230014 致 J.P.、81930007 致 J.P.、823B2005 致 Y.C. 和 32100426 致 R.L.);国家杰出青年科学基金(81625002 致 J.P.);上海市科学技术委员会(22JC1402100 致 J.P.、22DZ2292400 致 J.P. 和 21YF1445000 致 R.L.);上海市卫生健康委员会(2022JC013、2023ZZ02021、2022ZZ01008 和 GWVI-11.1-26 致 J.P.);上海市教育委员会(SHSMU-ZDCX20210700 致 J.P.);中国博士后科学基金博士后创新人才支持计划(2023TQ0219、GZB20230434 和 2024M752015 致 T.C.)。我们感谢 Z. Zhang、L.-S. Yeap、C. Huang 和 L. Guan Ng 的有益讨论,以及 Z. Yu、B. Kang 和 L. Zheng 的统计与技术协助。
Author contributions
作者贡献
J.P. conceived the study. Y.W., R.T. and Z.L. recruited volunteers. Y.W., R.T., Z.L. and M.S. collected samples from donors. R.T., T.C. and M.S. completed the experiments. R.L., Y.W., R.T., L.L. and L. Wei performed the data analyses. R.T., R.L. and Y.W. drafted the initial version of the manuscript. Y.W., Y.Z., C.Z. and Y.C. proofed the manuscript. J.P., B.S., L. Wang, F.W., W.L., B.L., L.C., J.L., A.F.C., K.Q. and H.C. provided guidance and constructive comments for the final version. All the authors read and approved the manuscript.
J.P. 负责课题设计。Y.W.、R.T. 和 Z.L. 负责志愿者招募。Y.W.、R.T.、Z.L. 和 M.S. 完成供体样本采集。R.T.、T.C. 与 M.S. 完成实验操作。R.L.、Y.W.、R.T.、L.L. 和 L. Wei 进行数据分析。R.T.、R.L. 和 Y.W. 撰写论文初稿。Y.W.、Y.Z.、C.Z. 和 Y.C. 负责文稿校对。J.P.、B.S.、L. Wang、F.W.、W.L.、B.L.、L.C.、J.L.、A.F.C.、K.Q. 和 H.C. 对终版论文提出指导与建设性意见。全体作者阅读并认可最终稿件。
Competing interests
利益竞争
The authors declare no competing interests.
作者声明无利益冲突。
Additional information
附加信息
Extended data is available for this paper at https://doi.0rg/10.1038/s41590-024-02059-6.
本论文的扩展数据可在 https://doi.0rg/10.1038/s41590-024-02059-6 获取。
Supplementary information The online version contains supplementary material available at https://doi.0rg/10.1038/s41590-024-02059-6.
补充信息 在线版本包含补充材料,可访问 https://doi.0rg/10.1038/s41590-024-02059-6 获取。
Correspondence and requests for materials shouldbe addressed to JunPu.
材料和通信请求请发送至JunPu。
Peer review information Nature Immunology thanks the anonymous reviewers for their contribution to the peer reviewof thiswork. Primary Handling Editor: S. Houston, in collaboration with the Nature Immunology team.
同行评审信息
《自然·免疫学》感谢匿名审稿人对本项工作同行评审的贡献。责任主编:S. Houston,与《自然·免疫学》团队共同完成。
Reprints and permissions information is available at www.nature.com/reprints.
转载和许可信息请访问 www.nature.com/reprints。

signature genes of25 peripheral immune cell subsets covering 13 age groups. a. UMAP plots showing the 25 peripheral immune cell subsets covering13 age groups across the entire lifespan. Cell subsets are indicated in different colors. b. UMAPplots showing the distribution of expression of selected signature genes for 25 cell subsets.c. UMAP plots showing the distribution of expression distribution of expression of selected signature genes for 25 cell subsets. e.Violin plots showing the distribution of UMl counts (left panel)andgene counts (right panel) per cell type.B_BCR+GNLY*cells are circled with dashed circlein(a)and(b).
覆盖13个年龄段的25种外周免疫细胞亚群特征基因
a. UMAP图展示贯穿整个生命周期的13个年龄段25种外周免疫细胞亚群分布,不同颜色代表不同细胞亚群
b. UMAP图展示25种细胞亚群选定特征基因的表达分布
c. UMAP图展示25种细胞亚群选定特征基因的表达量分布
e. 小提琴图展示各细胞类型的UMI计数分布(左图)与基因计数分布(右图)。B_BCR+GNLY*细胞在(a)和(b)中用虚线圆圈标出

Extended Data Fig. 2|See next page for caption.
扩展数据图 2|说明见下页。
Extended Data Fig.2|Validation of cell annotation derived from s cRNAseq data by CyTO F,Azimuth,andGSEA.a.U MAP of integrated CyTO F data of peripheral immune cell subsets identified within the PBMCs.b. Heatmap showingthe relative mean cluster gene and protein expressions in major immune celltypes from scRNA-seq (left panel) and CyTOF (right panel) analyses, respectively.c.Heat map showing the correlation between s cRNA-seq-derived major cell types and CyTOF-derived majorcell types,computed from expression of scRNA-seq variable genes and corresponding CyTOF protein markers.d.UMAP ofT cell subsets identified in the integrated CyTOF data.e.Heatmap showing the relative mean cluster gene and protein expressions in T cell subsets from
扩展数据图 2| 通过CyTOF、Azimuth和GSEA验证源自scRNAseq数据的细胞注释。a. PBMC中鉴定的外周免疫细胞亚群整合CyTOF数据的UMAP图。b. 热图分别显示scRNA-seq(左图)和CyTOF(右图)分析中主要免疫细胞类型的相对平均簇基因和蛋白表达。c. 热图显示基于scRNA-seq可变基因和相应CyTOF蛋白标记物表达计算的scRNA-seq衍生主要细胞类型与CyTOF衍生主要细胞类型之间的相关性。d. 整合CyTOF数据中鉴定的T细胞亚群UMAP图。e. 热图显示来自T细胞亚群的相对平均簇基因和蛋白表达
scRNA-seq (left panel) and CyTOF (right panel) analyses, respectively.f. Heatmap showing the correlation between the scRNA-seq-derived T cell subsets and the CyTOF-derived T cell subsets,computed from expression of s cRNA-seq variable genes and corresponding CyTOF protein markers.g. Heatmap showing strong consistency ofour cell annotations based on scRNA-seq and cell annotations predicted bythe automated annotation tool,Azimuth.h.GSEA plots showing immunological signature gene sets enriched by the marker genes of each T cell subset, illustrating that our categorization ofT cells based on scRNA-seq aligned with established findings.
单细胞RNA测序 (scRNA-seq) (左图) 和飞行时间质谱流式 (CyTOF) (右图) 分析结果。
f. 热图显示scRNA-seq鉴定的T细胞亚群与CyTOF鉴定的T细胞亚群之间的相关性,该相关性基于scRNA-seq可变基因表达量及对应CyTOF蛋白标志物计算得出。
g. 热图显示基于scRNA-seq的细胞注释与自动化注释工具Azimuth预测结果具有高度一致性。
h. 基因集富集分析 (GSEA) 图谱显示各T细胞亚群标志基因显著富集的免疫特征基因集,证实基于scRNA-seq的T细胞分类与已有研究发现一致。

Extended Data Fig.3|Cell composition dynamics of25 peripheral immune cell subsets across 13 age groups. a. Stacked bar graph showing the average proportion of each cellsubset within total PBMCs based on scRNA-seq analyses across13 age groups.b-d.Scatter plots showing the correlation between age and the proportion of eachcell subset based on the scRNA-seq analyses in Fig.1d. (b) Cell subsets significantly positively correlated with age,(c) cell subsets significantly negatively correlated with age,(d) cell subsets enriched in certain age groups.e-g. Scatter plots showing the correlation between age and the proportion of each cell subset based on theCyTOF analyses.(e)Cell subsets significantly positively correlated with age,(f)cell subsets significantly negatively correlated with age, (g) cell subsets enriched in certain age groups. In boxplots b-g,median(center line),first and third quartiles(box),and extra $1.5\times$ inter guar tile ranges(whiskers)are shown.Inb,c,e,and f,Spearman correlation coefficient $\rho$ and P values are indicated.APvalue $<0.05$ was considered statistically significant.
扩展数据图 3 | 13个年龄组中25种外周免疫细胞亚群的组成动态。a. 基于单细胞RNA测序分析的堆叠条形图,显示各年龄组PBMC中每个细胞亚群的平均比例。b-d. 散点图展示基于图1d单细胞RNA测序分析的年龄与各细胞亚群比例相关性:(b) 与年龄显著正相关的细胞亚群,(c) 与年龄显著负相关的细胞亚群,(d) 特定年龄组富集的细胞亚群。e-g. 基于CyTOF分析的散点图展示年龄与各细胞亚群比例相关性:(e) 与年龄显著正相关的细胞亚群,(f) 与年龄显著负相关的细胞亚群,(g) 特定年龄组富集的细胞亚群。箱线图b-g中显示中位数(中心线)、第一和第三四分位数(箱体)及额外1.5倍四分位距(须线)。b、c、e和f中标示Spearman相关系数ρ及P值,P<0.05视为具有统计学显著性。

Extended Data Fig. 4 |See next page for caption.
扩展数据图4 |说明见下页。
Extended Data Fig. 4|Functional enrichment analyses of M-DEGs in periphera immune cell subsets.a.Bar plot showing the numbers of total M-DEGs defined by scRNA-seq in each cell subset.b.Bar plot showing the numbers of up regulated (left panel) and down regulated (right panel) M-DEGs in each cell subset. c.Heatmap showing the functional enrichment analyses of up regulated M-DEGs in different peripheral immune cell subsets.d.Heatmap showing the functional enrichment analyses of down regulated M-DEGs in different peripheral immune cell subsets.e.Functional enrichment network of the common M-DEGsin Fig.2c.f.Functional enrichment network ofthe common M-DEGsinFig.2d. g,h. The DEGs were classified into distinct clusters by Mfuzzbased on the temporal trajectories of their expression.The DEG clusters whose expression peaked in children (144 genes,g) and the elderly (90 genes, h) are shown.
扩展数据图 4 | 外周免疫细胞亚群中M-DEGs的功能富集分析
a. 条形图展示各细胞亚群中通过单细胞RNA测序(scRNA-seq)定义的M-DEGs总数。
b. 条形图展示各细胞亚群中上调(左图)和下调(右图)的M-DEGs数量。
c. 热图展示不同外周免疫细胞亚群中上调M-DEGs的功能富集分析。
d. 热图展示不同外周免疫细胞亚群中下调M-DEGs的功能富集分析。
e. 图2c中共有M-DEGs的功能富集网络。
f. 图2d中共有M-DEGs的功能富集网络。
g,h. 基于基因表达时序轨迹,通过Mfuzz将DEGs划分为不同聚类。其中在儿童期表达峰值(144个基因,g)和老年期表达峰值(90个基因,h)的DEG聚类如图所示。
i. Heatmap showing the functional enrichment analyses ofthe genes whose expression peaked in children in (g).j. Heatmap showing the functional enrichment analyses of the genes whose expression peaked in the elderly in (h).k. The positive correlation of L GALS l expression with age and the negative correlation of CCR7and TMI GD 2 expression with agevia bulk RNA-seq analyses $\mathbf{\zeta}_{n=34}$ samples).Theblue line indicates linear regression.Thegray shadow coversthe $95%$ confidence interval.Spearman correlation coefficient $\rho$ and $P$ values are indicated.APvalue $<0.05$ was considered statistically significant. $P$ values were determined by hyper geometric test inc-f,iandj.DEG, differential ly-expressed genes; M-DEGs, monotonically differential ly expressed genes.
i. 热图显示(g)中在儿童时期表达达到峰值的基因功能富集分析结果。
j. 热图显示(h)中在老年时期表达达到峰值的基因功能富集分析结果。
k. 通过批量RNA-seq分析(n=34样本)显示L_GALS1表达与年龄呈正相关,CCR7和TMIGD2表达与年龄呈负相关。蓝色线条表示线性回归,灰色阴影覆盖95%置信区间。标明了Spearman相关系数ρ和P值。P值<0.05被认为具有统计学显著性。c-f、i和j中的P值通过超几何检验确定。DEG,差异表达基因;M-DEGs,单调差异表达基因。

Extended Data Fig. 5 |Expression dynamics of differential ly expressed immune checkpoints within immune cell subsets among the different life stages.a. Heatmaps showing the row-scaled expression of immune checkpoint ligands in the indicated cell subsets across the eight life stages.b. Heatmaps showing the row-scaled expression ofimmune checkpoint receptors in the indicated cell subsets across the eight life stages.
扩展数据图 5 | 不同生命阶段免疫细胞亚群中差异表达免疫检查点的动态变化
a. 热图显示八个生命阶段中指定细胞亚群的免疫检查点配体 (immune checkpoint ligands) 行标准化表达
b. 热图显示八个生命阶段中指定细胞亚群的免疫检查点受体 (immune checkpoint receptors) 行标准化表达


Extended Data Fig. 6|See next page for caption.
扩展数据 图6|图注见下页。
Extended Data Fig. 6| Characteristics of T cell subsets across the entire lifespan.a.Bar plot showing the percentage of TCR detection ineach αβT cell subset and in total T cells.b.Barplot showing the frequency of CDR 3 amino acid length from TCR α-chains (top panel) and TCR chains (bottom panel) across eight lifestages.Error bar shows the mean $\pm$ SEM.c.Box plots showing the cl on al expansion levels of each T cell subset quantified by STARTRACexpametric in T cell subsets across 13 age groups. d.Box plots showing T CR repertoire diversity in $\mathrm{CD4^{+}}$ naive T cells(CD 4 Naive C CR 7; left panel), CD8* naive T cells (CD 8 Naive LEF 1; middle panel) and MAIT cells (CD8_MAIT_ SLC4A10;right panel) across eight life stages.The diversity ofTCR repertoires was measured by Chaol method.e.Box plots showing TCR repertoire diversity in
扩展数据图 6 | 整个生命周期中T细胞亚群的特征。a. 条形图显示各αβT细胞亚群及总T细胞中TCR检测的百分比。b. 条形图展示八个生命阶段中TCR α链(上图)和TCR β链(下图)的CDR3氨基酸长度频率分布。误差条表示均值±标准误。c. 箱线图显示通过STARTRACexpametric量化的13个年龄组中各αβT细胞亚群的克隆扩增水平。d. 箱线图展示八个生命阶段中CD4+初始T细胞(左图)、CD8+初始T细胞(中图)和MAIT细胞(右图)的TCR库多样性。TCR库多样性采用Chaol方法测量。e. 箱线图显示...
CD 8 MA IT S LC 4 A 10 cells across eight life stages.The diversity of T CR repertoires was measured by Inverse Simpson Index.f.Representative gene interaction network of up regulated genes in (Fig. 5k) using the STRING database ( string-db.org/).Edge thickness represents the strength of data support from the STRING database.g.Box plots showing normalized protein expression of CD161 (encoded byKLRB1)in CD 8 MA IT cells in children(1-6yearsold),adolescents (12-18years old),adults(30-60 yearsold),and theelderly (70-90yearsold) based on the CyTOF analyses. In box plotsc-e and g, median (center line),first and third quart i les(box),and extra $1.5\times$ interquartile ranges(whiskers)are shown, and the black line indicates LOESS regression.CDR3,complement ari tydetermining region-3.
CD8 MA IT S LC 4 A 10 细胞在八个生命阶段的分布。TCR 库多样性通过逆辛普森指数 (Inverse Simpson Index) 测量。
f. 基于 STRING 数据库 (https://string-db.org/) 构建的 (图 5k) 中上调基因的代表性基因互作网络。连线粗细表示 STRING 数据库的数据支持强度。
g. 箱线图展示儿童 (1-6岁)、青少年 (12-18岁)、成人 (30-60岁) 和老年人 (70-90岁) 中 CD8 MA IT 细胞的 CD161 (由 KLRB1 编码) 标准化蛋白表达水平 (基于 CyTOF 分析)。在箱线图 c-e 和 g 中,中位数 (中线)、第一和第三四分位数 (箱体)、额外 $1.5\times$ 四分位距 (须线) 均已标出,黑色曲线为 LOESS 回归线。CDR3,互补决定区-3 (complementarity determining region-3)。

Extended Data Fig. 7|Functional difference between B_BCR'GNLY' cells and other peripheral immune cells with cytotoxic functions. a. Upset plots showing the number of shared up regulated DEG s in I $3_\mathrm{BCR^{+}G N L Y^{+}}$ cells compared with that in seven cytotoxic Tcell subsets including CD 4 TEM GN LY, CD 8 TCM HA VCR 2,CD 8 TEM ZN F 683, CD 8 TEM CM C 1,CD 8 TEM GN LY, CD 8 MA IT S LC 4 A 10,and y8 T cells.b. Upset plots showing the number of shared up regulated DEGsinB_BC+GNLY+cells compared with that in three cytotoxic NK cell subsets including NK_CD56low,NK CD 56 high,and NK Proliferating cells.c.Dot plots showing the representative enriched biological processes of up regulated DEGs inB_BCR'GNLY' cells compared with those in seven cytotoxicT cell subsets.
扩展数据图 7| B_BCR'GNLY'细胞与其他具有细胞毒性功能的外周免疫细胞之间的功能差异。a. 展示I $3_\mathrm{BCR^{+}G N L Y^{+}}$细胞与七个细胞毒性T细胞亚群(包括CD4 TEM GNLY、CD8 TCM HAVCR2、CD8 TEM ZNF683、CD8 TEM CM C1、CD8 TEM GNLY、CD8 MAIT SLC4A10和γδ T细胞)相比共享上调差异表达基因(DEG)数量的Upset图。b. 展示B_BC+GNLY+细胞与三个细胞毒性NK细胞亚群(包括NK_CD56low、NK CD56 high和NK Proliferating细胞)相比共享上调DEG数量的Upset图。c. 点图展示B_BCR'GNLY'细胞与七个细胞毒性T细胞亚群相比上调DEG的代表性富集生物学过程。
d. Dot plots showingthe representative enriched biological processes of up regulated DEG s in B BC R+GNLY*cells compared withthose inthree cytotoxic NK cell subsets.e.Boxplots showing the expression score of cyto toxicity in ${\bf B}_{\mathrm{BCR}^{+}\mathrm{GNLY^{+}}}$ cells and seven cytotoxic T cell and three cytotoxic NK cell subsets. Box plots show median(centerline),first and third quartiles(box),andextra $1.5\times$ interquartile ranges (whiskers) and the black line indicates LOESS regression. The dashed line indicates the median score of cyto toxicity in B_BCR+GNLY*cells. $P$ valueswere determined by the two-sided unpaired Wilcoxon rank-sum test.A Pvalue $<0.05$ was considered statistically significant. Inc and d,Pvalues were determined by hyper geometric test.
d. 点图展示了与三个细胞毒性NK细胞亚群相比,B BCR+GNLY细胞中上调差异表达基因(DEG)的代表性富集生物过程。
e. 箱线图展示了${\bf B}_{\mathrm{BCR}^{+}\mathrm{GNLY^{+}}}$细胞与七个细胞毒性T细胞及三个细胞毒性NK细胞亚群的细胞毒性表达评分。箱线图显示中位数(中心线)、第一和第三四分位数(箱体)、额外$1.5\times$四分位距(须线),黑色线条表示LOESS回归。虚线表示B_BCR+GNLY*细胞的细胞毒性评分中位数。$P$值通过双尾非配对Wilcoxon秩和检验确定,$P<0.05$视为具有统计学显著性。在c和d中,$P$值通过超几何检验计算。

Extended DataFig.8|Features of BC R across the human lifespan.a.Bar plot showingthe percentage of BCR detection in all peripheral immune cell subsets.b. U MAP plots showing selected shared BC R clones among different B cell subsets. c.Box plot showing the cl on al expansion levels of total B cells(topleft)andfiveB cell subsets across eight agestages quantified bySTARTRAC-expa metric.d.Box plots showing the CDR 3 amino acid length from BC R heavy chains(left panel) and BCR light chains (right panel) across eight life stages.After controlling for donor, Kruskal-Wallis test reveals no significant differences in CDR3 amino acid length across eight life stages $(P>0.05)$ .In box plots c and d, median (center line), first and third quartiles (box),and extra $1.5\times$ interquartile ranges(whiskers)are shown, and the black line indicates LOESS regression.
扩展数据图8 | 人类生命周期中BCR的特征。a. 条形图显示所有外周免疫细胞亚群中BCR检测的百分比。b. UMAP图展示不同B细胞亚群间共享的选定BCR克隆。c. 箱线图显示通过STARTRAC-expa指标量化的八个年龄阶段中总B细胞(左上)及五个B细胞亚群的克隆扩增水平。d. 箱线图展示八个生命阶段中BCR重链(左图)和轻链(右图)的CDR3氨基酸长度。在控制供体因素后,Kruskal-Wallis检验显示八个生命阶段间CDR3氨基酸长度无显著差异$(P>0.05)$。在箱线图c和d中,中位数(中心线)、第一和第三四分位数(箱体)及额外$1.5\times$四分位距(须线)均被标注,黑色线条表示LOESS回归。

differentiation in the B cell subsets. a. Heatmap showing the area under the specificity score.c. Heatmap showingthe row-scaled expression of the top 10 TFs curve values of TF regulons in each B cell subset. Numbers between brackets in each B cell subset shown in (b). TF, transcription factor. represent the regulon counts for respective TFs. The value for each TF regulon is
B细胞亚群中的分化情况。a. 热图显示各B细胞亚群中TF调控子的特异性评分曲线下面积。c. 热图显示(b)中所示各B细胞亚群前10个转录因子(TF)的行标准化表达值。括号内数字代表相应TF的调控子计数。每个TF调控子的数值为

Extended DataFig.10|Agraphic summary ofthe novel insights from this study.We developed a comprehensive single-cell atlasof human peripheral immune cells acrossthe lifespan from newbornsto the elderly.Single-cell multi-omics analyses were performed tocapture the diversity and dynamic trajectories of peripheral immune cells, revealing key age-specific features:a newly identified cytotoxic B-cell population enriched inchildren,expansion of mucosal-associated invariant T (MAIT) cells during adolescence, distinct aging patterns in naive $\mathbb{C}\mathbb{D}4+$ and $\mathrm{CD8+}$ Tcells,and cl on al expansions of $\mathrm{CD8+}$ Tcells in both young and elderly individuals.Additionally, we constructed an immune age prediction model, which estimates immune age and identifies potential immune dysfunction.Created in BioRender.Huang, T. (2024) https://BioRender.com/ a58r007.
扩展数据图 10 | 本研究新发现图示总结。我们构建了一个涵盖从新生儿到老年人全生命周期的人类外周免疫细胞综合单细胞图谱。通过单细胞多组学分析捕捉外周免疫细胞的多样性和动态变化轨迹,揭示了关键年龄特征:新发现的儿童期富集的细胞毒性B细胞群体、青春期黏膜相关不变T细胞 (MAIT) 的扩增、初始 $\mathbb{C}\mathbb{D}4+$ 和 $\mathrm{CD8+}$ T细胞的特异性衰老模式,以及年轻人和老年人群体中 $\mathrm{CD8+}$ T细胞的克隆扩增。此外,我们构建了免疫年龄预测模型,可评估免疫年龄并识别潜在免疫功能障碍。图表使用BioRender制作。Huang, T. (2024) https://BioRender.com/ a58r007。
nature portfolio
自然科研
Reporting Summary
报告摘要
Nature Portfolio wishes to improve the reproducibility of the work that we publish. This form provides structure for consistency and transparency in reporting. For further information on Nature Portfolio policies, see our Editorial Policies and the Editorial Policy Checklist.
Nature Portfolio致力于提升所发表研究的可重复性。本表格旨在为报告提供统一、透明的规范框架。有关Nature Portfolio政策的更多信息,请参阅我们的编辑政策和编辑政策核对清单。
Statistics
统计
For all statistical analyses, confirm that the following items are present in the figure legend, table legend, main text, or Methods section.
在进行所有统计分析时,请确保以下项目出现在图例、表例、正文或方法部分。

Our web collection on statistics for biologists contains articles on many of the points above.
我们为生物学家整理的统计学网络资源涵盖了上述诸多要点。
Software and code
软件与代码
Policy information about availability of computer code
计算机代码可用性的政策信息
For manuscripts utiling custom algorithms or software that are central to the research but not yet described in published literature, software must be made available to editors and reviewers. We strongly encourage code deposition in a community repository (e.g. GitHub). See the Nature Porfolio guidelines for submitting code & software for further information.
对于使用未在已发表文献中描述但对研究至关重要的自定义算法或软件的稿件,必须向编辑和审稿人提供该软件。我们强烈建议将代码托管至社区仓库(如GitHub)。更多信息请参阅《Nature Portfolio》的代码与软件提交指南。
Data
数据
Policy information about availability of data
数据可用性政策信息
All manuscripts must include a data availability statement. This statement should provide the following information, where applicable:
所有稿件必须包含数据可用性声明。该声明应提供以下适用信息:
- Accession codes, unique identifiers, or web links for publicly available datasets - A description of any restrictions on data availability - For clinical datasets or third party data, please ensure that the statement adheres to our policy
- 公开可用数据集的项目编号、唯一标识符或网页链接
- 对数据可用性限制的描述
- 对于临床数据集或第三方数据,请确保声明符合我们的政策
Research involving human participants, their data, or biological material
涉及人类参与者、其数据或生物材料的研究
Policy information about studies with human participants or human data. See also policy information about sex, gender (identity/presentation), and sexual orientation and race, ethnicity and racism.
关于涉及人类参与者或人类数据研究的政策信息。另请参阅关于性别、性别认同/表现、性取向以及种族、民族和种族主义的政策信息。
Reporting on sex and gender
报告性别
We deliberately balanced the sex ratio of participants during enrollment. Detailed participant information is provided in Supplementary Table 1.
我们在招募过程中有意平衡了参与者的性别比例。详细参与者信息见补充表1。
Reporting on race, ethnicity, or other socially relevant groupings
报告种族、民族或其他社会相关群体
All the healthy donors in this study are of East Asian ancestry.
本研究中的所有健康供者均为东亚裔。
Population characteristics
人口特征
Characteristics of all participants are detailed in Supplementary Table 1.
所有参与者的特征详见补充表1。
Recruitment
招聘
Ethics oversight
伦理监督
All human samples were obtained with written informed consent in accordance with protocols approved by the Institutional Review Board at Shanghai Jiao Tong University. All donors were enrolled with approval by the Ethics Committee of Ren Ji Hospital (KY2019-136), School of Medicine, Shanghai Jiao Tong University.
所有人体样本均按照上海交通大学机构审查委员会批准的方案,在获得书面知情同意后采集。所有供体均经上海交通大学医学院附属仁济医院伦理委员会批准入组 (KY2019-136)。
Note that full information on the approval of the study protocol must also be provided in the manuscript.
请注意,研究方案的批准信息也必须在稿件中完整提供。
Field-specific reporting
领域特定报告
lease seletthe one be lw that is the best fit for your research.f youarent sure, read the appropriate sections before making your selection.
请选择最适合您研究的那一项。如果不确定,请在做出选择前阅读相关章节。

Life sciences
生命科学
Behavioural & social sciences
行为与社会科学
Ecological, evolutionary & environmental sciences
生态、进化与环境科学
For a reference copy of the document with all sections, see nature.com/documents/nr-reporting-summary-flat.pdf
如需包含所有章节的文档参考副本,请访问 nature.com/documents/nr-reporting-summary-flat.pdf
Life sciences study design
生命科学研究设计
All studies must disclose on these points even when the disclosure is negative.
所有研究都必须披露这些要点,即使披露内容为负面信息。
Sample size
样本量
A total of 220 healthy volunteers aged 0 to $\geq90$ years were recruited from Shanghai Pudong Cohort (NC T 05206643), including 61 for scRNA and scTCR/scBCR sequencing, 70 for independent CyTOF-based single-celprotein validation experiments, 34 for independent bulk RNA-seq
从上海浦东队列(NCT05206643)招募了220名0岁至≥90岁的健康志愿者,其中61人进行单细胞RNA测序(scRNA)和单细胞TCR/BCR测序(scTCR/scBCR),70人用于独立的基于质谱流式细胞术(CyTOF)的单细胞蛋白验证实验,34人用于独立批量RNA测序
| 验证实验使用了55名志愿者,流式细胞术验证实验也使用了55名志愿者。本研究为观察性研究,样本量取决于我们能够招募到的合格志愿者人数。研究结论经过适当的统计检验,反映了样本中观察到的实际数值。 | |
| 数据排除 | 单细胞RNA测序(scRNA-seq)、批量RNA测序(bulk RNA-seq)、质谱流式细胞术(CyTOF)和流式细胞术数据集中均未排除任何样本。单细胞RNA测序细胞排除标准:双联体(双联率=0.075,双联评分<0.25)、表达基因数<400的细胞、检测到基因数>2500的细胞、表达两套主要细胞类型经典标记物的细胞被判定为双联体并从后续分析中排除。 |
| 为确保统计学意义,免疫荧光染色、流式细胞分析和动物实验均独立重复至少三次。本研究为仅含一个实验组的观察性队列,因此随机化不适用于单细胞RNA测序、质谱流式细胞术和批量RNA测序队列。匹配年龄和性别的小鼠被随机分配至各组。 | |
| 盲法 | 本研究为观察性研究,未对志愿者进行干预,因此未实施双盲实验。 |
Reporting for specific materials, systems and methods
特定材料、系统和方法的报告
We require information from authors about some types of materials, experimental systems and methods used in many studies. Here, indicate whether each material, system or method listed is relevant to your study. If you are not sure if a list item applies to your research, read the appropriate section before selecting a response.
我们需要作者提供关于研究中使用的某些材料、实验系统和方法的信息。请指出以下列出的每种材料、系统或方法是否与您的研究相关。如果不确定某个项目是否适用于您的研究,请在选择回答前阅读相应部分。
Materials & experimental systems Methods
材料与实验系统方法

Antibodies
抗体
Antibodies used
使用的抗体

| 特异性 | 标签 | 克隆 | 制造商 | 标识符 |
|---|---|---|---|---|
| 抗人CD3 | 115In | UCHT1 | Bioxcell | BE0231 |
| 抗人CD56 | 141Pr | NCAM16.2 | BD | 559043 |
| 抗人TCRv/δ | 142Nd | 5A6.E9 | PLT | 100P001A |
| 抗人CCR6 | 143Nd | G034E3 | Biolegend | 353402 |
| 抗人CD14 | 144Nd | M5E2 | Biolegend | 301862 |
| 抗人IgD | 145Nd | IA6-2 | Biolegend | 348202 |
| 抗人CD38 | 146Nd | HIT2 | Biolegend | 303502 |
| 抗人CXCR3 | 147Sm | G025H7 | Biolegend | 353750 |
| 抗人CD1c | 148Nd | L161 | Biolegend | 331502 |
| 抗人CD62L | 149Sm | DREG-56 | Biolegend | 304854 |
| 抗人ICOS | 150Nd | C398.4A | Biolegend | 313502 |
| 抗人GNLY | 151Eu | RB1 | BD | 558254 |
| 抗人CD45RA | 152Sm | Hl100 | Biolegend | 304102 |
| 抗人CCR4 | 153Eu | L291H4 | Biolegend | 359402 |
| 抗人HLA-DR | 154Sm | L243 | Biolegend | 307648 |
| 抗人IL-3Rα | 155Gd | 6H6 | Biolegend | 306002 |
| 抗人ZNF683 | 156Gd | Sanquin-Hobit/1 | BD | 624382 |
| 抗人IgG | 157Gd | M1310G05 | Biolegend | 410701 |
| 抗人CCR7 | 158Gd | G043H7 | Biolegend | 353256 |
| 抗人CD11c | 159Tb | Bu15 | Biolegend | 337202 |
| 抗人Helios | 160Gd | 22F6 | Biolegend | 137202 |
| 抗人CTLA-4 | 161Dy | BN13 | Bioxcell | BE0190 |
| 抗人CD27 | 162Dy | O323 | Biolegend | 302802 |
Anti-human IgA antibody (https://www.scbt.com/zh/p/iga-antibody-b-12). Anti-lgA monoclonal antibody raised against amino acids 1-300 mapping at the N-terminus of IgA of human origin. This antibody is tested by IHC-P, WB, IF, FCM.
抗人IgA抗体 (https://www.scbt.com/zh/p/iga-antibody-b-12)。该抗IgA单克隆抗体针对人源IgA的N端1-300位氨基酸序列制备,经IHC-P、WB、IF、FCM验证。
Animals and other research organisms
动物及其他研究生物体
2olicy information about studies involving animals; ARRIVE guidelines recommended for reporting animal research, and Sex and Genderin Research
涉及动物研究的政策信息;推荐使用ARRIVE指南报告动物研究,以及研究中的性别因素
| 实验动物 | 为了构建过表达GNLY的小鼠模型,将人源GNLY的cDNA克隆并用于构建转基因载体CAG-loxP-STOP-loxP-GNLY-WPRE-pA(上海南方模式生物科技股份有限公司)。通过CRISPR/Cas9技术将该转基因载体敲入ROSA26位点。为诱导B细胞特异性GNLY表达,将CAG-loxP-STOP-loxP-GNLY-WPRE-pA转基因小鼠与CD19-CAG-Cre转基因小鼠杂交;同窝CD19-Cre小鼠作为对照。本研究使用的雄性和雌性小鼠均为C57BL/6背景,年龄6-8周。所有小鼠饲养条件为24°C±2°C,湿度40%±5%,恒定12小时光照/黑暗循环,自由获取饮食和饮水。 |
| 野生动物 | 本研究未涉及野生动物。 |
| 性别报告 | 雄性和雌性。 |
| 野外采集样本 | 本研究未涉及野外采集的样本。 |
| 伦理监督 | 随机动物实验方案经上海交通大学医学院附属仁济医院动物伦理委员会批准,并遵循美国国立卫生研究院(NIH)《实验动物护理和使用指南》。 |
Note that full information on the approval of the study protocol must also be provided in the manuscript.
请注意,研究方案获批的完整信息也必须在稿件中提供。
Clinical data
临床数据
Policy information about clinical studies
临床研究政策信息
Il manuscripts should comply with the ICMJE guidelines for publication of clinical research and a completed CONSORT checklist must be included with al submissions.
所有稿件应符合ICMJE临床研究发表指南,且每份投稿必须附上完整的CONSORT检查清单。
| 临床试验注册 | 不适用 |
| 研究方案 | 未进行临床试验 - 前瞻性观察性队列研究。 |
| 数据收集 | 1. 流行病学调查:根据队列研究的原则和要求设计《公共卫生与慢性病防控调查问卷》。在知情告知前提下,由签署知情同意书并接受统一培训的调查员与被研究队列进行面对面访谈收集数据。质控人员将对问卷进行质控审核。主要内容包括人口社会学特征、生活方式、体育锻炼、日常饮食习惯、膳食补充剂使用情况、个人及家族疾病史、心理评估以及女性生育史。2. 体格检查:由健康服务中心临床专业医师执行检查,内容包括身高、体重、血压、听力、视力、内外科检查、体脂成分(选做)、胸部X光、心电图、B超、颈动脉超声(选做)及其他影像学检查。 |
Outcomes
结果
不适用
Flow Cytometry
流式细胞术
Plots
图表
Confirm that:
确认:
The axis labels state the marker and flu oro chrome used (e.g. CD4-FITC)
轴标签标注了使用的标记物和荧光染料 (如 CD4-FITC)
rhe axis scales are clearly visible. Include numbers along axes only for bottom left plot of group (a'group' is an analysis of identical markers).
坐标轴刻度需清晰可见。仅对组内左下角图标注坐标轴数值(“组”指相同标记的分析)。
All plots are contour plots with outliers or pseudo color plots.
所有图表均为带异常值的等高线图或伪彩色图。
| A numerical value for number of cells or percentage (with statistics) is provided.
| 提供了细胞数量或百分比(含统计量)的数值。
Methodology
方法
Sample preparation
样品制备
PB MCs isolation: Blood samples were collected from the peripheral vein of each donor and processed within 2 hours of collection. UCB was obtained from placental cords. PBMCs were separated using Vacutainer CPT tubes (362761, BD, San Diego, CA, USA)
PB MCs分离:从每位供体的外周静脉采集血液样本,并在采集后2小时内处理。UCB取自胎盘脐带。使用Vacutainer CPT管(362761, BD, San Diego, CA, USA)分离PBMCs。
B细胞分选:采用Vacutainer CPT管(362761,BD)按说明书从全血样本分离人PBMC。使用Human Pan B Cell Isolation Kit(130-101-638, Miltenyi Biotec)从PBMC中分选B细胞,经流式验证纯度(>95%)。分选后的人B细胞使用ImmunoCult™ Human B Cell Expansion Kit(100-0645, STEMCELL Technologies)进行培养扩增备用。