Modelling the coronavirus epidemic in a city with Python
用 Python 模拟城市中的冠状病毒流行
Are cities prepared for epidemics?城市是否为流行病做好了准备?
You can learn the entire modelling, simulation and spatial visualization of the Covid-19 epidemic spreading in a city using just Python in this online course or in this one.
您可以在本在线课程或本课程中仅使用 Python 学习 Covid-19 流行病在城市中传播的整个建模、模拟和空间可视化。
The recent 2019-nCoV Wuhan coronavirus outbreak in China has sent shocks through financial markets and entire economies, and has duly triggered panic among the general population around the world. On 30 January 2020, 2019-nCoV was even designated a global health emergency by the World Health Organization (WHO). At the time of this writing, no specific treatment verified by medical research standards has yet been discovered. Moreover, some key epidemiological metrics such as the basic reproduction number (the average number of people infected by an ill individual) are still unknown. In our times of unprecedented global connectedness and mobility, such epidemics are a major threat on a global scale due to small world network effects. One could conjecture that conditional on a global catastrophic event (loosely defined as > 100mln casualties) happening in 2020, the most likely cause would be precisely some pandemic — not a nuclear disaster, not climate catastrophe, etc. This is further aggravated by worldwide rapid urbanisation, with our densely populated dynamic cities turning into propagation nodes in the disease diffusion network, thus becoming extremely vulnerable and fragile.
最近在中国爆发的2019-nCoV 武汉冠状病毒疫情给金融市场和整个经济体带来了冲击,并适时引发了全球普通民众的恐慌。2020 年 1 月 30 日,2019-nCoV 甚至被世界卫生组织 (WHO)指定为全球卫生紧急事件。在撰写本文时,尚未发现经过医学研究标准验证的具体治疗方法。此外,一些关键的流行病学指标,如基本繁殖数(患病个体感染的平均人数)仍然未知。在我们前所未有的全球连通性和流动性时代,由于世界网络小,此类流行病是全球范围内的主要威胁效果。可以推测,如果 2020 年发生全球灾难性事件(大致定义为 > 1 亿人伤亡),最可能的原因恰恰是某种流行病——不是核灾难,也不是气候灾难等。城市化,我们人口稠密的充满活力的城市变成了疾病传播网络中的传播节点,因此变得极其脆弱和脆弱。
In this post, we will discuss what can happen when an epidemic strikes a city, what measures should immediately be taken, and what implications this has for urban planning, policy making, and management. We will take the city of Yerevan as our case study and will mathematically model and simulate in Python the spread of the coronavirus in the city, looking at how urban mobility patterns affect the spread of the disease.
在这篇文章中,我们将讨论当流行病袭击一个城市时会发生什么,应该立即采取哪些措施,以及这对城市规划、政策制定和管理有什么影响。我们将以埃里温市为案例研究,并使用 Python 对冠状病毒在城市中的传播进行数学建模和模拟,研究城市流动模式如何影响疾病的传播。
Urban mobility 城市交通
Effective, efficient, and sustainable urban mobility is of crucial importance for the functioning of modern cities. It has been shown to directly affect livability and economic output (GDP) of cities. However, in the event of an epidemic, it will add fuel to the fire, amplifyig and propagating the disease spread.
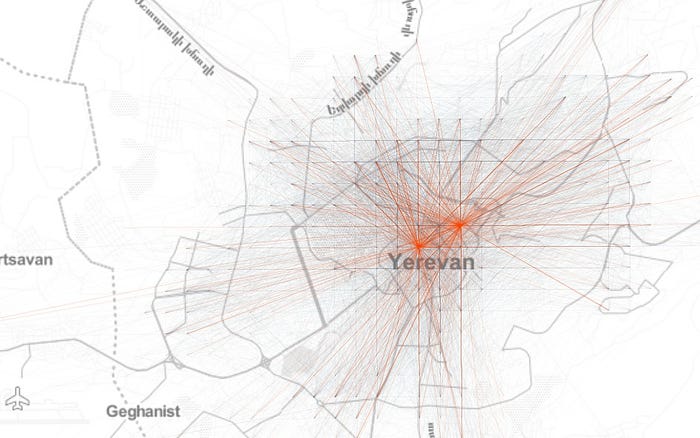
So let’s begin by looking at the network of aggregated origin-destination (OD) flows on a uniform Cartesian grid in Yerevan to get an idea about the spatial structure of mobility patterns in the city:
有效、高效和可持续的城市交通对于现代城市的运作至关重要。它已被证明直接影响城市的宜居性和经济产出(GDP)。但是,一旦发生流行病,就会火上浇油,放大和传播疾病的传播。
因此,让我们首先查看埃里温统一笛卡尔网格上的聚合起点-终点 ( OD ) 流动网络,以了解该城市流动模式的空间结构:
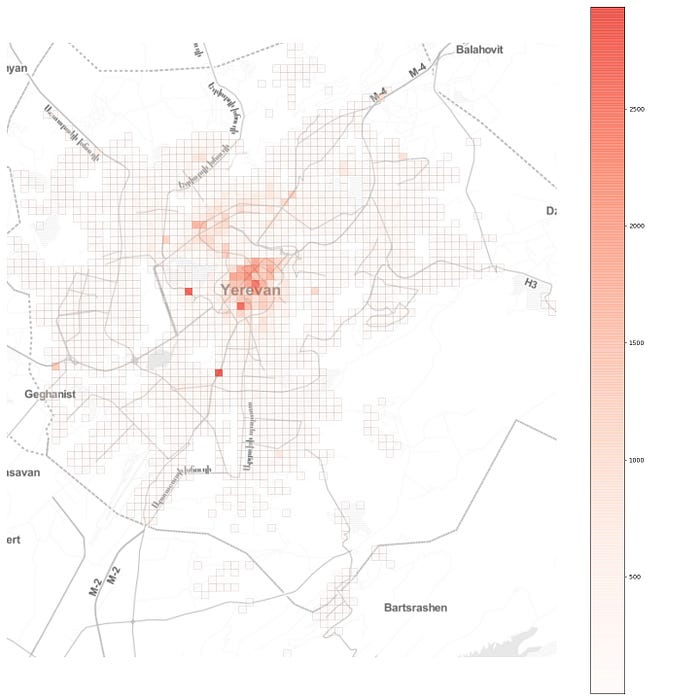
Further, if we look at the total inflow to the grid cells, we see a more or less monocentric spatial organisation with some cells with high daily inflow located off the center:
此外,如果我们查看网格单元的总流入量,我们会看到或多或少的单中心空间组织,其中一些每日流入量高的单元位于中心之外:
Now, imagine that an epidemic breaks out at a random location in the city. How will it spread? What can be done to contain it?
现在,想象一场流行病在城市的一个随机地点爆发。它将如何传播?可以做些什么来遏制它?
Modelling the epidemic 模拟流行病
To answer these questions, we will build a simple compartmental model to simulate the spread of infectious disease in the city. As an epidemic breaks out, its transmission dynamics varies significantly, depending on the geographical locations of the initial infection and its connectivity with the rest of the city. This is one of the most important insights gained from recent, data-driven studies on epidemics in urban populations. However, as we will see further below, the various outcomes call for similar measures to contain the epidemic and to account for such a possibility in planning and managing cities.
为了回答这些问题,我们将建立一个简单的分区模型来模拟传染病在城市中的传播。随着流行病的爆发,其传播动态会发生显着变化,具体取决于初始感染的地理位置及其与城市其他地区的连通性。这是最近从数据驱动的城市人口流行病研究中获得的最重要的见解之一。然而,正如我们将在下文中进一步看到的那样,各种结果要求采取类似措施来控制疫情,并在规划和管理城市时考虑这种可能性。
Since runnning individual-based epidemic models is challenging, and since our goal is to show general principles of epidemic spread in cities, and not to build a minutely calibrated and accurate epidemic model, we will follow the approach described in this Nature article, modifying the described classical SIR model for our needs.
由于运行基于个体的流行病模型具有挑战性,并且由于我们的目标是展示流行病在城市传播的一般原则,而不是建立一个经过精确校准和准确的流行病模型,我们将遵循这篇Nature 文章中描述的方法,修改描述了满足我们需求的经典SIR 模型。
The model divides the population into three compartments. For each location i at time t, the three compartments are as follows:
该模型将人口分为三个部分。对于时间t的每个位置i,三个隔间如下:**
- Si,t: the number of individuals not yet infected or susceptible to the disease. 尚未感染或易感该疾病的个体数量。
- Ii,t: the number of individuals infected with the disease and capable of spreading the disease to those in the susceptible group. 感染该疾病并能够将疾病传播给易感人群的人数。
- Ri,t: the number of individuals who have been infected and then removed from the infected group, either due to recovery or due to death. Individuals in this group are not capable of contracting the disease again or transmitting the infection to others.
因康复或死亡而被感染然后从感染组中移除的人数。该组中的个人不能再次感染该疾病或将感染传播给他人。
In our simulations, time will be a discrete variable as the state of the system is modelled at a daily basis. In a fully susceptible population at location j at time t, an outbreak happens with probability:
在我们的模拟中,时间将是一个离散变量,因为系统的状态每天都在建模。在时间t位置**j的完全易感人群中,爆发的概率为:**
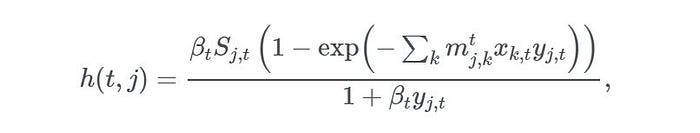
where βt is the transmission rate on day t; mj,k reflects mobility from location k to location j, xk,t and yk,t denote the fraction of the infected and susceptible populations on day t at location k and location j, respectively, given by xk,t = Ik,t / Nk and yj,t = Sj,t / Nj, where Nk and Nj are the population sizes at the locations k and j. Then we go ahead and simulate a stochastic process introducing the disease into locations with entirely susceptible populations, with Ij,t+1 being a Bernoulli random variable with probability h(t,j).
其中βt是第**t天的传输速率;mj,k反映从位置k到位置j的流动性,xk,t和yk,t分别表示第**t天在位置k和位置j的感染和易感人群的比例,由xk,t = Ik,t / Nk和yj,t = Sj,t / Nj,其中Nk和Nj是位置k和j的人口规模. 然后我们继续模拟将疾病引入具有完全易感人群的位置的随机过程,其中Ij,t+1是概率*为 h(t,j)*的伯努利随机变量。
Once the infections are introduced at random locations, the disease spreads both within those locations and is carried and transmitted in other locations by travelling individuals. This is where the urban mobility patterns characterised by the OD flow matrix play a crucial role.
一旦在随机地点引入感染,疾病就会在这些地点内传播,并由旅行的个人在其他地点携带和传播。这就是以OD流量矩阵为特征的城市交通模式发挥关键作用的地方。
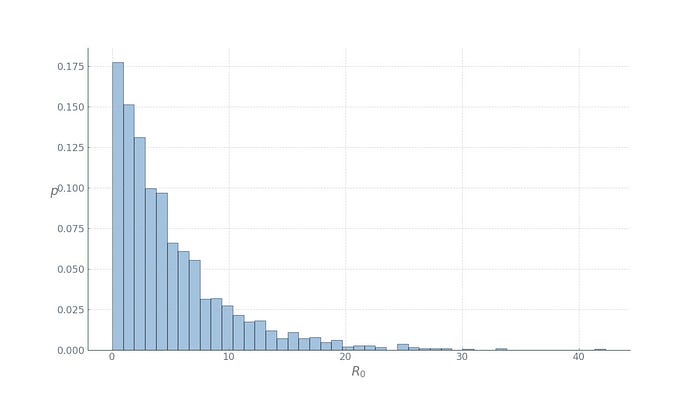
Further, to formalise how the disease is transmitted by an infected person, we need the basic reproduction number, R0. It is defined as R0 = βt / γ where γ is the recovery rate, and can be thought of as the expected number of secondary infections after an infected individual comes into contact with a susceptible population. At the time of this writing, the basic reproduction number for the Wuhan coronavirus has been estimated to be between 1.4 and 4. Let’s take the worst case and assume it’s 4. However, we should note that it’s actually a random variable and the reported number is but the expected number. To make things a bit more interesting, we will run our simulations with different R0 at each location, drawn from a good candidate distribution, Gamma, with mean 4:
此外,为了正式确定感染者如何传播疾病,我们需要基本的传染数R0。它定义为R0 = βt / γ,其中γ是恢复率,可以认为是受感染个体与易感人群接触后的预期继发感染次数。在撰写本文时,武汉冠状病毒的基本传染数估计在 1.4 到 4 之间。让我们以最坏的情况假设它是 4。但是,我们应该注意它实际上是一个随机变量和报告的数字只是预期的数字。为了让事情变得更有趣,我们将在每个位置使用不同的R0运行我们的模拟,从一个好的候选分布Gamma中提取,平均值为 4:
We can now proceed to the model dynamics:
我们现在可以继续进行模型动力学:
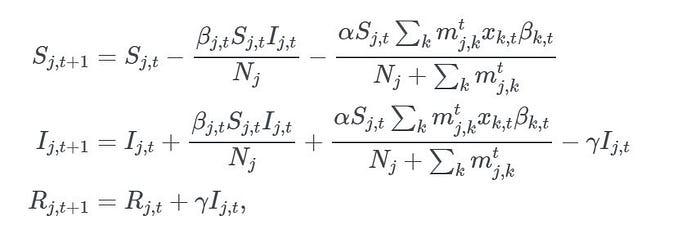
where βk,t is the (random) transmission rate at location k on day t, and α is a coefficient denoting the modal share or the intensity of public transport vs. private car travel modes in the city.
The model dynamics described in the above equations are very simple: on day t+1 at location j, we need to subtract from the susceptible population Sj,t the fraction of people infected within location* j* (the second term in the first equation) as well as the fraction of infected people that have arrived from other locations in the city, weighted by their respective transmission rates βk,t (the third term in the first equation). Since the total population Nj = Sj + Ij + Rj, we need to move the subtracted portion to the infected group, while also moving those recovered to Rj,t+1 (second and third equations).
其中βk,t是第**t天位置k的(随机)传输速率,α是一个系数,表示城市中公共交通与私家车出行方式的模式份额或强度。****
上述方程中描述的模型动力学非常简单:在位置j的第**t+1天,我们需要从易感人群Sj,t中减去位置**j内的感染人数比例(第一个方程中的第二项)为以及从城市其他地方到达的感染者的比例,由他们各自的传播率βk,t加权(第一个等式中的第三项)。由于总人口Nj = Sj + Ij + Rj,我们需要将减去的部分移至感染组,同时将恢复的部分移至Rj,t+1(第二个和第三个方程)。
Simulation setup 模拟设置
For this analysis, we will use the aggregated OD flow matrix of a typical day obtained from GPS data provided by local ride sharing company gg as a proxy for the mobility patterns in Yerevan city. Next, we need the population counts in each 250×250m grid cell, which we approximate by proportionally scaling the extracted flow counts so that the total inflows in different locations sum up to approximately half of Yerevan’s population of 1.1 million. This is actually a bold assumption, but since varying this portion yielded very similar results, we will stick to it.
在此分析中,我们将使用从当地拼车公司gg提供的 GPS 数据获得的典型一天的聚合OD流矩阵作为埃里温市移动模式的代理。接下来,我们需要每个250×250m网格单元中的人口计数,我们通过按比例缩放提取的流量计数来近似计算,以便不同位置的总流入量总计约为埃里温 110 万人口的一半。这实际上是一个大胆的假设,但由于改变这部分会产生非常相似的结果,我们会坚持下去。
Reduce public transport?减少公共交通?
对于我们的第一个模拟,我们将想象一个可持续的公共交通主导的未来城市交通,α=0.9:
For our first simulation, we will imagine a sustainable public transport-dominated future urban mobility with α=0.9:
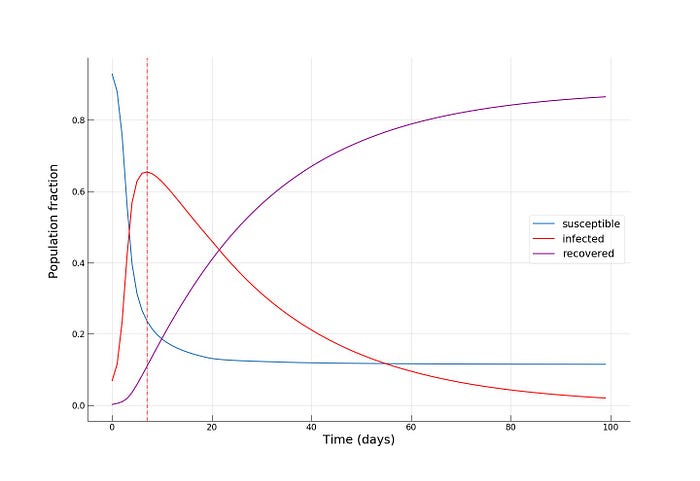
We see how fast the infected fraction of the population is climbing up immediately, reaching the epidemic’s peak on around day 8–10, with almost 70% of the population infected, while only a small portion (~10%) of the population having recovered from the disease. Towards day 100, when the epidemic has receded, we see the fraction of recovered individuals reach a staggering 90%! Now let’s see if reducing the intensity of public transport travel to something like α = 0.2 has any effect on mitigating the epidemic spread. This can either be interpreted as taking drastic measures to reduce urban mobility (e.g., by issuing a curfew) or as increasing the share of private car travel to reduce chances of infection during the travel.
我们看到受感染的人口比例迅速攀升,在第 8-10 天左右达到流行高峰,几乎 70% 的人口受到感染,而只有一小部分 (~10%) 的人口已经康复从疾病。在流行病消退的第 100 天,我们看到康复者的比例达到了惊人的 90%!现在让我们看看将公共交通出行强度降低到α = 0.2对缓解流行病传播是否有任何影响。这可以被解释为采取严厉措施减少城市流动性(例如,通过宵禁)或增加私家车出行的比例以减少感染机会旅行期间**。
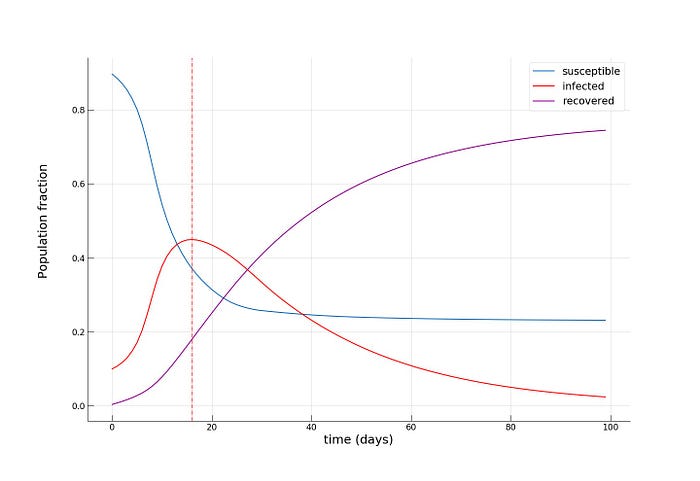
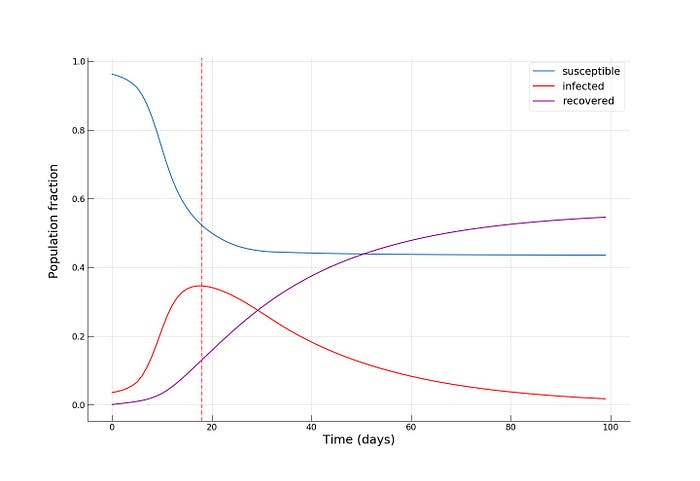
We see how the peak of the epidemic comes somewhere between day 16 and 20, with a significantly smaller infected group (~45%) and twice as many recovered (~20%). Towards the end of the epidemic, the fraction of susceptible individuals is also twice as big (~24% vs. ~12%), meaning that more people have escaped the disease. As expected, we see that the introduction of dramatic measures to temporarily bring urban mobility down has a big impact on the disease spreading dynamics.
我们看到流行病的高峰是如何在第 16 天到第 20 天之间出现的,感染人群明显减少(~45%),康复人数是原来的两倍(~20%)。在流行病结束时,易感个体的比例也增加了一倍(~24% vs. ~12%),这意味着更多的人逃脱了这种疾病。正如预期的那样,我们看到采取重大措施暂时降低城市流动性对疾病传播动态产生了重大影响。
Quarantine popular locations? # 隔离热门地点?
Now, let’s see whether another intuitive idea of completely cutting off a few key popular locations has the desired effect. To do this, let’s pick the locations associated with the upper 1 percentile of mobility flows,
现在,让我们看看另一种直观的想法,即完全切断几个关键的热门地点是否具有预期的效果。为此,让我们选择与移动流量的上 1 个百分位相关的位置,
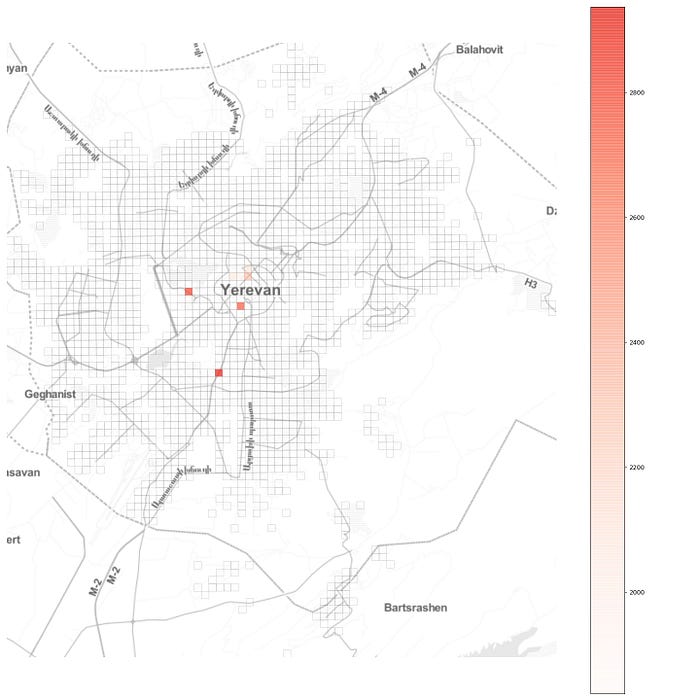
and completely block all flow to and from those locations, effectively establishing there a quarantine regime. As we can see from the plot, in Yerevan these locations are mostly in the city center, with two other locations being the two largest shopping malls. Choosing a moderate α = 0.5, we obtain:
并完全阻止所有进出这些地点的人流,有效地建立了隔离制度。从图中我们可以看出,在埃里温,这些地点大多位于市中心,另外两个地点是最大的两个购物中心。选择一个适度的α = 0.5,我们得到:
We see an even smaller fraction of infected individuals at the epidemic’s peak (~35%), and, most importantly, we see that towards the end of the epidemic, around half of the population remains susceptible, effectively escaping from contracting the infection!
在流行病的高峰期,我们看到的感染者比例更小(~35%),最重要的是,我们看到在流行病结束时,大约一半的人口仍然易感,有效地避免了感染!
Here is a small animation visualising the dynamics of the high public transport share scenario:
这是一个小动画,可视化高公共交通份额场景的动态:

Conclusion结论
By no means claiming accurate epidemic modelling (or even any substantial knowledge in epidemiology beyond the basics), our aim in this post was to get a first insight on how network effects come into play in an urban setting during an infectious disease outbreak. With ever-increasing population densities, mobility, and dynamics, our cities become more exposed to “black swans” and become more fragile. And since you can’t fetch the coffee if you’re dead, smart and sustainable cities will be meaningless without effective and efficient crisis handling capability and mechanisms. For instance, we saw that the introduction of quarantine regimes in key locations, or taking draconian measures to curb mobility, can be instrumental during such a health crisis. However, a further important question would be how to implement such measures while minimizing damage and loss to the functioning of the city and its economy?
绝不要求准确的流行病模型(甚至任何基础知识之外的流行病学知识),我们在这篇文章中的目的是首先了解网络效应如何在传染病爆发期间在城市环境中发挥作用。随着人口密度、流动性和活力的不断增加,我们的城市越来越容易受到“黑天鹅”的影响,变得更加脆弱。既然你死了就拿不到咖啡,如果没有有效和高效的危机处理能力和机制,智慧和可持续发展的城市将毫无意义。例如,我们看到在关键地点引入隔离制度,或采取严厉措施限制流动性,在这种健康危机期间可能会发挥重要作用。然而,另一个重要的问题是如何实施这些措施,同时尽量减少对城市运作及其经济的损害和损失?
Further yet, the exact epidemic spreading mechanisms of infectious diseases are still an active area of research and the advances in this fields will have to be communicated to and integrated in urban planning, policymaking, and management to make our cities safe and antifragile.
P.S. Read the original post here.
此外,传染病的确切流行传播机制仍是一个活跃的研究领域,该领域的进展必须与城市规划、政策制定和管理进行交流和整合,以使我们的城市安全和反脆弱。
PS在这里阅读原帖。
The code for the above simulations:
import numpy as np
  # initialize the population vector from the origin-destination flow matrix
  N_k = np.abs(np.diagonal(OD) + OD.sum(axis=0) - OD.sum(axis=1))
  locs_len = len(N_k)                 # number of locations
  SIR = np.zeros(shape=(locs_len, 3)) # make a numpy array with 3 columns for keeping track of the S, I, R groups
  SIR[:,0] = N_k                      # initialize the S group with the respective populations

  first_infections = np.where(SIR[:, 0]<=thresh, SIR[:, 0]//20, 0)   # for demo purposes, randomly introduce infections
  SIR[:, 0] = SIR[:, 0] - first_infections
  SIR[:, 1] = SIR[:, 1] + first_infections                           # move infections to the I group

  # row normalize the SIR matrix for keeping track of group proportions
  row_sums = SIR.sum(axis=1)
  SIR_n = SIR / row_sums[:, np.newaxis]

  # initialize parameters
  beta = 1.6
  gamma = 0.04
  public_trans = 0.5                                 # alpha
  R0 = beta/gamma
  beta_vec = np.random.gamma(1.6, 2, locs_len)
  gamma_vec = np.full(locs_len, gamma)
  public_trans_vec = np.full(locs_len, public_trans)

  # make copy of the SIR matrices
  SIR_sim = SIR.copy()
  SIR_nsim = SIR_n.copy()

  # run model
  print(SIR_sim.sum(axis=0).sum() == N_k.sum())
  from tqdm import tqdm_notebook
  infected_pop_norm = []
  susceptible_pop_norm = []
  recovered_pop_norm = []
  for time_step in tqdm_notebook(range(100)):
      infected_mat = np.array([SIR_nsim[:,1],]*locs_len).transpose()
      OD_infected = np.round(OD*infected_mat)
      inflow_infected = OD_infected.sum(axis=0)
      inflow_infected = np.round(inflow_infected*public_trans_vec)
      print('total infected inflow: ', inflow_infected.sum())
      new_infect = beta_vec*SIR_sim[:, 0]*inflow_infected/(N_k + OD.sum(axis=0))
      new_recovered = gamma_vec*SIR_sim[:, 1]
      new_infect = np.where(new_infect>SIR_sim[:, 0], SIR_sim[:, 0], new_infect)
      SIR_sim[:, 0] = SIR_sim[:, 0] - new_infect
      SIR_sim[:, 1] = SIR_sim[:, 1] + new_infect - new_recovered
      SIR_sim[:, 2] = SIR_sim[:, 2] + new_recovered
      SIR_sim = np.where(SIR_sim<0,0,SIR_sim)
      # recompute the normalized SIR matrix
      row_sums = SIR_sim.sum(axis=1)
      SIR_nsim = SIR_sim / row_sums[:, np.newaxis]
      S = SIR_sim[:,0].sum()/N_k.sum()
      I = SIR_sim[:,1].sum()/N_k.sum()
      R = SIR_sim[:,2].sum()/N_k.sum()
      print(S, I, R, (S+I+R)*N_k.sum(), N_k.sum())
      print('\n')
      infected_pop_norm.append(I)
      susceptible_pop_norm.append(S)
      recovered_pop_norm.append(R)
[
840
11