Causal Inference: Trying to Understand the Question of Why
[Mar 7, 2020·11 min read
*Why are you reading this article? *Why did you choose to learn about causal inference? Why are you thinking that this is a really weird way to start an article? Who knows. A more interesting question to ask is why can we, as humans, think about and understand the question “why” in the first place!? If we ever want to create a system with Artificial General Intelligence, or AGI, we need to answer this question.
*你为什么要读这篇文章?*你为什么选择学习因果推理?为什么你认为这是开始一篇文章的一种非常奇怪的方式?谁知道。一个更有趣的问题是,作为人类,我们为什么可以首先思考和理解“为什么”这个问题!?如果我们想创建一个具有通用人工智能或 AGI 的系统,我们需要回答这个问题。

understanding why requires understanding of the whats, the wheres, and the whens. The hows, however, seem to be an implementation of the whys. image source.You, and everyone else on this planet, are able to understand cause-and-effect relationships, an ability that is still largely lacking in machines. And before we can think about creating a system that can generally understand cause-and-effect, we should look at cause-and-effect from a statistics perspective: causal calculus and causal inference. Statistics is where causality was born from, and in order to create a high-level causal system, we must return to the fundamentals.
Causal Inference is the process where causes are inferred from data. Any kind of data, as long as have enough of it. (Yes, even observational data). It sounds pretty simple, but it can get complicated. We, as humans, do this everyday, and we navigate the world with the knowledge we learn from causal inference. And not only do we use causal inference to navigate the world, we use causal inference to solve problems.
你和 这个星球上的其他人都能够理解因果关系,在很大程度上机器仍然缺乏这种能力。在我们考虑创建一个可以大致理解因果关系的系统之前,我们应该从统计学的角度来看待因果关系:因果演算和因果推理。统计是因果关系的起源,为了建立一个高层次的因果系统,我们必须回归本源。
因果推断是从数据中推断出**原因的过程。任何类型的数据,只要有足够的数据。(是的,即使是观察数据)。这听起来很简单,但它可能会变得复杂。作为人类,我们每天都这样做,我们用从因果推理中学到的知识来探索世界。我们不仅使用因果推理来导航世界,还使用因果推理来解决问题。

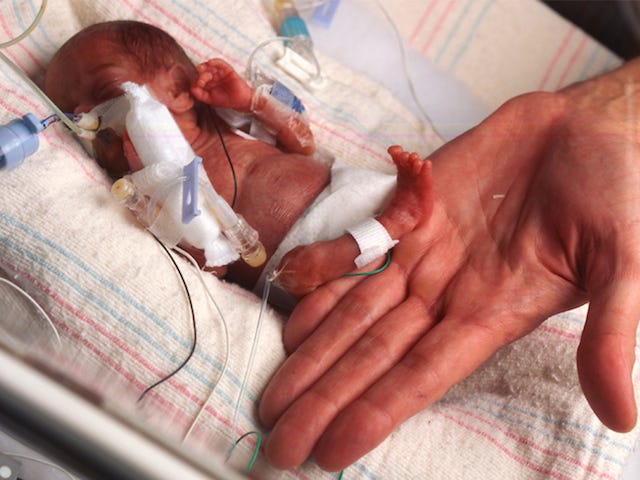
15 million premature babies are born every year. image source.Every year, 1.1 million premature babies die. In other words, 7.3**% **of all premature babies die every single year. Millions of parents have to struggle through the grief, suffering, and pain of losing their child over a process they can’t control. That’s a problem. Let’s say we want to figure out whether comprehensive treatment after the birth of a premature baby will affect its chances for survival. In order to solve this problem, we need to use causal inference.
The python library we’ll be using to perform causal inference to solve this problem is called DoWhy, a well-documented library created by researchers from Microsoft.
每年,有 110 万早产儿死亡。换句话说,每年有7.3 **%*的早产儿死亡。*数以百万计的父母不得不在他们无法控制的过程中经历失去孩子的悲伤、痛苦和痛苦。那是个问题。假设我们想弄清楚早产儿出生后的综合治疗是否会影响其生存机会。为了解决这个问题,我们需要使用因果推理。
我们将用于执行因果推理以解决此问题的 Python 库称为DoWhy,这是一个由 Microsoft 研究人员创建的有据可查的库。

A Quick Lesson on Causality
First, a quick lesson on causality (if you already know the basics, you can skip this section; if you prefer to watch a video, lucky you, I made one that you can watch here).
Causality is all about interventions, about **doing. **Standard statistics is all about correlations, which are all good and fun, but correlations can lead to wrong assumptions which can lead to a lot worse things.
关于因果关系的快速课程
首先,关于因果关系的快速课程(如果您已经了解基础知识,可以跳过此部分;如果您更喜欢观看视频,幸运的是,我制作了一个您可以在这里观看的视频)。
因果关系是关于干预的,关于**做的。**标准统计都是关于相关性的,这些都是好的和有趣的,但相关性会导致错误的假设,从而导致更糟糕的事情。
This is a graph showing the correlative relationship between Exercise and Cholesterol (which *looks like a causal relationship but is not). *If we just look at the correlative relationship between cholesterol and exercise, it looks like there’s a causal relationship between the two. But this correlation actually happens because both cholesterol and exercise share a common cause or confounder: age.
这是一个图表,显示了运动和胆固醇之间的相关关系(*看起来像因果关系,但实际上不是)。*如果我们只看胆固醇和运动之间的相关关系,看起来两者之间存在因果关系。但这种相关性实际上发生是因为胆固醇和运动都有一个共同的原因或混杂因素:年龄。
In correlations, the notation is P(x|y) i.e. the probability of x given y: for example, the probability of a disease given an active gene. However, in causal calculus, a very small but important change is made. **Instead of P(x|y) it’s P(x|do(y)) **i.e. the probability of x given that y is done: for example, the probability of a disease given that I start a diet. The ‘do’ is very important: it represents the intervention, the actual doing of something that will cause the effect.
在相关性中,符号是 P(x|y),即给定 y 的 x 概率:例如,给定活性基因的疾病概率。然而,在因果演算中,发生了一个非常小但很重要的变化。不是 P(x|y) 而是 P(x|do(y)) ,即给定 y 完成后 x 的概率**:例如,给定我开始节食的情况下发生疾病的概率。“做”非常重要:它代表干预,即实际做的事情会导致效果。**
If this ‘do’ stuff still isn’t making too much sense, let me take you through another example:
Take air-pressure and a barometer. There is a correlation between the reading on a barometer and the air-pressure, but, in a standard correlation (P(x|y)) we wouldn’t be able to tell which one caused which. However if we switched it up to causal calculus, otherwise known as do-calculus (yes, the ‘do’ is everywhere) we could ask a question like, “What is the probability of a high barometer reading given that the pressure increases?” Increasing the pressure is the act of doing, and through doing and intervening, we can see if there is a clear causal relationship between the two variables. (Clearly we would see an increase in the barometer reading if we increased the pressure).
This works vice-versa as well. If we changed the reading on the barometer (by twisting a knob or something, which is an act of doing) we would not see the air-pressure change because the barometer reading does not cause the air-pressure. The air-pressure affects the barometer reading.
如果这个“做”的东西仍然没有太大意义,让我带你看另一个例子:
测量气压和气压计。气压计上的读数与气压之间存在相关性,但是,在标准相关性 (P(x|y)) 中,我们无法分辨是哪个导致了哪个。但是,如果我们将其转换为因果演算,也称为 do-calculus(是的,'do' 无处不在),我们可以问这样的问题:“鉴于压力增加,气压计读数高的概率是多少?” 增加压力是做的行为,通过做和干预,我们可以看到两个变量之间是否存在明显的因果关系。(显然,如果我们增加压力,我们会看到气压计读数增加)。
反之亦然。如果我们改变了气压表读数(通过扭动旋钮或东西,这是一种行为做),我们将不会看到空气压力的变化,因为气压计的读数不会造成空气压力。气压会影响气压计读数。
air pressure -> barometer reading. source.
However, the air pressure and barometer example is pretty simple; there are only two factors. In real life, there are countless factors that each have some sort of causal relationship with the others.
然而,气压和气压计的例子非常简单;只有两个因素。在现实生活中,有无数的因素相互之间存在某种因果关系。


an example of a causal diagram. image source.In the diagram, “traffic jam” is a confounder or common cause for “late for school” and “long queues”. =Confounders are variables that have a causal relationship with two variables that we want to test a causal relationship between=**.** If we wanted to test the causal relationship between “late for school” and “long queues”, we would have to account for “traffic jam” in order to make sure of the validity of the causal relationship found between “late for school” and “long queues”, as in the cholesterol example of above. **In causal inference, we always need to account for confounders because they introduce correlations that muddle the causal diagram.**
在图中,“堵车”是“上学迟到”和“排长队”的混杂因素或常见原因。 =**混杂因素是与两个变量之间存在因果关系的变量,我们要测试它们之间的因果关系**=**. **如果要检验“上学迟到”和“排长队”之间的因果关系,就必须考虑“堵车”,以确保“上学迟到”和“大排长龙”之间因果关系的有效性。 “排长队”,如上面的胆固醇示例。**在因果推断中,我们总是需要考虑混杂因素,因为它们引入了混淆因果图的相关性。**
IHDP Dataset
Ok now that we have a good understanding of basic causality, let’s actually get to the code and test the causal relationship between the wellbeing of a premature twin and intervention. We’ll be using the dataset from the Infant Health and Development Program (IHDP) which collected data on premature infants in randomized trials in the US from 1985–1988. Randomization is key because it provides an unbiased account of the world. Because this data was collected in an RCT, causal inference is not necessary, but we will still do it to show how it works.
好的,现在我们对基本因果关系有了很好的理解,让我们实际进入代码并测试早产双胞胎的健康与干预之间的因果关系。我们将使用来自婴儿健康与发展计划 (IHDP) 的数据集,该数据集收集了 1985 年至 1988 年美国随机试验中早产儿的数据。随机化是关键,因为它提供了对世界的公正描述。因为这些数据是在 RCT 中收集的,所以不需要因果推断,但我们仍然会这样做以展示它是如何工作的。
An intensive intervention extending from hospital discharge to 36 months corrected age was administered between 1985 and 1988 at eight different sites. The study sample of infants was stratified by birth weight (2,000 grams or less, 2,001–2,500 grams) and randomized to the Intervention Group or the Follow-Up Group. The Intervention Group received home visits, attendance at a special child development center, and pediatric follow-up. The Follow-Up Group received only the pediatric follow-up component of the program.** Measures of cognitive development, behavioral status, health status, and other variables were collected from both groups** at predetermined time points…. The many other variables and indices in the data collection include site, pregnancy complications, child’s birth weight and gestation age, birth order, child’s gender, household composition, day care arrangements, source of health care, quality of the home environment, parents’ race and ethnicity, and maternal age, education, IQ, and employment. — from the HMCA archive.
1985 年至 1988 年间,在八个不同地点进行了从出院到矫正年龄 36 个月的强化干预。婴儿的研究样本按出生体重(2,000 克或更少,2,001-2,500 克)进行分层,并随机分配 **到干预组或随访组。**干预小组接受了家访、特殊儿童发展中心的出勤和儿科随访。随访小组仅收到该计划的儿科随访部分。从两组中收集认知发展、行为状态、健康状况和其他变量的测量在预定的时间点…… 数据收集中的许多其他变量和指标包括地点、妊娠并发症、孩子的出生体重和胎龄、出生顺序、孩子的性别、家庭组成、日托安排、医疗保健来源、家庭环境质量、父母种族和种族、母亲的年龄、教育、智商和就业。—来自HMCA 档案。
The Code
First, let’s import the required package and load the data.
首先,让我们导入所需的包并加载数据。
import dowhy
from dowhy import CausalModel
import pandas as pd
import numpy as npdata= pd.read_csv(“https://raw.githubusercontent.com/AMLab-Amsterdam/CEVAE/master/datasets/IHDP/csv/ihdp_npci_1.csv", header = None)col = [“treatment”, “y_factual”, “y_cfactual”, “mu0”, “mu1” ,]for i in range(1,26):
 col.append(“x”+str(i))data.columns = col
data = data.astype({“treatment”:’bool’}, copy=False)
print(data.head())
____________________________________________________________________  treatment y_factual y_cfactual mu0      … x22 x23 x24 x250 True      5.599916 4.318780    3.268256 … 0   0   0   01 False     6.875856 7.856495    6.636059 … 0   0   0   02 False     2.996273 6.633952    1.570536 … 0   0   0   03 False     1.366206 5.697239    1.244738 … 0   0   0   04 False     1.963538 6.202582    1.685048 … 0   0   0   0
Treatment here is the intervention. Y_factual is the outcome, quantified through the combination of the mental, behavioral, and health statuses of the infants. All the x’s (x1 to x25) are confounders** **of the outcome and the intervention: variables like gender, race, quality of home-care, etc. **We’re trying to figure out the causal relationship between the treatment and the outcome, while accounting for the confounders. **(Technically we don’t have to account for these confounders because the data was collected through a randomized trial and any bias that would build up with them would be wiped out. However, it’s still a good idea to account for them, and it’s absolutely necessary to account for them when the data is observational).
We don’t care about y_cfactual, mu0, and mu1 (they’re used by the creators of the GitHub linked in the code (a super cool project on a Causal Effect Variational AutoEncoder, or CEVAE, that you should totally check out))
这里的治疗是干预。Y_factual 是结果,通过婴儿的心理、行为和健康状况的组合进行量化。所有 x(x1 到 x25)都是** **结果和干预的混杂因素:性别、种族、家庭护理质量等变量。我们试图找出治疗和结果之间的因果关系,同时考虑对于混杂者。(从技术上讲,我们不必考虑这些混杂因素,因为数据是通过随机试验收集的,任何由此产生的偏差都会被消除。但是,考虑到它们仍然是一个好主意,而且绝对是当数据是观察性的时,必须考虑它们)。
我们不关心 y_cfactual、mu0 和 mu1(它们被代码中链接的 GitHub 的创建者使用(一个关于因果效应变分自动编码器的超酷项目,或CEVAE,你应该完全检查一下))
If you’re interested in what they are:
y_cfactual is a counterfactual, which is a question about something that didn’t happen, like “What would happen if I…?” In this case, it's a prediction as to what would happen if there was, or was not, an intervention (depending on the context). **Counterfactuals are extremely important in causality because most of the times we aren’t always able to get all the data. **For example, if we wanted to test the effectiveness of two different treatments on a single person, we would not be able to test both of them. Counterfactuals address the “imaginary” treatment that did not actually get administered, and we, as humans, use counterfactuals all the time (every time you imagine an alternate situation). If you’re more interested about them, read this great blog post here.
Mu0 and mu1 are conditional means, in other words the expected or average value of y_factual with and without a treatment. The creators of the GitHub used these variables (y_cfactual, mu0, and mu1) to test the strength of the CEVAE.
Ok so now we have all the data setup, organized in a way that is convenient for causal inference. It’s time to actually do causal inference.
如果你对它们感兴趣:
y_cfactual 是一个反事实,这是一个关于没有发生的事情的问题,比如“如果我......会发生什么?” 在这种情况下,它是对有或没有干预(取决于上下文)会发生什么的预测。**反事实在因果关系中非常重要,因为大多数时候我们并不总是能够获得所有数据。**例如,如果我们想在一个人身上测试两种不同治疗方法的有效性,我们将无法同时测试它们。反事实解决了实际上并未实施的“想象”治疗,作为人类,我们一直在使用反事实(每次您想象另一种情况时)。如果您对它们更感兴趣,请在此处阅读这篇很棒的博客文章.
Mu0 和 mu1 是条件均值,换句话说,是经过和不经过处理的 y_factual 的预期或平均值。GitHub 的创建者使用这些变量(y_cfactual、mu0 和 mu1)来测试 CEVAE 的强度。
好的,现在我们有了所有的数据设置,以方便因果推断的方式组织。现在是实际进行因果推断的时候了。
Causal Inference with DoWhy!
DoWhy breaks down causal inference into four simple steps: *model, identify, estimate, and refute. *We’ll follow these steps as we perform causal inference.
使用 DoWhy 进行因果推断!
DoWhy 将因果推理分解为四个简单的步骤:*建模、识别、估计和反驳。*我们将在执行因果推理时遵循这些步骤。
模型
Model
# Create a causal model from the data and given common causes.
xs = ""
for i in range(1,26):
    xs += ("x"+str(i)+"+")model=CausalModel(
        data = data,
        treatment='treatment',
        outcome='y_factual',
        common_causes=xs.split('+')
        )
This code actually takes the data and makes a causal model, or causal diagram, with it.
这段代码实际上获取数据并用它制作因果模型或因果图。

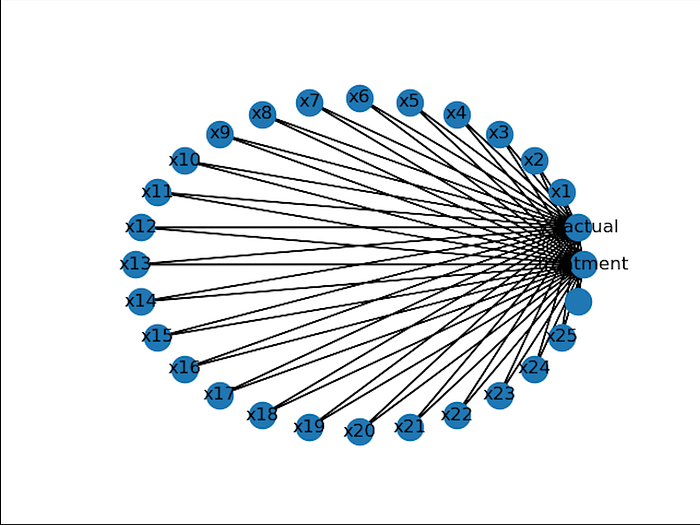
the (visually unpleasant) graph created by DoWhy of the causal modelEven though we aren’t printing anything out, DoWhy will still give us warnings and information updates about our causal inference (which is super nice for beginners). In this case, it gives us:
即使我们没有打印任何内容,DoWhy 仍会向我们提供有关因果推断的警告和信息更新(这对初学者来说非常好)。在这种情况下,它给了我们:
WARNING:dowhy.causal_model:Causal Graph not provided. DoWhy will construct a graph based on data inputs.
INFO:dowhy.causal_model:Model to find the causal effect of treatment ['treatment'] on outcome ['y_factual']
Identify
#Identify the causal effect
identified_estimand = model.identify_effect()
print(identified_estimand)
The identify step uses the causal diagram created from the model step and identifies all the causal relationships. This code prints out:
识别步骤使用从模型步骤创建的因果图并识别所有因果关系。此代码打印出:
INFO:dowhy.causal_identifier:Common causes of treatment and outcome:['', 'x6', 'x3', 'x14', 'x10', 'x16', 'x9', 'x17', 'x13', 'x4', 'x11', 'x1', 'x7', 'x24', 'x25', 'x20', 'x5', 'x21', 'x2', 'x19', 'x23', 'x8', 'x15', 'x18', 'x22', 'x12']WARNING:dowhy.causal_identifier:If this is observed data (not from a randomized experiment), there might always be missing confounders. Causal effect cannot be identified perfectly.WARN: Do you want to continue by ignoring any unobserved confounders? (use proceed_when_unidentifiable=True to disable this prompt) [y/n] yINFO:dowhy.causal_identifier:Instrumental variables for treatment and outcome:[]Estimand type: nonparametric-ate### Estimand : 1Estimand name: backdoorEstimand expression:d(Expectation(y_factual|x6,x3,x14,x10,x16,x9,x17,x13,x4,x11,x1,x7,x24,x25,x20,x5,x21,x2,x19,x23,x8,x15,x18,x22,x12)) / d[treatment]Estimand assumption 1, Unconfoundedness: If U→{treatment} and U→y_factual then P(y_factual|treatment,x6,x3,x14,x10,x16,x9,x17,x13,x4,x11,x1,x7,x24,x25,x20,x5,x21,x2,x19,x23,x8,x15,x18,x22,x12,U) = P(y_factual|treatment,x6,x3,x14,x10,x16,x9,x17,x13,x4,x11,x1,x7,x24,x25,x20,x5,x21,x2,x19,x23,x8,x15,x18,x22,x12)### Estimand : 2Estimand name: ivNo such variable found!
Since we’re not trying to find 2 causal relationships (just trying to find the effect of intervention on outcome) estimand 2 is not found.
由于我们不是试图找到 2 个因果关系(只是试图找到干预对结果的影响),因此未找到 estimand 2。
Estimate 估计
Using the estimand (the causal relationship identified) we can now estimate the strength of this causal relationship. There are many methods available to us (propensity-based-matching, additive noise modeling), but in this tutorial, we’ll stick to good ol’ fashioned linear regression.
使用估计量(确定的因果关系),我们现在可以估计这种因果关系的强度。我们有很多可用的方法(基于倾向的匹配、加性噪声建模),但在本教程中,我们将坚持使用老式的线性回归。
# Estimate the causal effect and compare it with Average Treatment Effectestimate = model.estimate_effect(identified_estimand, method_name="backdoor.linear_regression", test_significance=True)print(estimate)print("Causal Estimate is " + str(estimate.value))data_1 = data[data["treatment"]==1]
data_0 = data[data["treatment"]==0]
print("ATE", np.mean(data_1["y_factual"])- np.mean(data_0["y_factual"]))
Using linear regression, the model trains on the cause (the intervention) and the effect (the wellbeing of the premature baby) and identifies the strength in the relationship between the two. I also printed out the ATE (Average Treatment Effect (the difference between the averages of the group that received treatment from the group that didn’t)) The ATE is a good indicator/number we can check out causal effect with, in this case, because the data was retrieved in randomized trials instead of from observational data. Observational data would have unobserved confounders (factors that affect both the treatment and the outcome) or instrumental variables (factors that only affect the treatment and are thus correlated with the outcome) that ATE would not be able to account for.** ATE is not the same as the causal effect found through linear regression because it does not account for confounders.**
该模型使用线性回归对原因(干预)和结果(早产儿的健康)进行训练,并确定两者之间关系的强度。我还打印了 ATE(平均治疗效果(接受治疗的组的平均值与未接受治疗的组之间的差异))ATE 是一个很好的指标/数字,我们可以用它来检查因果关系,在这种情况下,因为数据是在随机试验中检索的,而不是从观察数据中检索的。观察性数据将具有 ATE 无法解释的未观察到的混杂因素(影响治疗和结果的因素)或工具变量(仅影响治疗并因此与结果相关的因素)。** ATE 与通过线性回归发现的因果效应不同,因为它没有考虑混杂因素。**
INFO:dowhy.causal_estimator:INFO: Using Linear Regression EstimatorINFO:dowhy.causal_estimator:b: y_factual~treatment+x6+x3+x14+x10+x16+x9+x17+x13+x4+x11+x1+x7+x24+x25+x20+x5+x21+x2+x19+x23+x8+x15+x18+x22+x12*** Causal Estimate ***--prints out the estimand again––## Realized estimandb:y_factual~treatment+x6+x3+x14+x10+x16+x9+x17+x13+x4+x11+x1+x7+x24+x25+x20+x5+x21+x2+x19+x23+x8+x15+x18+x22+x12## EstimateValue: 3.928671750872714## Statistical Significancep-value: <0.001Causal Estimate is 3.928671750872714ATE 4.021121012430832
As you can see, the ATE is pretty close to the Causal Estimate that we got. The ~4 is the difference in wellbeing of the premature babies that had care vs. those who didn’t. The number 4 doesn’t have much meaning semantically because it is the literal difference of the outcome between the two groups, and the outcome, in this case, was a combination of a variety of other factors. If you take a look back at the 5 cases that were printed out, the differences between the two are about 4.
如您所见,ATE 与我们得到的因果估计非常接近。~4 是得到护理的早产儿与没有护理的早产儿的健康差异。数字 4 在语义上没有多大意义,因为它是两组之间结果的字面差异,在这种情况下,结果是各种其他因素的组合。回顾一下打印出来的5个案例,两者相差4个左右。
Refute
The refute steps tests the strength and validity of the causal effect found by the estimate step. There are a variety of different refutation methods, eg. Subset Validation (using only a subset of the data to estimate the causal effect) or Placebo Treatment (turning the treatment into a placebo and seeing its effect on the outcome (the placebo treatment refutation expects the causal effect to go down)) In this case, we’ll be adding an irrelevant common cause to test the strength of the causal relationship between the treatment and outcome. This is useful because it changes the causal model but not the relationship between y_factual and treatment.
反驳步骤测试估计步骤发现的因果效应的强度和有效性。有多种不同的反驳方法,例如。子集验证(仅使用数据的子集来估计因果效应)或安慰剂治疗(将治疗转化为安慰剂并观察其对结果的影响(安慰剂治疗反驳预计因果效应会下降))在这种情况下,我们将添加一个不相关的共同原因来测试治疗和结果之间因果关系的强度。这很有用,因为它改变了因果模型,而不是 y_factual 和治疗之间的关系。
refute_results=model.refute_estimate(identified_estimand, estimate,
        method_name="random_common_cause")
print(refute_results)
____________________________________________________________________INFO:dowhy.causal_estimator:INFO: Using Linear Regression EstimatorINFO:dowhy.causal_estimator:b: y_factual~treatment+x22+x4+x24+x7+x20+x19+x21+x1+x23+x2+x12+x18+x3+x10+x14+x11+x16+x9+x13+x5+x17+x15+x6+x8+x25+w_randomRefute: Add a Random Common CauseEstimated effect:(3.928671750872715,)New effect:(3.9280606136724203,)
Adding a random common cause didn’t have much of an effect on the causal effect (as expected) and so we can be more assured of the strength of the causal relationship.
添加随机的共同原因对因果关系没有太大影响(正如预期的那样),因此我们可以更加确定因果关系的强度。
OK, so we just found out that there is a clear causal relationship between intervention on premature babies and their wellbeing using causal inference with DoWhy. In the future, instead of performing causal inference in narrow examples like this, we want a system that can understand causal relationships generally without much data. Right now, we still don’t even understand how the brain understands cause-and-effect, but now that we understand how to perform causal inference from a statistical perspective, we are much better prepared to tackle that problem. To create Artificial General Intelligence, causality needs to be understood and implemented generally, and I hope to work on such a project in the near future!
好的,所以我们刚刚发现,使用 DoWhy 的因果推断,对早产儿的干预与他们的健康之间存在明显的因果关系。未来,我们不再需要像这样在狭隘的例子中进行因果推断,**而是需要一个可以在没有太多数据的情况下理解因果关系的系统。**现在,我们甚至还不明白大脑是如何理解因果关系的,但是现在我们了解了如何从统计角度进行因果推断,我们已经为解决这个问题做好了更好的准备。要创建通用人工智能,需要普遍理解和实现因果关系,我希望在不久的将来从事这样的项目!
I hope you enjoyed this article and understood the power of causality and how to perform causal inference with DoWhy! If you have any questions or want to talk, feel free to email me at kevn.wanf@gmail.com or connect with me on LinkedIn!